

PM2.5 polluters disproportionately and systemically affect people of color in the United States
- PMID: 33910895
- PMCID: PMC11426197
- DOI: 10.1126/sciadv.abf4491
PM2.5 polluters disproportionately and systemically affect people of color in the United States
Abstract
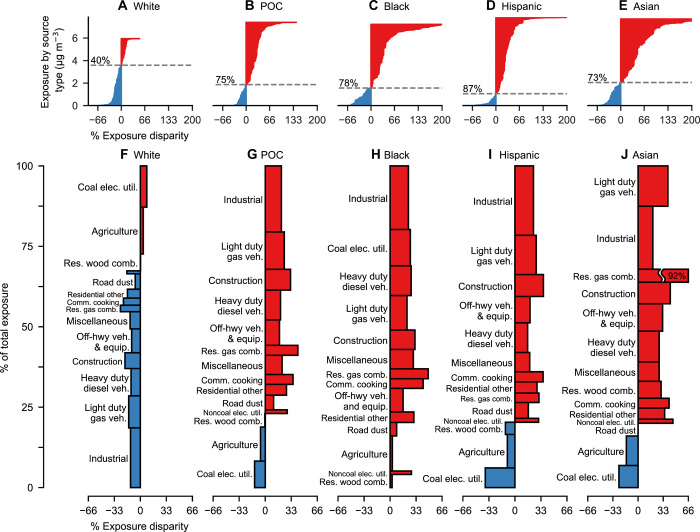
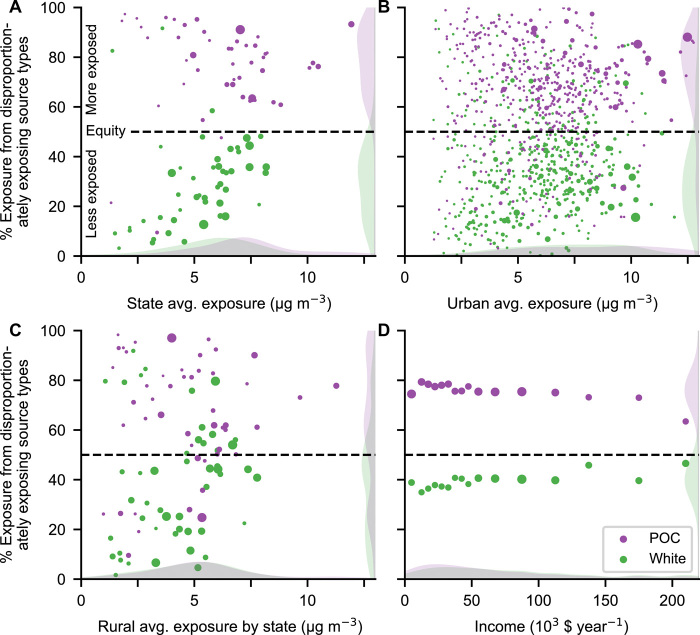
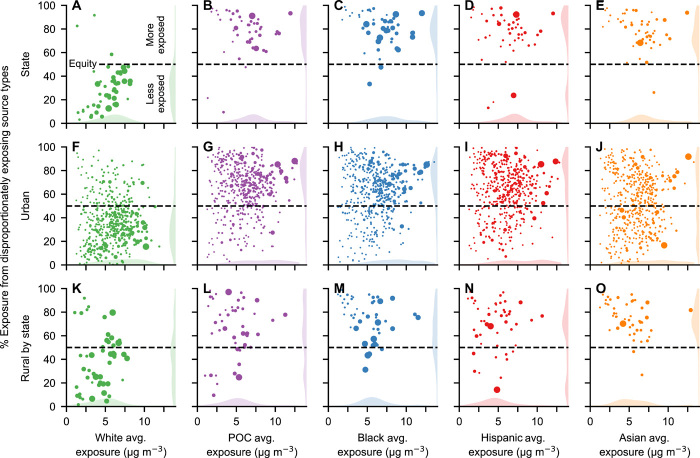
Racial-ethnic minorities in the United States are exposed to disproportionately high levels of ambient fine particulate air pollution (PM2.5), the largest environmental cause of human mortality. However, it is unknown which emission sources drive this disparity and whether differences exist by emission sector, geography, or demographics. Quantifying the PM2.5 exposure caused by each emitter type, we show that nearly all major emission categories-consistently across states, urban and rural areas, income levels, and exposure levels-contribute to the systemic PM2.5 exposure disparity experienced by people of color. We identify the most inequitable emission source types by state and city, thereby highlighting potential opportunities for addressing this persistent environmental inequity.
Copyright © 2021 The Authors, some rights reserved; exclusive licensee American Association for the Advancement of Science. No claim to original U.S. Government Works. Distributed under a Creative Commons Attribution License 4.0 (CC BY).
Figures
References
-
- Institute for Health Metrics and Evaluation (IHME), GBD Compare Data Visualization, accessed December 10, 2018; http://ghdx.healthdata.org/gbd-results-tool.
-
- Burnett R., Chen H., Szyszkowicz M., Fann N., Hubbell B., Pope C. A. III, Apte J. S., Brauer M., Cohen A., Weichenthal S., Coggins J., di Q., Brunekreef B., Frostad J., Lim S. S., Kan H., Walker K. D., Thurston G. D., Hayes R. B., Lim C. C., Turner M. C., Jerrett M., Krewski D., Gapstur S. M., Diver W. R., Ostro B., Goldberg D., Crouse D. L., Martin R. V., Peters P., Pinault L., Tjepkema M., van Donkelaar A., Villeneuve P. J., Miller A. B., Yin P., Zhou M., Wang L., Janssen N. A. H., Marra M., Atkinson R. W., Tsang H., Quoc Thach T., Cannon J. B., Allen R. T., Hart J. E., Laden F., Cesaroni G., Forastiere F., Weinmayr G., Jaensch A., Nagel G., Concin H., Spadaro J. V., Global estimates of mortality associated with long-term exposure to outdoor fine particulate matter. Proc. Natl. Acad. Sci. 115, 9592–9597 (2018). - PMC - PubMed
-
- Pope C. A. III, Dockery D. W., Health effects of fine particulate air pollution: Lines that connect. J. Air Waste Manage. Assoc. 56, 709–742 (2006). - PubMed
-
- Crouse D. L., Peters P. A., van Donkelaar A., Goldberg M. S., Villeneuve P. J., Brion O., Khan S., Atari D. O., Jerrett M., Pope C. A., Brauer M., Brook J. R., Martin R. V., Stieb D., Burnett R. T., Risk of nonaccidental and cardiovascular mortality in relation to long-term exposure to low concentrations of fine particulate matter: A Canadian national-level cohort study. Environ. Health Perspect. 120, 708–714 (2012). - PMC - PubMed
-
- Brook R. D., Rajagopalan S., Pope C. A. III, Brook J. R., Bhatnagar A., Diez-Roux A. V., Holguin F., Hong Y., Luepker R. V., Mittleman M. A., Peters A., Siscovick D., Smith S. C. Jr., Whitsel L., Kaufman J. D.; American Heart Association Council on Epidemiology and Prevention, Council on the Kidney in Cardiovascular Disease, and Council on Nutrition, Physical Activity and Metabolism , Particulate matter air pollution and cardiovascular disease: An update to the scientific statement from the American Heart Association. Circulation 121, 2331–2378 (2010). - PubMed
Publication types
Grants and funding
LinkOut - more resources
Full Text Sources
Other Literature Sources
