

Population genomic evidence of Plasmodium vivax Southeast Asian origin
- PMID: 33910900
- PMCID: PMC8081369
- DOI: 10.1126/sciadv.abc3713
Population genomic evidence of Plasmodium vivax Southeast Asian origin
Abstract
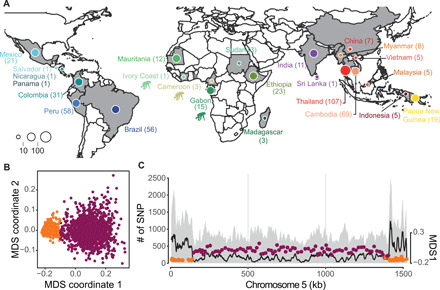
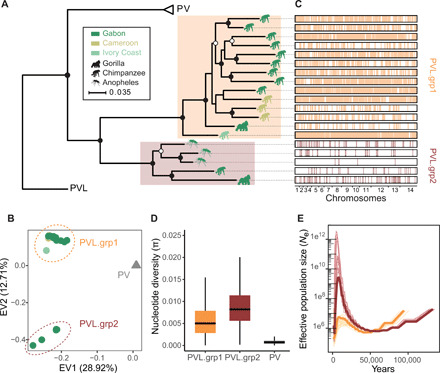
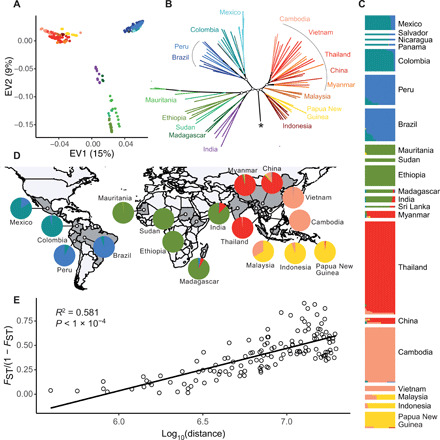
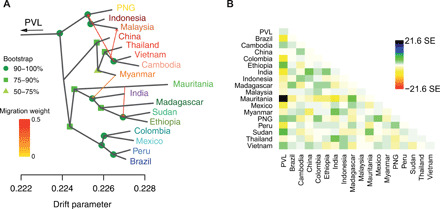
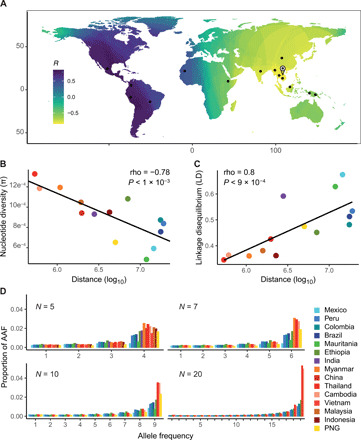
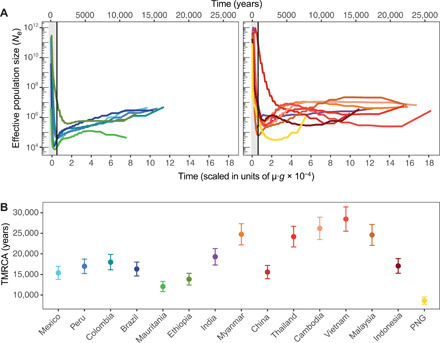
Plasmodium vivax is the most common and widespread human malaria parasite. It was recently proposed that P. vivax originates from sub-Saharan Africa based on the circulation of its closest genetic relatives (P. vivax-like) among African great apes. However, the limited number of genetic markers and samples investigated questions the robustness of this hypothesis. Here, we extensively characterized the genomic variations of 447 human P. vivax strains and 19 ape P. vivax-like strains collected worldwide. Phylogenetic relationships between human and ape Plasmodium strains revealed that P. vivax is a sister clade of P. vivax-like, not included within the radiation of P. vivax-like By investigating various aspects of P. vivax genetic variation, we identified several notable geographical patterns in summary statistics in function of the increasing geographic distance from Southeast Asia, suggesting that P. vivax may have derived from a single area in Asia through serial founder effects.
Copyright © 2021 The Authors, some rights reserved; exclusive licensee American Association for the Advancement of Science. No claim to original U.S. Government Works. Distributed under a Creative Commons Attribution NonCommercial License 4.0 (CC BY-NC).
Figures
Similar articles
-
Apicoplast phylogeny reveals the position of Plasmodium vivax basal to the Asian primate malaria parasite clade.Sci Rep. 2019 May 13;9(1):7274. doi: 10.1038/s41598-019-43831-1. Sci Rep. 2019. PMID: 31086239 Free PMC article.
-
Progress in understanding the phylogeny of the Plasmodium vivax lineage.Parasitol Int. 2022 Apr;87:102507. doi: 10.1016/j.parint.2021.102507. Epub 2021 Nov 12. Parasitol Int. 2022. PMID: 34781012 Review.
-
Out of Africa: origins and evolution of the human malaria parasites Plasmodium falciparum and Plasmodium vivax.Int J Parasitol. 2017 Feb;47(2-3):87-97. doi: 10.1016/j.ijpara.2016.05.008. Epub 2016 Jul 2. Int J Parasitol. 2017. PMID: 27381764 Free PMC article. Review.
-
Plasmodium vivax populations revisited: mitochondrial genomes of temperate strains in Asia suggest ancient population expansion.BMC Evol Biol. 2012 Feb 17;12:22. doi: 10.1186/1471-2148-12-22. BMC Evol Biol. 2012. PMID: 22340143 Free PMC article.
-
Phylogeny of Asian primate malaria parasites inferred from apicoplast genome-encoded genes with special emphasis on the positions of Plasmodium vivax and P. fragile.Gene. 2010 Jan 15;450(1-2):32-8. doi: 10.1016/j.gene.2009.10.001. Gene. 2010. PMID: 19818838
Cited by
-
Why Plasmodium vivax and Plasmodium falciparum are so different? A tale of two clades and their species diversities.Malar J. 2022 May 3;21(1):139. doi: 10.1186/s12936-022-04130-9. Malar J. 2022. PMID: 35505356 Free PMC article. Review.
-
Three Signatures of Adaptive Polymorphism Exemplified by Malaria-Associated Genes.Mol Biol Evol. 2021 Apr 13;38(4):1356-1371. doi: 10.1093/molbev/msaa294. Mol Biol Evol. 2021. PMID: 33185667 Free PMC article.
-
Comparative transcriptomics reveal differential gene expression among Plasmodium vivax geographical isolates and implications on erythrocyte invasion mechanisms.PLoS Negl Trop Dis. 2024 Jan 29;18(1):e0011926. doi: 10.1371/journal.pntd.0011926. eCollection 2024 Jan. PLoS Negl Trop Dis. 2024. PMID: 38285730 Free PMC article.
-
Evolutionary history of Plasmodium vivax and Plasmodium simium in the Americas.Malar J. 2022 May 3;21(1):141. doi: 10.1186/s12936-022-04132-7. Malar J. 2022. PMID: 35505431 Free PMC article. Review.
-
Population genomic evidence of structured and connected Plasmodium vivax populations under host selection in Latin America.Ecol Evol. 2024 Mar 24;14(3):e11103. doi: 10.1002/ece3.11103. eCollection 2024 Mar. Ecol Evol. 2024. PMID: 38529021 Free PMC article.
References
-
- Battle K. E., Lucas T. C. D., Nguyen M., Howes R. E., Nandi A. K., Twohig K. A., Pfeffer D. A., Cameron E., Rao P. C., Casey D., Gibson H. S., Rozier J. A., Dalrymple U., Keddie S. H., Collins E. L., Harris J. R., Guerra C. A., Thorn M. P., Bisanzio D., Fullman N., Huynh C. K., Kulikoff X., Kutz M. J., Lopez A. D., Mokdad A. H., Naghavi M., Nguyen G., Shackelford K. A., Vos T., Wang H., Lim S. S., Murray C. J. L., Price R. N., Baird J. K., Smith D. L., Bhatt S., Weiss D. J., Hay S. I., Gething P. W., Mapping the global endemicity and clinical burden of Plasmodium vivax, 2000–17: A spatial and temporal modelling study. Lancet 394, 332–343 (2019). - PMC - PubMed
-
- Horuk R., Chitnis C. E., Darbonne W. C., Colby T. J., Rybicki A., Hadley T. J., Miller L. H., A receptor for the malarial parasite Plasmodium vivax: The erythrocyte chemokine receptor. Science 261, 1182–1184 (1993). - PubMed
-
- Chaudhuri A., Zbrzezna V., Polyakova J., Pogo A. O., Hesselgesser J., Horuk R., Expression of the Duffy antigen in K562 cells. Evidence that it is the human erythrocyte chemokine receptor. J. Biol. Chem. 269, 7835–7838 (1994). - PubMed
Publication types
LinkOut - more resources
Full Text Sources
Other Literature Sources
Research Materials
Miscellaneous
