

Southern Ocean anthropogenic carbon sink constrained by sea surface salinity
- PMID: 33910904
- PMCID: PMC8081370
- DOI: 10.1126/sciadv.abd5964
Southern Ocean anthropogenic carbon sink constrained by sea surface salinity
Abstract
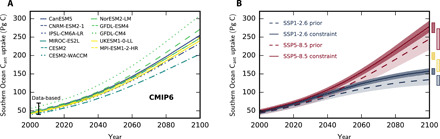
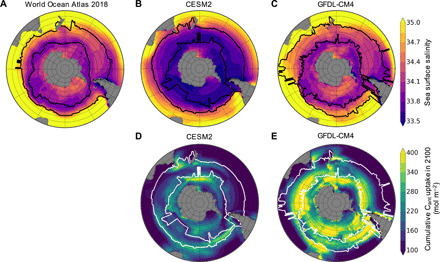
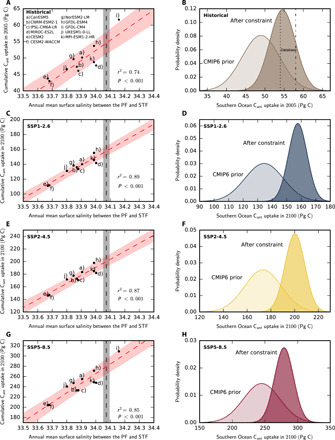
The ocean attenuates global warming by taking up about one quarter of global anthropogenic carbon emissions. Around 40% of this carbon sink is located in the Southern Ocean. However, Earth system models struggle to reproduce the Southern Ocean circulation and carbon fluxes. We identify a tight relationship across two multimodel ensembles between present-day sea surface salinity in the subtropical-polar frontal zone and the anthropogenic carbon sink in the Southern Ocean. Observations and model results constrain the cumulative Southern Ocean sink over 1850-2100 to 158 ± 6 petagrams of carbon under the low-emissions scenario Shared Socioeconomic Pathway 1-2.6 (SSP1-2.6) and to 279 ± 14 petagrams of carbon under the high-emissions scenario SSP5-8.5. The constrained anthropogenic carbon sink is 14 to 18% larger and 46 to 54% less uncertain than estimated by the unconstrained estimates. The identified constraint demonstrates the importance of the freshwater cycle for the Southern Ocean circulation and carbon cycle.
Copyright © 2021 The Authors, some rights reserved; exclusive licensee American Association for the Advancement of Science. No claim to original U.S. Government Works. Distributed under a Creative Commons Attribution NonCommercial License 4.0 (CC BY-NC).
Figures
Similar articles
-
Anthropogenic carbon dioxide transport in the Southern Ocean driven by Ekman flow.Nature. 2010 Jan 7;463(7277):80-3. doi: 10.1038/nature08687. Nature. 2010. PMID: 20054394
-
Regional Wind Variability Modulates the Southern Ocean Carbon Sink.Sci Rep. 2019 May 14;9(1):7384. doi: 10.1038/s41598-019-43826-y. Sci Rep. 2019. PMID: 31089173 Free PMC article.
-
Emergent constraint on Arctic Ocean acidification in the twenty-first century.Nature. 2020 Jun;582(7812):379-383. doi: 10.1038/s41586-020-2360-3. Epub 2020 Jun 17. Nature. 2020. PMID: 32555488
-
The Variable Southern Ocean Carbon Sink.Ann Rev Mar Sci. 2019 Jan 3;11:159-186. doi: 10.1146/annurev-marine-121916-063407. Epub 2018 Sep 13. Ann Rev Mar Sci. 2019. PMID: 30212259 Review.
-
Estimation of anthropogenic CO2 inventories in the ocean.Ann Rev Mar Sci. 2010;2:175-98. doi: 10.1146/annurev-marine-120308-080947. Ann Rev Mar Sci. 2010. PMID: 21141662 Review.
Cited by
-
Viruses under the Antarctic Ice Shelf are active and potentially involved in global nutrient cycles.Nat Commun. 2023 Dec 14;14(1):8295. doi: 10.1038/s41467-023-44028-x. Nat Commun. 2023. PMID: 38097581 Free PMC article.
-
Climate-driven variability of the Southern Ocean CO2 sink.Philos Trans A Math Phys Eng Sci. 2023 Jun 26;381(2249):20220055. doi: 10.1098/rsta.2022.0055. Epub 2023 May 8. Philos Trans A Math Phys Eng Sci. 2023. PMID: 37150207 Free PMC article.
-
Tracing the impacts of recent rapid sea ice changes and the A68 megaberg on the surface freshwater balance of the Weddell and Scotia Seas.Philos Trans A Math Phys Eng Sci. 2023 Jun 26;381(2249):20220162. doi: 10.1098/rsta.2022.0162. Epub 2023 May 8. Philos Trans A Math Phys Eng Sci. 2023. PMID: 37150196 Free PMC article.
-
Sparse observations induce large biases in estimates of the global ocean CO2 sink: an ocean model subsampling experiment.Philos Trans A Math Phys Eng Sci. 2023 Jun 26;381(2249):20220063. doi: 10.1098/rsta.2022.0063. Epub 2023 May 8. Philos Trans A Math Phys Eng Sci. 2023. PMID: 37150197 Free PMC article.
-
Global decline in net primary production underestimated by climate models.Commun Earth Environ. 2025;6(1):75. doi: 10.1038/s43247-025-02051-4. Epub 2025 Feb 1. Commun Earth Environ. 2025. PMID: 39897660 Free PMC article.
References
-
- Friedlingstein P., Jones M. W., O’Sullivan M., Andrew R. M., Hauck J., Peters G. P., Peters W., Pongratz J., Sitch S., Le Quéré C., Bakker D. C. E., Canadell J. G., Ciais P., Jackson R. B., Anthoni P., Barbero L., Bastos A., Bastrikov V., Becker M., Bopp L., Buitenhuis E., Chandra N., Chevallier F., Chini L. P., Currie K. I., Feely R. A., Gehlen M., Gilfillan D., Gkritzalis T., Goll D. S., Gruber N., Gutekunst S., Harris I., Haverd V., Houghton R. A., Hurtt G., Ilyina T., Jain A. K., Joetzjer E., Kaplan J. O., Kato E., Goldewijk K. K., Korsbakken J. I., Landschützer P., Lauvset S. K., Lefèvre N., Lenton A., Lienert S., Lombardozzi D., Marland G., McGuire P. C., Melton J. R., Metzl N., Munro D. R., Nabel J. E. M. S., Nakaoka S.-I., Neill C., Omar A. M., Ono T., Peregon A., Pierrot D., Poulter B., Rehder G., Resplandy L., Robertson E., Rödenbeck C., Séférian R., Schwinger J., Smith N., Tans P. P., Tian H., Tilbrook B., Tubiello F. N., van der Werf G. R., Wiltshire A. J., Zaehle S., Global carbon budget 2019. Earth Syst. Sci. Data 11, 1783–1838 (2019).
-
- Khatiwala S., Tanhua T., Mikaloff Fletcher S., Gerber M., Doney S. C., Graven H. D., Gruber N., McKinley G. A., Murata A., Ríos A. F., Sabine C. L., Global ocean storage of anthropogenic carbon. Biogeosciences 10, 2169–2191 (2013).
-
- Sabine C. L., Feely R. A., Gruber N., Key R. M., Lee K., Bullister J. L., Wanninkhof R., Wong C. S., Wallace D. W., Tilbrook B., Millero F. J., Peng T. H., Kozyr A., Ono T., Rios A. F., The oceanic sink for anthropogenic CO2. Science 305, 367–371 (2004). - PubMed
-
- Caldeira K., Duffy P. B., The role of the Southern Ocean in uptake and storage of anthropogenic carbon dioxide. Science 287, 620–622 (2000). - PubMed
-
- Mikaloff Fletcher S. E., Gruber N., Jacobson A. R., Doney S. C., Dutkiewicz S., Gerber M., Follows M., Joos F., Lindsay K., Menemenlis D., Mouchet A., Müller S. A., Sarmiento J. L., Inverse estimates of anthropogenic CO2 uptake, transport, and storage by the ocean. Glob. Biogeochem. Cycles 20, GB2002 (2006).
LinkOut - more resources
Full Text Sources
Other Literature Sources
