

The evolution of mammalian brain size
- PMID: 33910907
- PMCID: PMC8081360
- DOI: 10.1126/sciadv.abe2101
The evolution of mammalian brain size
Abstract
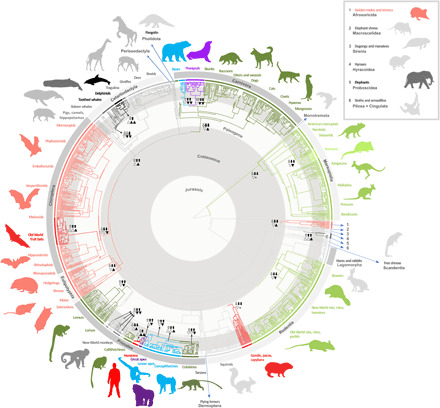
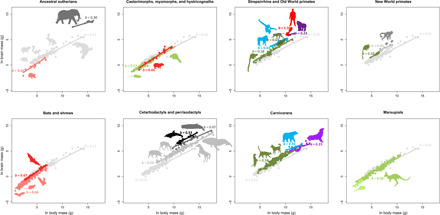
Relative brain size has long been considered a reflection of cognitive capacities and has played a fundamental role in developing core theories in the life sciences. Yet, the notion that relative brain size validly represents selection on brain size relies on the untested assumptions that brain-body allometry is restrained to a stable scaling relationship across species and that any deviation from this slope is due to selection on brain size. Using the largest fossil and extant dataset yet assembled, we find that shifts in allometric slope underpin major transitions in mammalian evolution and are often primarily characterized by marked changes in body size. Our results reveal that the largest-brained mammals achieved large relative brain sizes by highly divergent paths. These findings prompt a reevaluation of the traditional paradigm of relative brain size and open new opportunities to improve our understanding of the genetic and developmental mechanisms that influence brain size.
Copyright © 2021 The Authors, some rights reserved; exclusive licensee American Association for the Advancement of Science. No claim to original U.S. Government Works. Distributed under a Creative Commons Attribution NonCommercial License 4.0 (CC BY-NC).
Figures
References
-
- Eisenberg J. F., Wilson D. E., Relative brain size and feeding strategies in the Chiroptera. Evolution 32, 740–751 (1978). - PubMed
-
- Martin R. D., Relative brain size and basal metabolic rate in terrestrial vertebrates. Nature 293, 57–60 (1981). - PubMed
-
- M. Kleiber, The Fire of Life: An Introduction to Animal Energetics (John Wiley&Sons, Inc., 1961).
Publication types
LinkOut - more resources
Full Text Sources
Other Literature Sources
