. 2021 Oct;11(10):2638-2657.
doi: 10.1158/2159-8290.CD-20-1637. Epub 2021 Apr 28.

Cancer Cells Retrace a Stepwise Differentiation Program during Malignant Progression

Affiliations

Cancer Cells Retrace a Stepwise Differentiation Program during Malignant Progression

Sadegh Saghafinia et al. Cancer Discov. 2021 Oct.

Abstract

Pancreatic neuroendocrine tumors (PanNET) comprise two molecular subtypes, relatively benign islet tumors (IT) and invasive, metastasis-like primary (MLP) tumors. Until now, the origin of aggressive MLP tumors has been obscure. Herein, using multi-omics approaches, we revealed that MLP tumors arise from IT via dedifferentiation following a reverse trajectory along the developmental pathway of islet β cells, which results in the acquisition of a progenitor-like molecular phenotype. Functionally, the miR-181cd cluster induces the IT-to-MLP transition by suppressing expression of the Meis2 transcription factor, leading to upregulation of a developmental transcription factor, Hmgb3. Notably, the IT-to-MLP transition constitutes a distinct step of tumorigenesis and is separable from the classic proliferation-associated hallmark, temporally preceding accelerated proliferation of cancer cells. Furthermore, patients with PanNET with elevated HMGB3 expression and an MLP transcriptional signature are associated with higher-grade tumors and worse survival. Overall, our results unveil a new mechanism that modulates cancer cell plasticity to enable malignant progression. SIGNIFICANCE: Dedifferentiation has long been observed as a histopathologic characteristic of many cancers, albeit inseparable from concurrent increases in cell proliferation. Herein, we demonstrate that dedifferentiation is a mechanistically and temporally separable step in the multistage tumorigenesis of pancreatic islet cells, retracing the developmental lineage of islet β cells.This article is highlighted in the In This Issue feature, p. 2355.


Conflict of interest statement

Declaration of Interests

The authors declare no competing interests.

Figures

Figure 1
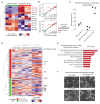
Figure 1. The aggressive MLP subtype of PanNET has a similar expression profile to islet β-cell progenitors
A. Multi-omics clustering of samples isolated via LCM from primary tumors and liver metastasis from the RT2 mice, as well as pancreatic islets and liver from wild type mice, in the C57Bl6/N, C57Bl6/J, and A/J genetic backgrounds. Samples of the IT and MLP subtype are colored as green and red, respectively. B-C. Heatmaps of protein levels, detected by mass spectrometry from LCM samples, of mature β-cell markers (B) and endocrine progenitor markers (C) in IT and MLP PanNET tumor samples. D-E. Gene Ontology (GO) categories significantly enriched (FDR q-value on the y-axis) for downregulated (D) and upregulated (E) genes in the MLP transcriptome signature. F. Schematic representation of mouse endocrine pancreas development depicting the stages from early progenitors (E9.5) to fully mature β-cells (P60). G. Score of the MLP mRNA signature in different embryonic stages during the secondary transition of mouse pancreatic development (left panel) and postnatal maturation (right panel). In both datasets there MLP score declines in the curse of differentiation. H. The MLP miRNA signature scores are high in endocrine pancreatic progenitor cells (E10), but not in mature β-cells. I. PCA analysis of samples from the temporal mouse pancreatic islet postnatal maturation phase compared to primary tumors and liver metastasis from the RT2 mouse model along with normal (non-transgenic) islets. The x-axis shows PC2, which represents a surrogate for dedifferentiation time-points. The samples from each cohort are separated in different rows (see also Supplementary Fig. S1K.)
Figure 2
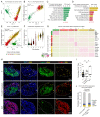
Figure 2. MicroRNA-181cd induces dedifferentiation when upregulated in IT cancer cells
A. Heatmap of differentially expressed MLP-signature miRNAs comparing mature β-cells and pancreatic progenitor cells from wild-type mice. B. Scatter plot showing the correlation between miR-181c (top) and miR-181d (bottom) expression (x-axis) and the MLP mRNA signature score (y-axis) in RT2 PanNET tumor samples. C. MLP mRNA-signature scores in cell cultures collected 24 hours and 7 days following induction of miR-181cd expression in the βTC3 IT-like cancer cell line, which reveals a transcriptional shift toward MLP after 7 days. D. Heatmap of MLP mRNA-signature genes in miR-181cd transfected βTC3 cells, which indicates that the majority of upregulated MLP genes (colored coded as red in the y-axis) were upregulated after 7 days of miR-181cd expression; conversely, the genes downregulated in the MLP signature (colored coded as green in the y-axis) were congruently downregulated after 7 days of miR-181cd expression. Selected IT and MLP gene markers are identified on the right side (see Supplementary Table 2 for the list of genes in order). E. Gene Ontology (GO) categories that were significantly enriched (FDR q-value on the y-axis) for upregulated genes after 7 days of miR-181cd cluster overexpression in βTC3 cells. F. Brightfield images of cancer cells: i. βTC3 IT-like cells; ii. βTC3 cells transfected with miR181cd cluster after 2 weeks of expression induced with DOX; iii. AJ-5257-1 MLP-like cells. Lower right panel: Magnified image illustrating miR-181cd-induced neuronal-like structures (in dashed lines) in ßTC3 cells.
Figure 3
Figure 3. The axis miR-181cd/Meis2/Hmgb3 regulates the IT to MLP transition
A. The Meis2 and Hmgb3 transcription factors (TFs) were identified as potential TF regulators using VIPER. Red and blue vertical lines indicate genes induced and repressed, respectively, by each TF. B. mRNA expression levels of Meis2 upon DOX-induced overexpression of miR-181cd in ßTC3. C. Luciferase reporter assay shows the direct targeting of Meis2 mRNA by miR-181cd. D. Hmgb3 mRNA expression in ßTC3 cells upon DOX-induced overexpression of miR-181cd. E. Protein expression level of Hmgb3 in the AJ-5257-1 cell line as well as in ßTC3 upon DOX-induced miR-181cd overexpression. F. Hmgb3 protein expression levels in ßTC3cells upon DOX-induced Hmgb3 overexpression. G. MLP mRNA-signature scores in βTC3 cancer cells collected 7 days after the induction of Hmgb3 expression, which shows a transcriptional shift toward the MLP phenotype. H. Unsupervised hierarchical clustering of βTC3 cells before (control) and after miR-181cd or Hmgb3 induction for 7 days. I. Heatmap of selected differentially expressed genes in βTC3 cell lines before (control) and after 7 days of Hmgb3 overexpression, reflecting pathways related to neuroendocrine phenotype, neuronal programming, pluripotency, and morphogenesis (see Supplementary Table 2 for the complete list of genes).
Figure 4
Figure 4. Hmgb3 upregulation is an early event in the dedifferentiation of IT into MLP
A, B. Representative images of Insulin and Hmgb3 immunostaining, alongside DAPI, of early pancreatic tumors (A) and liver metastasis (B) in the RT2;AB/6J F1 mouse model of PanNETs. A. Representative images of early lesions showing: IT cells; identified as Inshigh/Hmgb3neg. (left panel), cells undergoing IT-to-MLP transition; identified as Inshigh/Hmgb3low and Inslow/Hmgb3high (middle panels), and fully dedifferentiated MLP cells; identified as Insneg./Hmgb3high (right panel) (see also Supplementary Fig. S4A-D). B. Metastatic cancer cells exhibit Insneg./Hmgb3high expression pattern (see also Supplementary Fig. S4E). C. t-distributed Stochastic Neighbor Embedding (t-SNE) analysis for all cancer cells based on scRNA- sequencing analysis, color coded according the seven distinct sub-clusters. D. Individual cancer cells (points) in two-dimensional t-SNE plots, color-coded according to the MLP signature score. E. mRNA expression levels of Ins2 (left), Meis2 (middle), and Hmgb3 (right) in scRNA-sequencing data from primary tumor samples. F. Schematic representation of dedifferentiation process during PanNETs tumor progression: The IT cancer cells (Inshigh/Hmgb3neg.) go through dedifferentiation and transition to MLP subtype (Insneg./Hmgb3high), enabling them to disseminate to the liver. This transition is induced by upregulation of miR-181cd, which directly inhibits Meis2 expression, and indirectly effects the upregulation of Hmgb3 expression.
Figure 5
Figure 5. Dedifferentiation and proliferation are two separate molecular pathways contributing to the heterogeneity of primary tumors
A. Principal component analysis (PCA) of all cancer cells based on scRNA- sequencing analysis, color coded according to the cell sub-clusters. B. Scatter-plot showing a high correlation of PC-1 from the PCA analysis and the MLP mRNA-signature score. C-D. Gene Ontology (GO) categories that are significantly enriched (FDR q-value on the y-axis) for upregulated genes in sub-cluster i (C; IT cancer cells), and in sub-clusters ii to vii (D; MLP cancer cells). E. Scatter-plot showing a high correlation of PC-2 from PCA analysis with the mRNA proliferation-signature score for both IT (sub-cluster i) and MLP clusters (sub-clusters ii - vii). F. Violin plot showing the mRNA proliferation-signature score for each cancer cell sub-cluster. G. Heatmap of top 20 differentially expressed genes for each cancer cell sub-cluster in the primary tumor. H. Images of Insulin, Hmgb3, and EdU immunostaining, along with DAPI, for early lesions from 7-8 week old RT2;AB/6J-F1 mice, illustrating representative IT, MLP and transitional histological stages. I. Quantification of EdU immunostaining to reveal proliferation of cancer cells in IT and MLP tumor lesions isolated from early, 7-8 week old, RT2;AB/6J-F1 mice. J. Cell cycle analysis of ßTC3 cells before (control) and after 7 days of miR-181cd DOX-induced expression.
Figure 6
Figure 6. The MLP cluster in human PanNETs correlates with dedifferentiation, tumor grade, metastasis, and clinical outcome
A. PCA analysis of samples from mouse pancreatic postnatal maturation and human PanNET primary tumors and liver metastasis. The PC2 is shown in the x-axis as a surrogate for dedifferentiation time-points. The samples from each cohort are separated in different rows. B, C. The MLP mRNA signature scores in low- and high-grade (B) and different stages (C) of human PanNETs. D. Association of overall survival of PanNET patients with a high MLP signature score (score > median, red line) versus low score (score < median, green line). E, F. MEIS2 (E) and HMGB3 (F) mRNA expression in different stages of human PanNETs. G-I. Association of HMGB3 protein expression in human PanNET tissue-microarrays (TMA) with clinicopathological features. J, K. Representative images of Insulin (identified by red cytoplasm) and HMGB3 (marked by brown nucleus) immunostaining of primary human PanNETs (J) and liver metastases (K). J. In the middle panels, red arrowheads denote the IT subtype; INShigh/HMGB3neg. cells; green arrows the IT-to-MLP transition; INSlow/HMGB3low cells, and black arrows the MLP subtype; INSneg./HMGB3high cells.

References

    1. Zhou C, Zhang J, Zheng Y, Zhu Z. Pancreatic neuroendocrine tumors: A comprehensive review. Int J Cancer. 2012;131:1013–22. - PubMed
    1. Rindi G, Klimstra DS, Abedi-Ardekani B, Asa SL, Bosman FT, Brambilla E, et al. A common classification framework for neuroendocrine neoplasms: an International Agency for Research on Cancer (IARC) and World Health Organization (WHO) expert consensus proposal. Mod Pathol. 2018;31:1770–86. - PMC - PubMed
    1. Tang LH, Untch BR, Reidy DL, O’Reilly E, Dhall D, Jih L, et al. Well-differentiated neuroendocrine tumors with a morphologically apparent high-grade component: A pathway distinct from poorly differentiated neuroendocrine carcinomas. Clin Cancer Res. 2016;22:1011–7. - PMC - PubMed
    1. Scarpa A, Chang DK, Nones K, Corbo V, Patch AM, Bailey P, et al. Whole-genome landscape of pancreatic neuroendocrine tumours. Nature. 2017;543:65–71. - PubMed
    1. Hanahan D. Heritable formation of pancreatic β-cell tumours in transgenic mice expressing recombinant insulin/simian virus 40 oncogenes. Nature. 1985;315:115–22. - PubMed

Publication types