. 2021 Jul 1;81(13):3580-3592.
doi: 10.1158/0008-5472.CAN-20-2773. Epub 2021 Apr 28.

EGFR Activates a TAZ-Driven Oncogenic Program in Glioblastoma

Affiliations

EGFR Activates a TAZ-Driven Oncogenic Program in Glioblastoma

Minling Gao et al. Cancer Res. .

Abstract

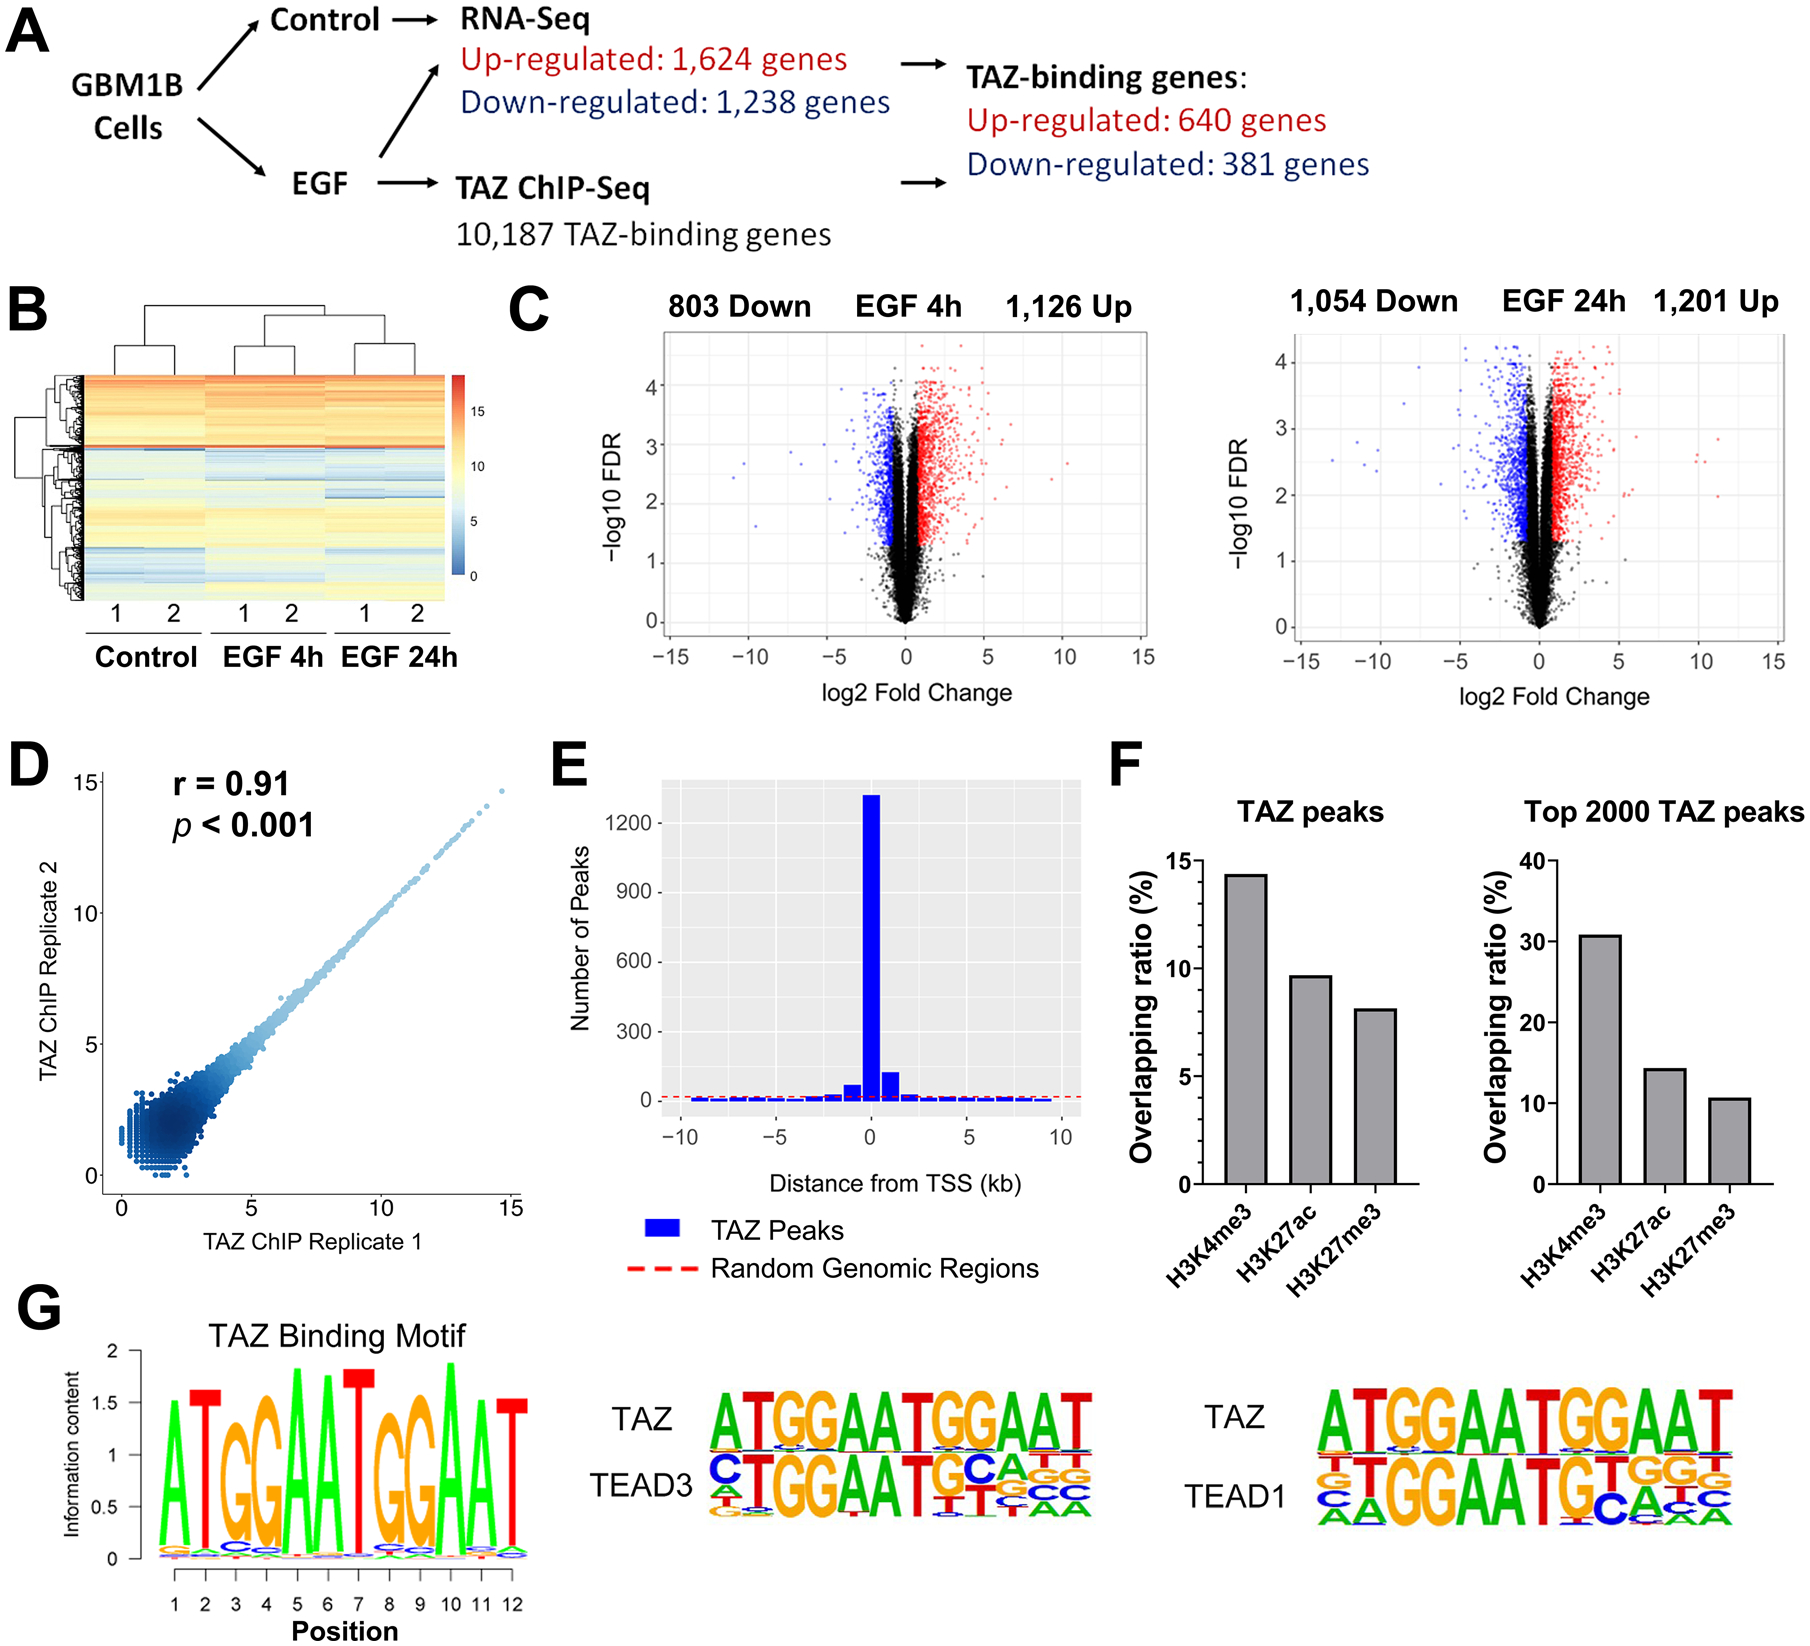
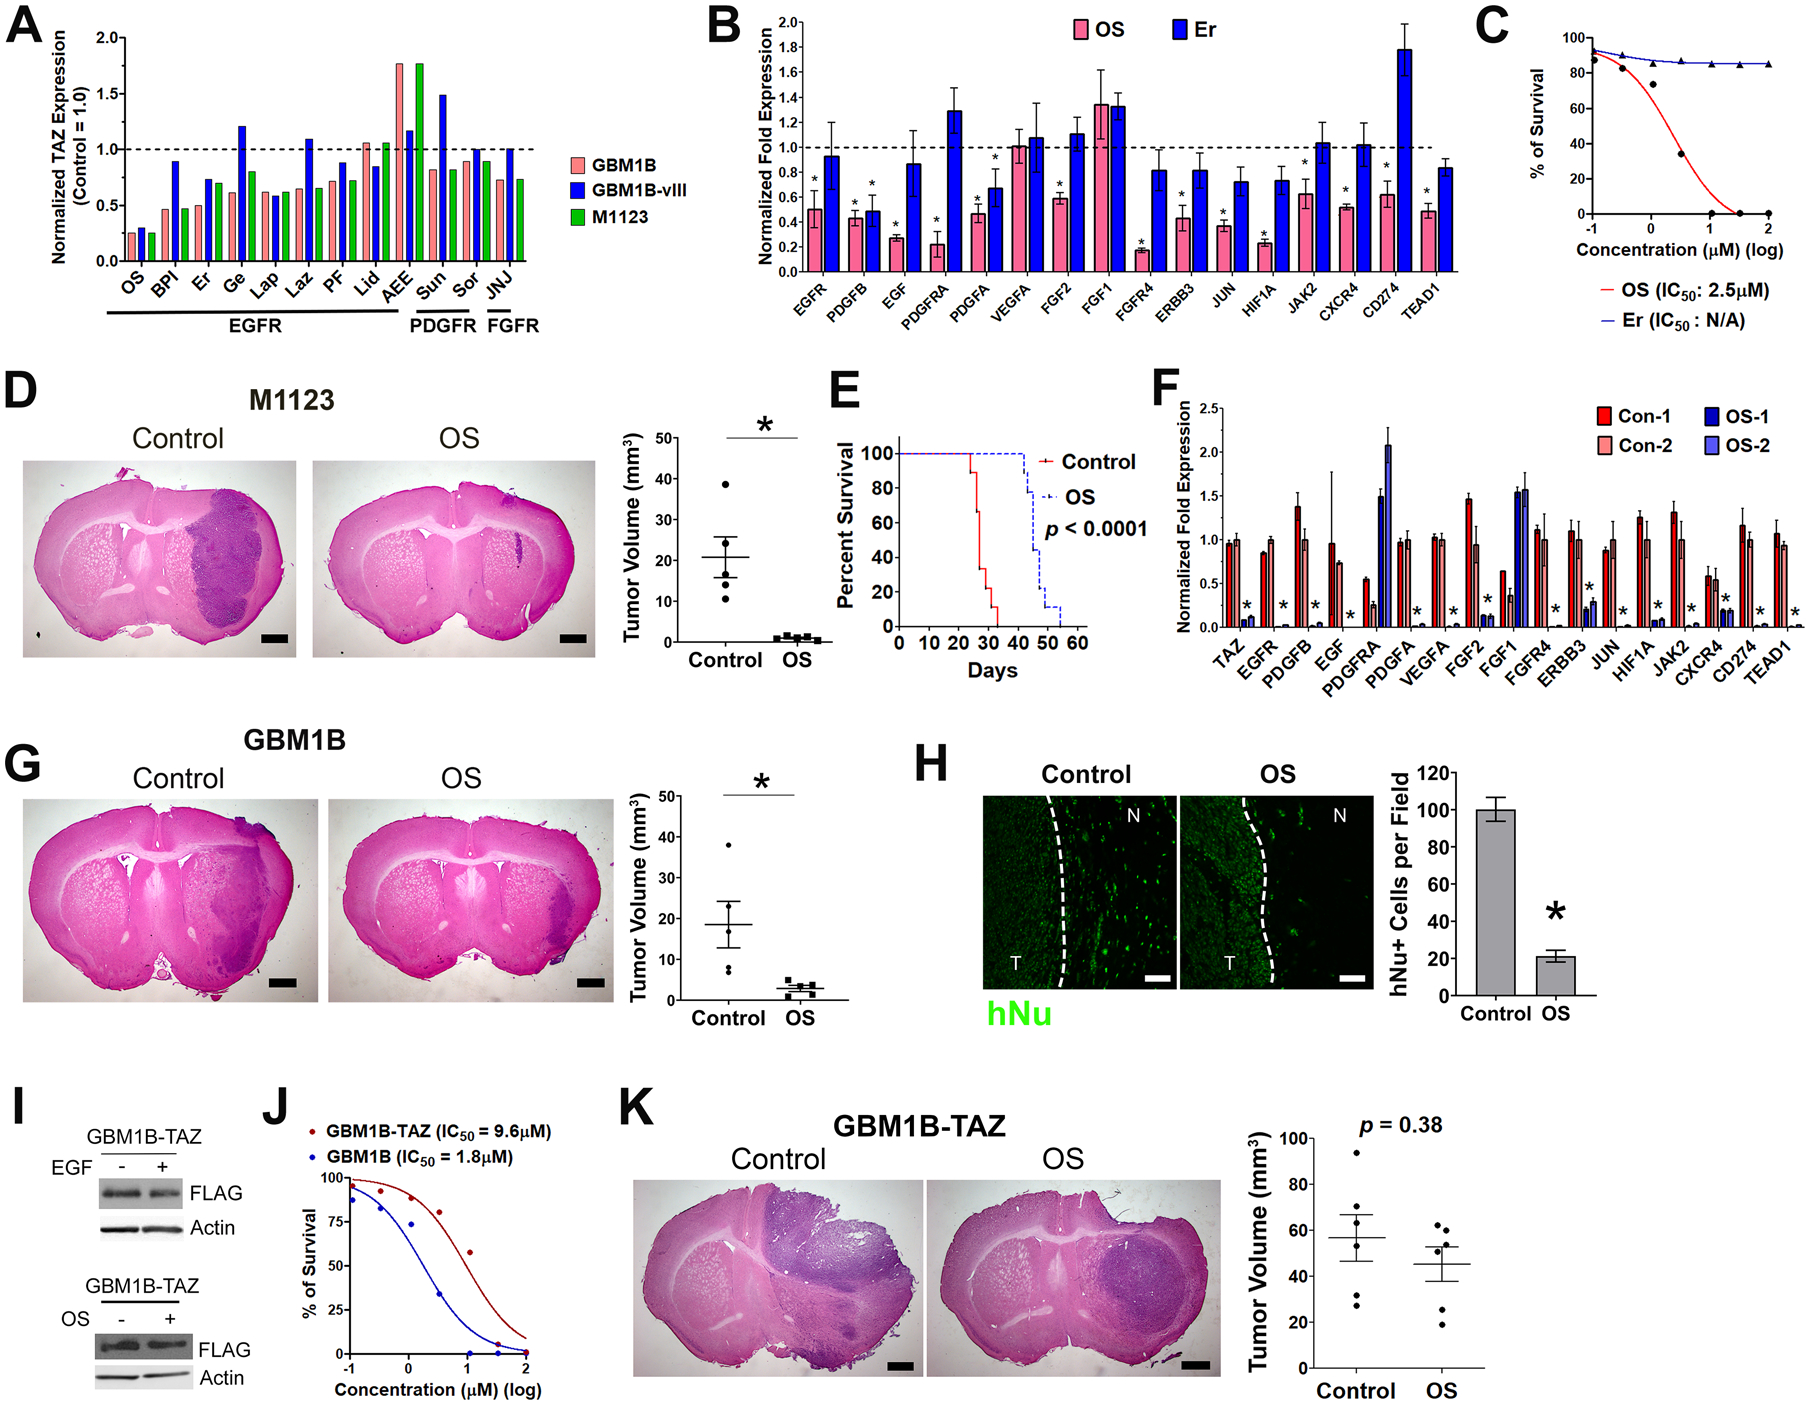
Hyperactivated EGFR signaling is a driver of various human cancers, including glioblastoma (GBM). Effective EGFR-targeted therapies rely on knowledge of key signaling hubs that transfer and amplify EGFR signaling. Here we focus on the transcription factor TAZ, a potential signaling hub in the EGFR signaling network. TAZ expression was positively associated with EGFR expression in clinical GBM specimens. In patient-derived GBM neurospheres, EGF induced TAZ through EGFR-ERK and EGFR-STAT3 signaling, and the constitutively active EGFRvIII mutation caused EGF-independent hyperactivation of TAZ. Genome-wide analysis showed that the EGFR-TAZ axis activates multiple oncogenic signaling mechanisms, including an EGFR-TAZ-RTK positive feedback loop, as well as upregulating HIF1α and other oncogenic genes. TAZ hyperactivation in GBM stem-like cells induced exogenous mitogen-independent growth and promoted GBM invasion, radioresistance, and tumorigenicity. Screening a panel of brain-penetrating EGFR inhibitors identified osimertinib as the most potent inhibitor of the EGFR-TAZ signaling axis. Systemic osimertinib treatment inhibited the EGFR-TAZ axis and in vivo growth of GBM stem-like cell xenografts. Overall these results show that the therapeutic efficacy of osimertinib relies on effective TAZ inhibition, thus identifying TAZ as a potential biomarker of osimertinib sensitivity. SIGNIFICANCE: This study establishes a genome-wide map of EGFR-TAZ signaling in glioblastoma and finds osimertinib effectively inhibits this signaling, justifying its future clinical evaluation to treat glioblastoma and other cancers with EGFR/TAZ hyperactivation. GRAPHICAL ABSTRACT: http://cancerres.aacrjournals.org/content/canres/81/13/3580/F1.large.jpg.


Conflict of interest statement

Conflict of interest statement

The authors declare no potential conflicts of interest.

Figures

Figure 1:
Figure 1:. EGF induces TAZ expression in GBM cells.
A: TAZ (WWTR1) mRNA levels positively correlate with EGF and FGF2 levels in GBM specimens from the TCGA database (n=454). B: GBM1B cells were depleted of growth factors for 16 hours and treated with RTK ligands as indicated for 1h or 5min for testing TAZ induction or phosphorylation of their receptors, respectively (Con: RTK ligand-untreated cells). C: GBM1B cells were deprived from growth factors for 16 hours and treated with EGF for 2 hours. TAZ mRNA was measured by qRT-PCR. D: After growth factor depletion for 16 hours, GBM cells as marked received EGF treatment for the indicated times (Con: untreated cells). TAZ protein was quantified by western blotting. E and F: After growth factor depletion for 16 hours, GBM1B cells were treated with EGF for the indicated times (Con: untreated cells). TAZ western blotting was performed using proteins from nuclear and cytosol fractions (E). Cells with +/− EGF treatment (4 hours) were subjected to TAZ immunostaining and quantification of TAZ signal intensity in DAPI+ nuclei (F; DAPI: nuclear counterstaining; Bar = 10 μM; n=50) G and H: The same cells as used in E were subjected to TAZ ChIP-PCR with IgG as the control (G, NC: negative control regions randomly selected from the genome). CTGF and MYC transcription was also quantified (H). Protein fold expression normalized to β-Actin, total levels of receptors or TBP (E) is shown below each lane. Data are represented as mean ± SEM (*: p < 0.01).
Figure 2:
Figure 2:. EGF induces TAZ expression through EGFR and its downstream signaling molecules.
A and B: GBM1B cells were treated with +/− Erlotinib or Gefitinib (10 μM, 16 hours) in growth factor-depleted medium followed by EGF treatment for the indicated times. TAZ western blotting was performed using total protein lysates (A) or proteins from the nuclear and cytosol fractions (B). C - E: GBM1B cells were treated with or without the inhibitors as marked for 16 hours in growth factor-depleted medium followed by 4-hour EGF stimulation (5,15-DPP: 100 μM; PD98059: 20 μM; Akti-1/2: 20 μM). Total protein lysates were subjected to western blotting for TAZ and other proteins. F: ChIP-PCR using STAT3 antibody and control IgG showed the interaction between STAT3 and a putative STAT3-binding site on the TAZ promoter (−500bp to the TSS). Protein fold expression normalized to β-Actin is shown below each lane. Data are represented as mean ± SEM (*: p < 0.01).
Figure 3:
Figure 3:. The EGFRvIII mutation causes EGF-independent TAZ hyperactivation in GBM cells.
A: EGFR western blotting using total protein lysates from GBM cells. 293FT cells with lentiviral EGFRvIII expression were used as the positive control. B and C: GBM1B and U87MG cells with +/− EGFRvIII expression were subjected to TAZ western blotting (B). GBM1B cells with +/− EGFRvIII expression were subjected to qRT-PCR for two TAZ gene targets (C). D: GBM cells as marked were depleted of growth factors for 16 hours and treated with EGF for the indicated times (Con: EGF-untreated cells). Total protein lysates were subjected to western blotting of TAZ and EGFR-activated kinases. Protein fold expression normalized to β-Actin, total ERK1/2 or STAT3 is shown below each lane. Data are represented as mean ± SEM (*: p<0.01).
Figure 4:
Figure 4:. Genome-wide profiling of EGFR-regulated TAZ gene targets in GBM neurospheres.
A: Outline of the genome-wide analysis. B: Heatmap clustering of 6 RNA-Seq samples from 3 conditions. Gene expression was calculated by RPKM. C: Volcano plot showing DE genes (red and blue dots: genes with FDR ≤ 0.05 and log2(fold change) ≥ 0.8 or ≤ −0.8, respectively). D: ChIP-Seq reproducibility was analyzed by scatter plot comparing peak intensities for two ChIP-Seq replicates. E: TAZ binding peaks show enrichment around TSSs, compared to randomly selected genomic regions. F: Overlapping between TAZ peaks and histone marks as marked. G: TAZ binding motif was identified by de novo motif discovery and compared to TEAD3 and TEAD1 motifs.
Figure 5:
Figure 5:. TAZ acts downstream of EGFR to activate key oncogenic molecules.
A: Top 20 KEGG pathway terms enriched in TAZ-Up genes. Pathways are ranked based on -log(p value) as calculated by the Fisher’s exact test. B: TAZ-Up genes were ranked in the clustergram graph by their enrichment in the top 20 KEGG pathways. The top-ranked 20 genes are shown. C - E: GBM1B cells were deprived from growth factors for 16 hours and treated with +/− EGF for 4 hours (qRT-PCR and ELISA) and 24 hours (western blotting and ELISA). The expression of TAZ-Up genes was quantified by qRT-PCR (C), western blotting (D) and PDGFβ ELISA (E). Control: EGF-untreated cells. F: Representative tracks from ChIP-Seq results show TAZ binding peaks validated by ChIP-PCR. The orientation of each transcript is marked by the arrow. Arrowheads mark peaks for validation (T: TSS). G: GBM1B cells after 16-hour growth factor depletion were treated with EGF for 4 hours and were subjected to ChIP using TAZ antibody and control IgG. qPCR was used to measure TAZ binding to putative TAZ binding sites (NC1 and NC2: negative control genomic regions without TAZ binding). H: GBM1B cells were infected by lentiviral TAZ shRNAs (shTAZ1 and shTAZ2) or control shRNA (Con) for 72 hours in EGF-containing medium. The expression of TAZ and TAZ-Up genes was measured by western blotting or ELISA (PDGFβ). I and J. GBM1B cells were infected by lentiviral TAZ shRNAs (shTAZ1 and shTAZ2) or control shRNA for 24 hours. Equal numbers of viable cells (105) after infection were cultured for 6 days to form neurospheres. Representative microscopic fields of control and shTAZ1 samples are shown (I, left; Bar = 100 μm). Neurospheres (>100 μm diameter) were counted (I, right, n=6, N.D.: not detected). Equal numbers (10,000) of viable cells after infection were transplanted into mouse brains (n=4). Coronal brain sections (20 μm, with H&E staining) were shown (day 80 post implantation, Bar = 0.5 mm) with tumor size quantification (J). Data are represented as mean ± SEM (*: p < 0.01 compared to control).
Figure 6:
Figure 6:. Enforced TAZ expression promotes GBM-associated malignant phenotypes.
A: GBM1B and A172 cells were infected with lentiviruses harboring TAZ (FLAG-tagged) cDNA or no cDNA insert as the control to established stable cell lines. Transgene expression was measured by western blotting. B and C: Validated TAZ-Up genes were analyzed by qRT-PCR (B) in GBM1B and GBM1B-TAZ cells, and by western blotting (C) using whole cell lysates from GBM1B and A172 cells with +/− enforced TAZ expression. D: Cell growth curves were drawn from the number of trypan blue stained GBM1B and A172 cells with +/− enforced TAZ expression. E: Colony formation was quantified in GBM1B and GBM1B-TAZ cells in medium with +/− EGF for 10 days. F: GBM1B with +/− enforced TAZ expression were grown in medium without growth factors for 48 hours, and EGF release in medium was measured by ELISA. G: GBM1B cells were grown in soft agar with EGF-containing medium or EGF-free conditioned medium (24h) from GBM1B and GBM1B-TAZ cells. Colony formation after 10 days was quantified. H: GBM1B and GBM1B-TAZ cells were plated onto laminin-coated Transwell membranes. Cell migration was compared after 24 h by quantifying DAPI+ cells per field. I: A172 and A172-TAZ cells were subjected to scratch wound healing assay to quantify migrating cells in the scratch area as shown in Figure S7. J: GBM1B and GBM1B-TAZ cells received +/− irradiation (1 or 3 daily doses of 3 Gy). Clonogenic survival was quantified and normalized to untreated control cells. K: 10,000 viable A172 and A172-TAZ cells were transplanted into mouse brains (n=5). Coronal brain sections (20 μm, with H&E staining) were shown (post-implantation day 76, Bar = 0.5 mm (left) and 50 μm (right); arrowhead: necrotic area). L and M: 10,000 viable GBM1B and GBM1B-TAZ cells were transplanted into mouse brains (n=5). Coronal brain sections (20 μm, with H&E staining) were shown (day 60 post implantation, Bar = 0.5 mm) with tumor size quantification (L). hNu immunostaining (M) was used to detect and quantify tumor cells invading the contralateral corpus callosum area (marked by black rectangles in L). hNu+ cell numbers were quantified in 5 fields with equal sizes as marked underneath the picture (Bar = 100 mm). Data are represented as mean ± SEM (*: p < 0.01).
Figure 7:
Figure 7:. Pharmacological TAZ inhibition by the EGFR inhibitor osimertinib (OS).
A: Three GBM cell lines were pre-treated with 12 RTK inhibitors as marked for 16 hours in growth factor-depleted medium. After 4-hour EGF stimulation, total protein lysates were subjected to TAZ western blotting. Protein fold expressions normalized to β-Actin were quantified and normalized to control cells without compound treatment (dash line: TAZ level in compound-untreated cells). B: GBM1B cells with +/− OS (0.5 μM) and Er (10 μM) treatment as prepared in A were subjected to qRT-PCR for TAZ-Up genes (compound-untreated control = 1.0 (dash line); *: p < 0.01 compared to the untreated control). C: Alamar blue cell proliferation assay in GBM1B cells with OS and Er treatment. D-F: Coronal brain sections (20 μm, with H&E staining) were used for tumor size quantification of M1123 xenografts with +/− OS treatment (D, n=5, post-implantation day 15, Bar = 0.5 mm). This OS treatment also extended the survival of mice bearing M1123 xenografts (n = 9, p < 0.0001, log-rank test). Tumor specimens (n=2 for each group) were microdissected from regions close to injection needle tracts to measure TAZ and TAZ-Up gene expression by qRT-PCR (F, n=2). G and H: Coronal brain sections (20 μm, with H&E staining) were prepared for tumor size quantification of GBM1B xenografts with +/− OS treatment (F, n=5, post-implantation day 82, Bar = 0.5 mm). hNu immunostaining detected tumor cells in the invading tumor edge (dash line) for quantification (G, Bar = 50 μm) I: GBM1B-TAZ cells were depleted of growth factors for 16 hours and treated with +/− EGF for 4 hours (Top panel). GBM1B-TAZ cells have +/− OS treatment for 16 hours in growth factor-depleted medium followed by 4-hour EGF stimulation (Bottom panel). Total protein lysates were subjected to TAZ western blotting. J: Alamar blue cell proliferation assay in GBM1B and GBM1B-TAZ cells with OS treatment. K: The size of GBM1B-TAZ xenografts with +/− OS treatment was quantified using coronal brain sections (20 μm, with H&E staining, n=6, post-implantation day 50, Bar = 0.5 mm, p = 0.38). Data are represented as mean ± SEM (*: p < 0.01).

Similar articles

Cited by

References

    1. Wen PY, Kesari S. Malignant gliomas in adults. N Engl J Med. 2008;359:492–507. - PubMed
    1. Brennan CW, Verhaak RG, McKenna A, Campos B, Noushmehr H, Salama SR, et al. The somatic genomic landscape of glioblastoma. Cell. 2013;155:462–77. - PMC - PubMed
    1. An Z, Aksoy O, Zheng T, Fan QW, Weiss WA. Epidermal growth factor receptor and EGFRvIII in glioblastoma: signaling pathways and targeted therapies. Oncogene. 2018;37:1561–75. - PMC - PubMed
    1. Piccolo S, Dupont S, Cordenonsi M. The biology of YAP/TAZ: hippo signaling and beyond. Physiological reviews. 2014;94:1287–312. - PubMed
    1. Castellan M, Guarnieri A, Fujimura A, Zanconato F, Battilana G, Panciera T, et al. Single-cell analyses reveal YAP/TAZ as regulators of stemness and cell plasticity in Glioblastoma. Nature cancer. 2021;2:174–88. - PMC - PubMed

Publication types

MeSH terms