Observational Study
. 2021 May 25;96(21):e2627-e2638.
doi: 10.1212/WNL.0000000000011849. Epub 2021 Apr 28.

Sudden Unexpected Death in Epilepsy: A Personalized Prediction Tool

Affiliations
Observational Study

Sudden Unexpected Death in Epilepsy: A Personalized Prediction Tool

Ashwani Jha et al. Neurology. .

Abstract

Objective: To develop and validate a tool for individualized prediction of sudden unexpected death in epilepsy (SUDEP) risk, we reanalyzed data from 1 cohort and 3 case-control studies undertaken from 1980 through 2005.

Methods: We entered 1,273 epilepsy cases (287 SUDEP, 986 controls) and 22 clinical predictor variables into a Bayesian logistic regression model.

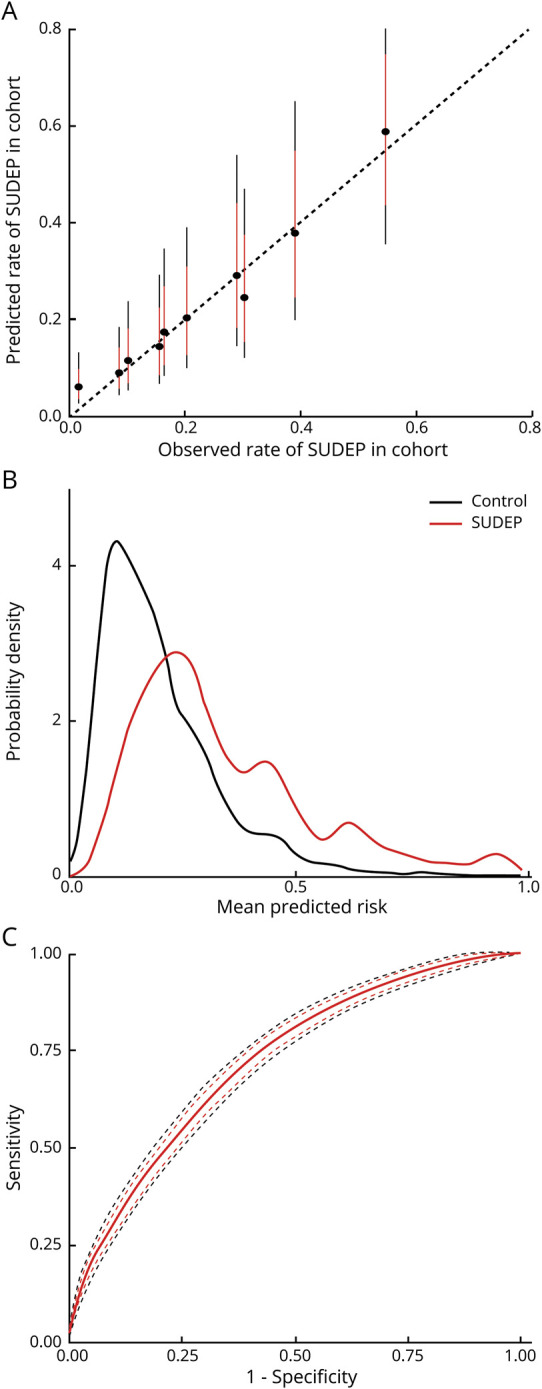
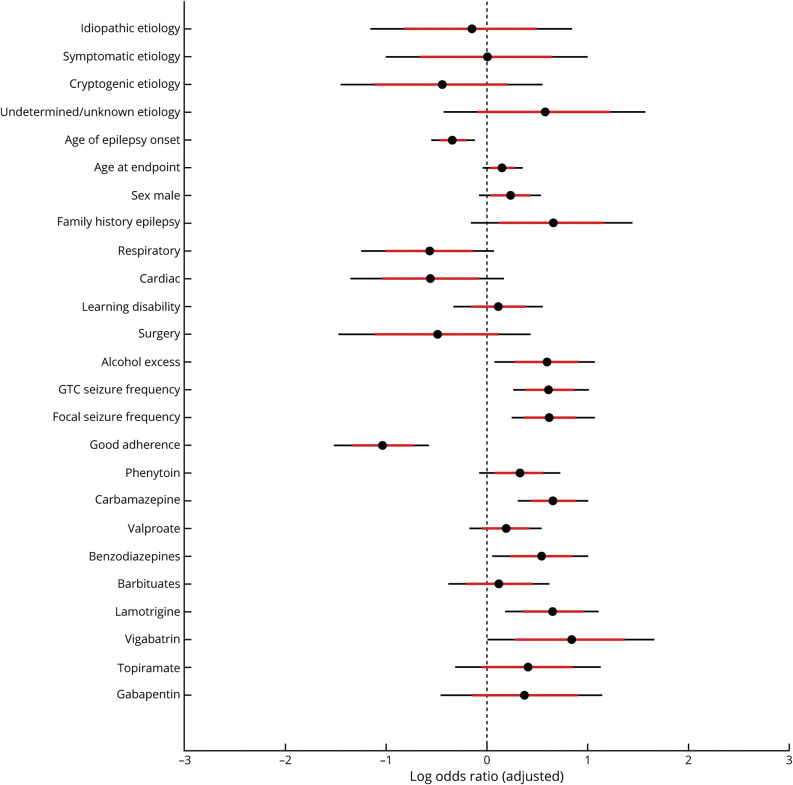
Results: Cross-validated individualized model predictions were superior to baseline models developed from only average population risk or from generalized tonic-clonic seizure frequency (pairwise difference in leave-one-subject-out expected log posterior density = 35.9, SEM ± 12.5, and 22.9, SEM ± 11.0, respectively). The mean cross-validated (95% bootstrap confidence interval) area under the receiver operating curve was 0.71 (0.68-0.74) for our model vs 0.38 (0.33-0.42) and 0.63 (0.59-0.67) for the baseline average and generalized tonic-clonic seizure frequency models, respectively. Model performance was weaker when applied to nonrepresented populations. Prognostic factors included generalized tonic-clonic and focal-onset seizure frequency, alcohol excess, younger age at epilepsy onset, and family history of epilepsy. Antiseizure medication adherence was associated with lower risk.

Conclusions: Even when generalized to unseen data, model predictions are more accurate than population-based estimates of SUDEP. Our tool can enable risk-based stratification for biomarker discovery and interventional trials. With further validation in unrepresented populations, it may be suitable for routine individualized clinical decision-making. Clinicians should consider assessment of multiple risk factors, and not focus only on the frequency of convulsions.


Figures

Figure 1
Figure 1. Internal Evaluation of Sudden Unexpected Death In Epilepsy (SUDEP) Model Performance
(A) Calibration plot, where the observed cases are sorted into deciles based on the predicted risk from the model. For each subsequent decile, the observed rate of SUDEP in the dataset is plotted against the model prediction (black circle = average, red line 80% credibility interval, black line 95% credibility interval). The model shows excellent calibration—perfect calibration would be aligned along the dotted line where both values are equal. (B) Predicted risk probability distribution functions for SUDEP cases (red) and controls (black). Perfect discrimination would be illustrated by complete separation of the 2 distributions along the x axis; chance discrimination would be illustrated by complete alignment. Discrimination is reasonable but there is still a degree of overlap, suggesting a remaining degree of uncertainty at risk estimates around 0.2–0.4. This is consistent with the receiver operating characteristic curve (C), which shows the specificity and sensitivity of predicting SUDEP in this dataset based on model output (red line = mean, red dash = 80% credibility interval, black dash = 95% credibility interval). The internal area under the receiver operating characteristic curve is 0.72 (95% credibility interval 0.71–0.74), which is reasonable.
Figure 2
Figure 2. Adjusted Log Odds Ratios From Bayesian Logistic Regression Model
Values less than 0 are associated with a reduced risk of sudden unexpected death in epilepsy (SUDEP) and values greater than 0 are associated with an increased risk of SUDEP, relative to the average population sample (black circle = average, red line 80% credibility interval, black line 95% credibility interval). See main text for interpretation, noting that the associations shown are not causal. GTC = generalized tonic-clonic.
Figure 3
Figure 3. Marginal Adjusted Risk
(A) The marginal (average) predicted noncausal effect of generalized tonic-clonic seizures (GTCS) frequency (top left), focal seizure frequency (top right), age at epilepsy onset (bottom left), and current age (bottom right) on the odds of sudden unexpected death in epilepsy (SUDEP) on their natural scales is shown. These values are relative to a seizure frequency of 0 and to the sample average age at epilepsy onset and current age (red line = mean, red patch 80% credibility interval, gray patch 95% credibility interval). Note that the y axis is a log scale. (B) The combined noncausal association of age at epilepsy onset and current age on SUDEP risk is shown as a grid of values represented by a color scale. Warmer colors represent increased risk and imply that those with a younger age at epilepsy onset have the highest risk and that this risk increases as current age increases.
Figure 4
Figure 4. Individualized Model Predictions of Sudden Unexpected Death In Epilepsy (SUDEP)
To demonstrate the potential research and clinical utility of this tool, the individualized risk predictions of 10 individuals with epilepsy are shown. These individuals are not known to the model, were drawn from recent practice, and were selected as their SUDEP risk was of clinical interest. The risk is presented on the y axis as a summary measure of a probability distribution (black circle = mean, red line 80% credibility interval, black line 95% credibility interval) for individuals A–J specified on the x axis and ordered by mean predicted risk. Note the y axis is a log scale with risk quantified as a ratio for ease of interpretation. The dotted horizontal line represents the average population risk of 1–2/1,000 patient-years. The predictions are probabilistic, intuitive, and help focus discussions in a time-limited setting such as a clinical consultation. Important prognostic factors vary between the individuals and so multiple factors need to be considered together. For example, in those 5 with the highest risk, focal seizure frequency is particularly important in F, H, and J, generalized tonic-clonic seizures (GTCS) frequency in G, and poor adherence in I. Two of the individuals with highest risk (marked with a red circle next to their names) have died of SUDEP. ASM = antiseizure medications. *The influence of levetiracetam was not modeled.

References

    1. Devinsky O, Hesdorffer DC, Thurman DJ, Lhatoo S, Richerson G. Sudden unexpected death in epilepsy: epidemiology, mechanisms, and prevention. Lancet Neurol 2016;15:1075–1088. - PubMed
    1. Nashef L. Sudden unexpected death in epilepsy: terminology and definitions. Epilepsia 1997;38:S6–S8. - PubMed
    1. Harden C, Tomson T, Gloss D, et al. . Practice guideline summary: sudden unexpected death in epilepsy incidence rates and risk factors. Neurology 2017;88:1674–1680. - PubMed
    1. Chen S, Joodi G, Devinsky O, Sadaf MI, Pursell IW, Simpson RJ. Under-reporting of sudden unexpected death in epilepsy. Epileptic Disord 2018;20:270–278. - PubMed
    1. Devinsky O, Friedman D, Cheng JY, Moffatt E, Kim A, Tseng ZH. Underestimation of sudden deaths among patients with seizures and epilepsy. Neurology 2017;89:886–892. - PMC - PubMed

Publication types