. 2021 Jun 1;206(11):2566-2582.
doi: 10.4049/jimmunol.2001438. Epub 2021 Apr 28.

Genome-Wide B Cell, CD4+, and CD8+ T Cell Epitopes That Are Highly Conserved between Human and Animal Coronaviruses, Identified from SARS-CoV-2 as Targets for Preemptive Pan-Coronavirus Vaccines

Affiliations

Genome-Wide B Cell, CD4+, and CD8+ T Cell Epitopes That Are Highly Conserved between Human and Animal Coronaviruses, Identified from SARS-CoV-2 as Targets for Preemptive Pan-Coronavirus Vaccines

Swayam Prakash et al. J Immunol. .

Abstract

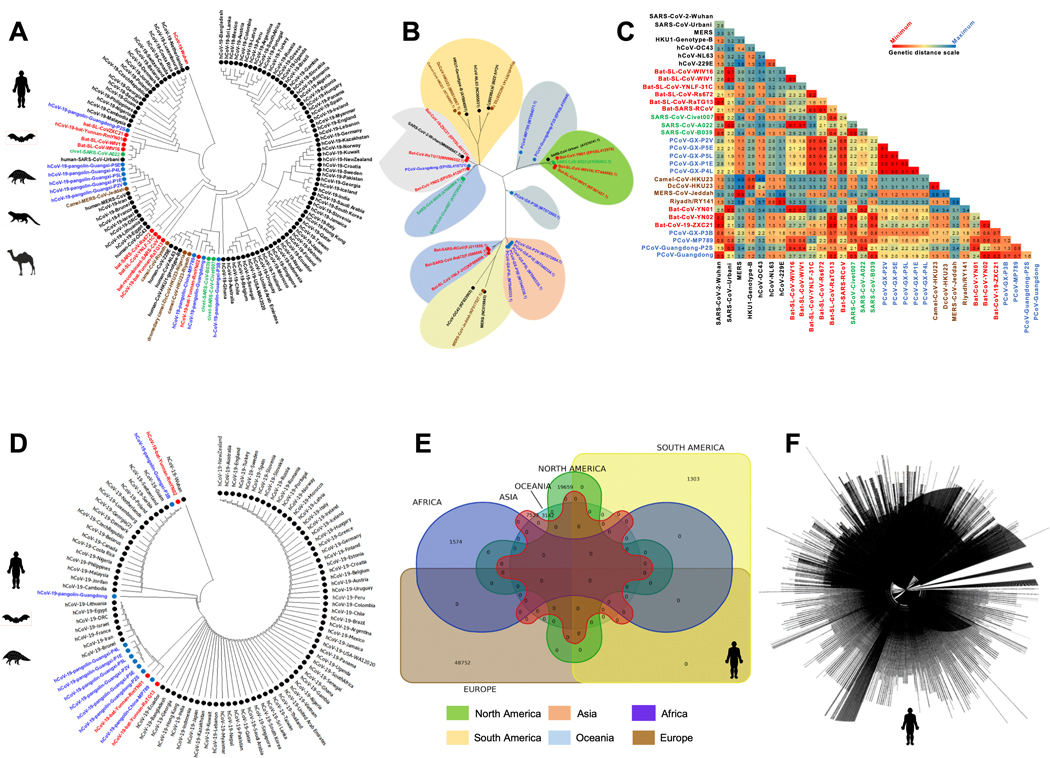
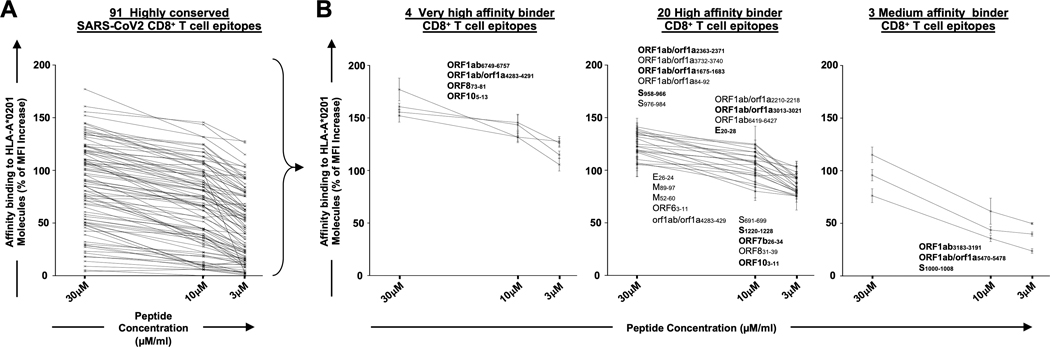
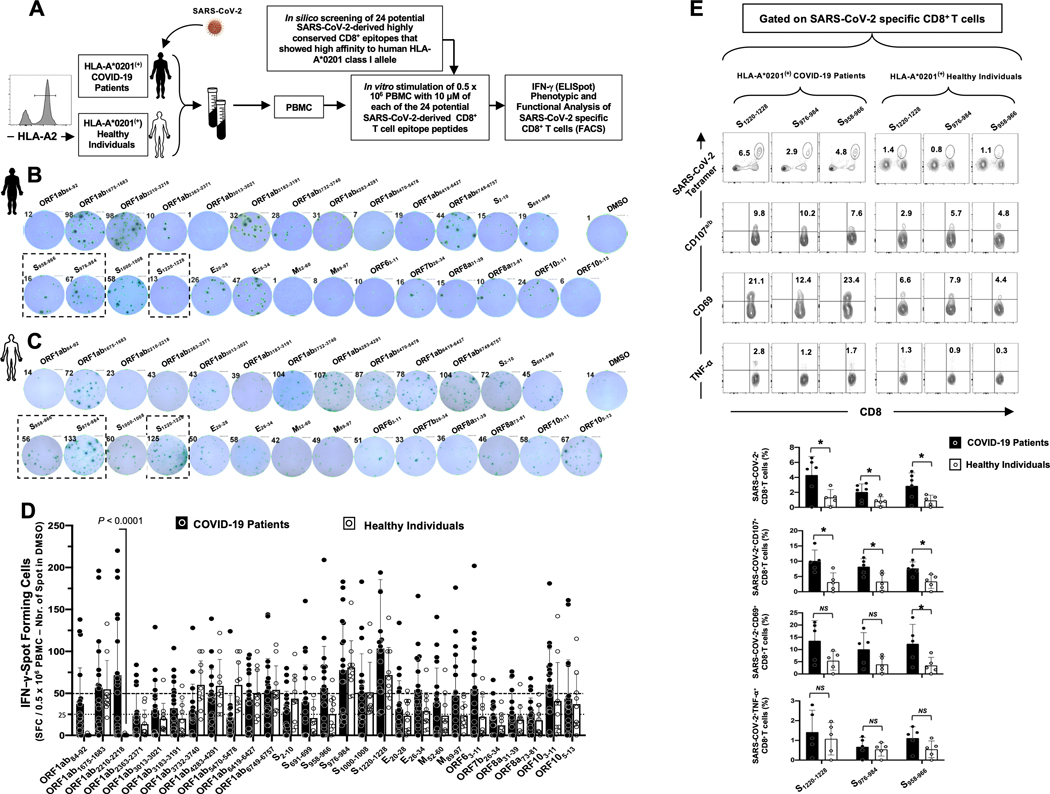
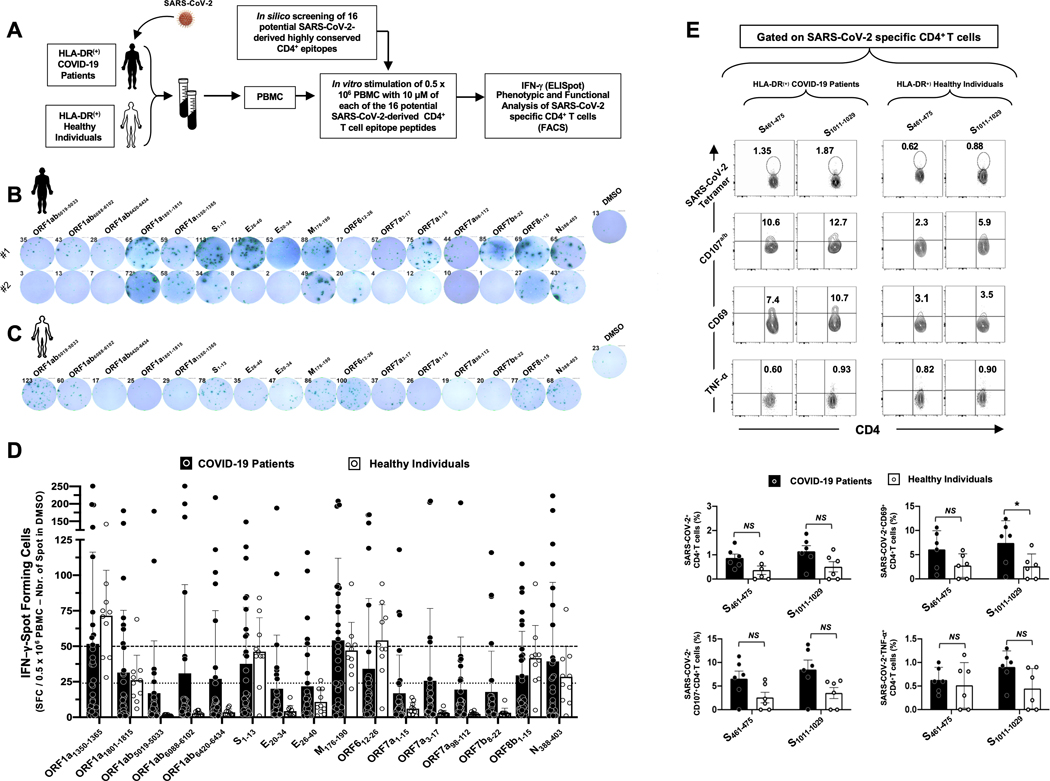
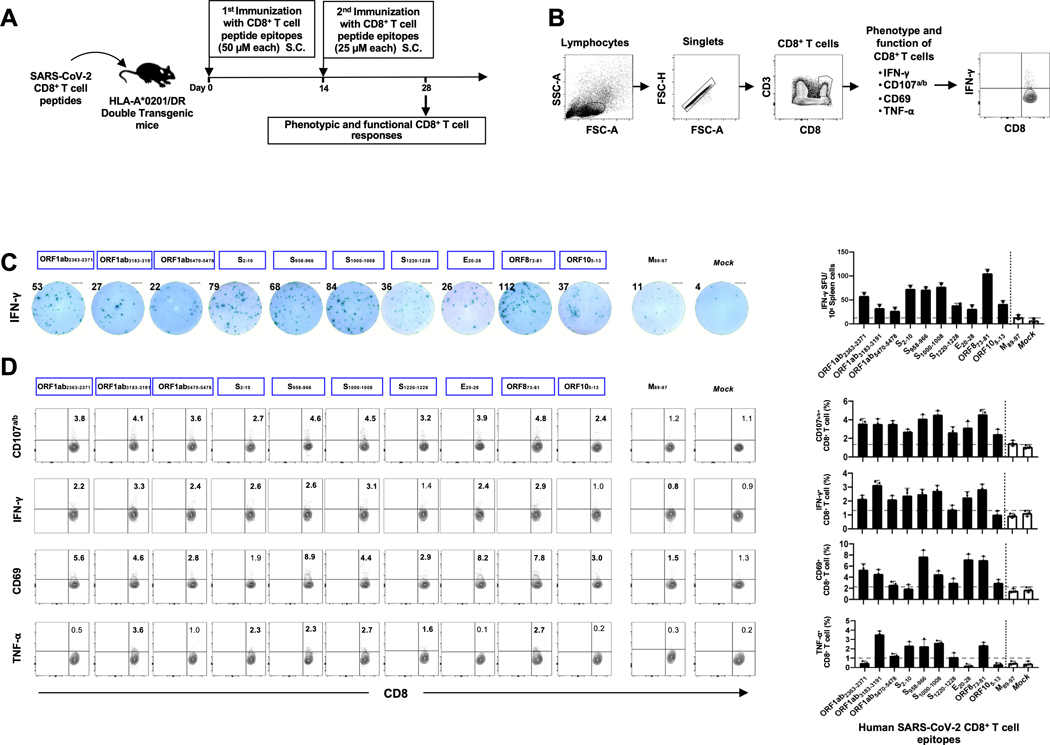
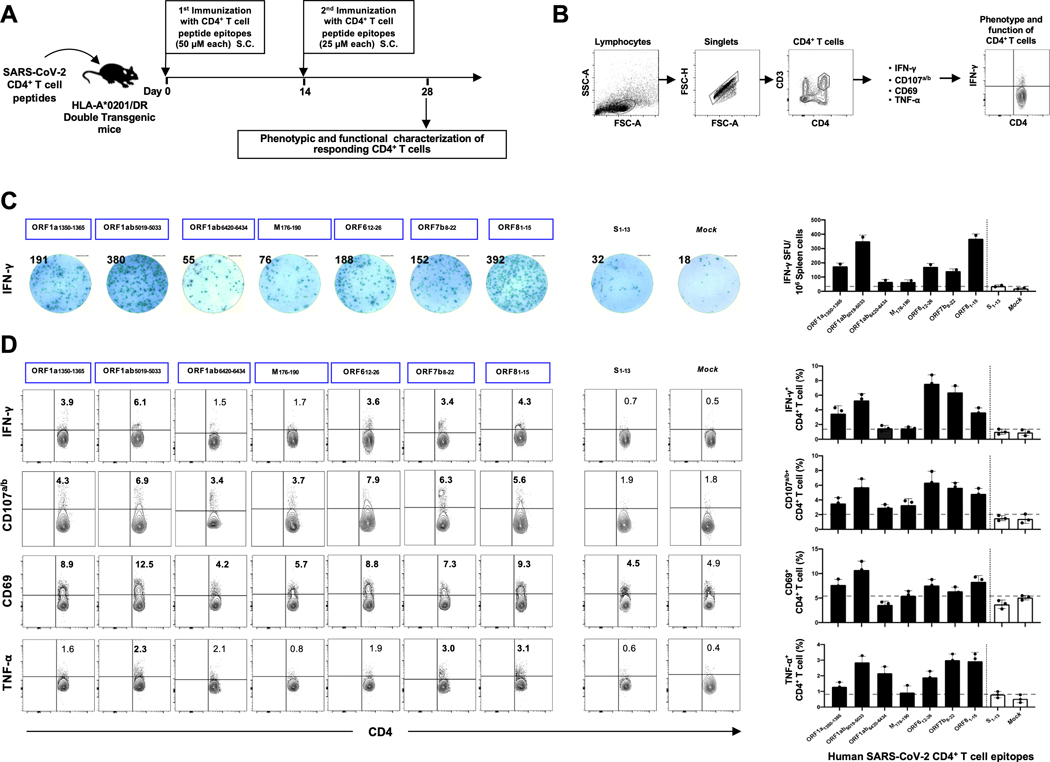
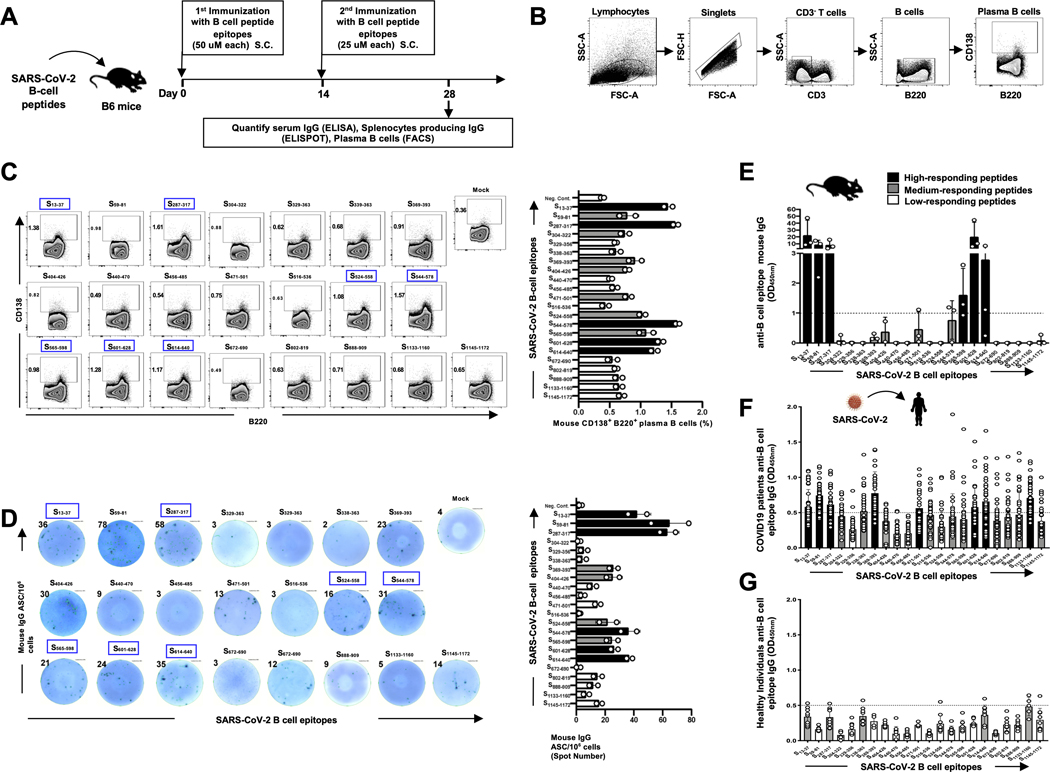
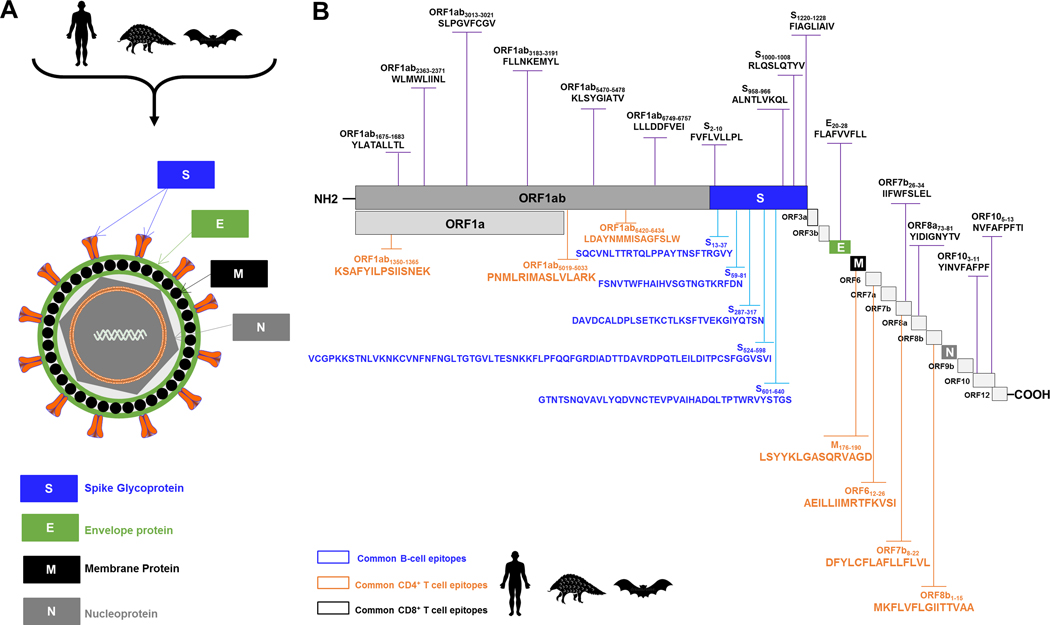
Over the last two decades, there have been three deadly human outbreaks of coronaviruses (CoVs) caused by SARS-CoV, MERS-CoV, and SARS-CoV-2, which has caused the current COVID-19 global pandemic. All three deadly CoVs originated from bats and transmitted to humans via various intermediate animal reservoirs. It remains highly possible that other global COVID pandemics will emerge in the coming years caused by yet another spillover of a bat-derived SARS-like coronavirus (SL-CoV) into humans. Determining the Ag and the human B cells, CD4+ and CD8+ T cell epitope landscapes that are conserved among human and animal coronaviruses should inform in the development of future pan-coronavirus vaccines. In the current study, using several immunoinformatics and sequence alignment approaches, we identified several human B cell and CD4+ and CD8+ T cell epitopes that are highly conserved in 1) greater than 81,000 SARS-CoV-2 genome sequences identified in 190 countries on six continents; 2) six circulating CoVs that caused previous human outbreaks of the common cold; 3) nine SL-CoVs isolated from bats; 4) nine SL-CoV isolated from pangolins; 5) three SL-CoVs isolated from civet cats; and 6) four MERS strains isolated from camels. Furthermore, the identified epitopes: 1) recalled B cells and CD4+ and CD8+ T cells from both COVID-19 patients and healthy individuals who were never exposed to SARS-CoV-2, and 2) induced strong B cell and T cell responses in humanized HLA-DR1/HLA-A*02:01 double-transgenic mice. The findings pave the way to develop a preemptive multiepitope pan-coronavirus vaccine to protect against past, current, and future outbreaks.


Figures

Figure 1.
Figure 1.. Evolutionary comparison of genome sequences among beta-Coronavirus strains isolated from humans and animals:
(A) Left panel: Phylogenetic analysis performed between SARS-CoV-2 strains (obtained from humans (Homo Sapiens (black)), along with the animal’s SARS-like Coronaviruses genome sequence (SL-CoVs) sequences obtained from bats (Rhinolophus affinis, Rhinolophus malayanus (red)), pangolins (Manis javanica (blue)), civet cats (Paguma larvata (green)), and camels (Camelus dromedaries (Brown)). The included SARS-CoV/MERS-CoV strains are from previous outbreaks (obtained from humans (Urbani, MERS-CoV, OC43, NL63, 229E, HKU1-genotype-B), bats (WIV16, WIV1, YNLF-31C, Rs672, recombinant strains), camel (Camelus dromedaries, (KT368891.1, MN514967.1, KF917527.1, NC_028752.1), and civet (Civet007, A022, B039)). The human SARS-CoV-2 genome sequences are represented from six continents. (B) Phylogenetic analysis performed among SARS-CoV-2 strains from human and other species with previous strains of SARS/MERS-CoV showed minimum genetic distance between the first SARS-CoV-2 isolate Wuhan-Hu-1 reported from the Wuhan Seafood market with bat strains hCoV-19-bat-Yunnan-RmYN02, bat-CoV-19-ZXC21, and hCoV-19-bat-Yunnan-RaTG13. This makes the bat strains nearest precursor to the human-SARS-CoV-2 strain. (C) Genetic distances based on Maximum Composite Likelihood model among the human, bat, pangolin, civet cat and camel genome sequences. Results indicate least genetic distance among SARS-CoV-2 isolate Wuhan-Hu-1 and bat strains bat-CoV-19-ZXC21 (0.1), hCoV-19-bat-Yunnan-RaTG13 (0.1), and hCoV-19-bat-Yunnan-RmYN02 (0.2). (D) Evolutionary analysis performed among the human-SARS-CoV-2 genome sequences reported from six continents and SARS-CoV-2 genome sequences obtained from bats (Rhinolophus affinis, Rhinolophus malayanus), and pangolins (Manis javanica)) (E) Venn diagram showing the number of SARS-CoV-2 genome sequences reported from Africa (n = 1574), Asia (n = 7533), North America (n = 19659), South America (n = 1303), Europe (n = 48752), and Oceania region (n = 3142) as on August 18, 2020. (F) Complete genome tree derived from 81,963 outbreak SARS-CoV-2 genome sequences submitted from Asian, African, North American, South American, European, and Oceanian regions.
Figure 2:
Figure 2:. Identification of highly conserved potential SARS-CoV-2-derived human CD8+ T cell epitopes that bind with high affinity to HLA-A*02:01 molecules:
(A) Ninety-one, genome-wide In-silico predicted, and highly conserved SARS-CoV-2-derived CD8+ T cell epitope peptides were synthetized and were tested for their binding affinity in vitro to HLA-A*02:01 molecules expressed on the surface of T2 cells. (B) Out of the 91 CD8+ T cell epitopes, 4 epitopes were selected as high binders s to HLA-A*02:01 molecules, even at the lowest molarity of 3 uM. Further, 20 epitopes with high and 3 epitopes with moderate binding affinity found to stabilize the expression of HLA- A*02:01 molecules on the surface of the T2 cells. The levels of HLA-A*02:01 surface expression was determined by mean fluorescence intensity (MFI), measured by flow cytometry on T2 cells following an overnight incubation of T2 cells at 26°C with decreasing peptide epitopes molarity (30, 15 and 5μM) as shown in graphs. Percent MFI increase was calculated as follows: Percent MFI increase = (MFI with the given peptide - MFI without peptide) / (MFI without peptide) X 100.
Figure 3:
Figure 3:. CD8+ T cells specific to highly conserved SARS-CoV-2 epitopes detected in COVID-19 patients and unexposed healthy individuals:
(A) Experimental design: PBMCs from HLA-A*02:01 positive COVID-19 patients (n = 30) (B) and controls unexposed healthy individuals (n = 10) (C) were isolated and stimulated overnight with 10 μM of each of the 27 SARS-CoV-2-derived CD8+ T cell epitopes. The number of IFN-γ-producing cells were quantified using ELISpot assay (B, C and D). Dotted lines represent threshold to evaluate the relative magnitude of the response: a mean SFCs between 25 and 50 correspond to a medium/intermediate response whereas a strong response is defined for a mean SFCs > 50. PBMCs from HLA-A*02:01 positive COVID-19 patients (E) were further stimulated for an additional 5 hours in the presence of mAbs specific to CD107a and CD107b, and Golgi-plug and Golgi-stop. Tetramers specific to Spike epitopes, CD107a/b and CD69 and TNF-α expression were then measured by FACS. Representative FACS plot showing the frequencies of Tetramer+CD8+ T cells, CD107a/b+CD8+ T cells, CD69+CD8+ T cells and TNF-α+CD8+ T cells following priming with a group of 4 Spike CD8+ T cell epitope peptides. Average frequencies of tetramer+CD8+ T cells, CD107a/b+CD8+ T cells, CD69+CD8+ T cells and TNF-α+CD8+ T cells.
Figure 4:
Figure 4:. CD4+ T cells specific to highly conserved SARS-CoV-2 epitopes detected in COVID-19 patients and unexposed healthy individuals:
(A) Experimental design: PBMCs from HLA-DRB1 positive COVID-19 patients (n = 30) (B) and controls unexposed healthy individuals (n = 10) (C) were isolated and stimulated for 48 hrs. with 10 μM of each of the 16 SARS-CoV-2-derived CD4+ T cell epitopes. The number of IFN-γ-producing cells were quantified using ELISpot assay (B, C and D). Dotted lines represent a threshold to evaluate the relative magnitude of the response: a mean SFCs between 25 and 50 correspond to a medium/intermediate response, whereas a strong response is defined for a mean SFCs > 50. PBMCs from HLA-DRB1-positive COVID-19 patients (E) were further stimulated for an additional 5 hours in the presence of mAbs specific to CD107a and CD107b, and Golgi-plug and Golgi-stop. Tetramers specific to two Spike epitopes, CD107a/b and CD69 and TNF-α expression were then measured by FACS. Representative FACS plot showing the frequencies of Tetramer+CD4+ T cells, CD107a/b+CD4+ T cells, CD69+CD4+ T cells and TNF-α+CD4+ T cells following priming with a group of 2 Spike CD4+ T cell epitope peptides. Average frequencies are shown for tetramer+CD4+ T cells, CD107a/b+CD4+ T cells, CD69+CD4+ T cells and TNF-α+CD4+ T cells.
Figure 5:
Figure 5:. Immunogenicity of genome-wide identified human SARS-CoV-2 CD8+ T epitopes in HLA-A*02:01/HLA-DRB1 double transgenic mice.
(A) Timeline of immunization and immunological analyses. Eight groups of age-matched HLA-A*02:01 transgenic mice (n = 3) were immunized subcutaneously, on days 0 and 14, with a mixture of four SARS-CoV-2-derived human CD8+ T cell peptide epitopes mixed with PADRE CD4+ T helper epitope, delivered in alum and CpG1826 adjuvants. As a negative control, mice received adjuvants alone (mock-immunized). (B) Gating strategy used to characterize spleen-derived CD8+ T cells. Lymphocytes were identified by a low forward scatter (FSC) and low side scatter (SSC) gate. Singlets were selected by plotting forward scatter area (FSC-A) vs. forward scatter height (FSC-H). CD8 positive cells were then gated by the expression of CD8 and CD3 markers. (C) Representative ELISpot images (left panel) and average frequencies (right panel) of IFN-γ-producing cell spots from splenocytes (106 cells/well) stimulated for 48 hours with 10 μM of 10 immunodominant CD8+ T cell peptides and 1 subdominant CD8+ T cell peptide out of the total pool of 27 CD8+ T cell peptides derived from SARS-CoV-2 structural and non-structural proteins. The number on the top of each ELISpot image represents the number of IFN-γ-producing spot forming T cells (SFC) per one million splenocytes. (D) Representative FACS plot (left panel) and average frequencies (right panel) of IFN-γ and TNF-α production by, and CD107a/b and CD69 expression on 10 immunodominant CD8+ T cell peptides and 1 subdominant CD8+ T cell peptide out of the total pool of 27 CD8+ T cell peptides derived from SARS-CoV-2 structural and non-structural proteins determined by FACS. Numbers indicate frequencies of IFN-γ+CD8+ T cells, CD107+CD8+ T cells, CD69+CD8+ T cells and TNF-α+CD8+ T cells, detected in 3 immunized mice.
Figure 6:
Figure 6:. Immunogenicity of genome-wide identified human SARS-CoV-2 CD4+ T epitopes in HLA-A*02:01/HLA-DRB1 double transgenic mice.
(A) Timeline of immunization and immunological analyses. Four groups of age-matched HLA-DRB1 transgenic mice (n = 3) were immunized subcutaneously, on days 0 and 14, with a mixture of four SARS-CoV-2-derived human CD4+ T cell peptide epitopes delivered in alum and CpG1826 adjuvants. As a negative control, mice received adjuvants alone (mock-immunized). (B) Gating strategy used to characterize spleen-derived CD4+ T cells. CD4 positive cells were gated by the CD4 and CD3 expression markers. (C) Representative ELISpot images (left panel) and average frequencies (right panel) of IFN-γ-producing cell spots from splenocytes (106 cells/well) stimulated for 48 hours with 10 μM of 7 immunodominant CD4+ T cell peptides and 1 subdominant CD4+ T cell peptide out of the total pool of 16 CD4+ T cell peptides derived from SARS-CoV-2 structural and non-structural proteins. The number of IFN-γ-producing spot forming T cells (SFC) per one million of total cells is presented on the top of each ELISpot image. (D) Representative FACS plot (left panel) and average frequencies (right panel) show IFN-γ and TNF-α-production by, and CD107a/b and CD69 expression on 7 immunodominant CD4+ T cell peptides and 1 subdominant CD4+ T cell peptide out of the total pool of 16 CD4+ T cell peptides derived from SARS-CoV-2 determined by FACS. The numbers indicate percentages of IFN-γ+CD4+ T cells, CD107+CD4+ T cells, CD69+CD4+ T cells and TNF- α+CD4+ T cells detected in 3 immunized mice.
Figure 7:
Figure 7:. IgG antibodies specific to SARS-CoV-2 Spike protein-derived B-cell epitopes in immunized B6 mice and in convalescent COVID-19 patients:
(A) Timeline of immunization and immunological analyses. A total of 22 SARS-CoV-2 derived B-cell epitope peptides selected from SARS-CoV-2 Spike protein and tested in B6 mice were able to induce antibody responses. Four groups of age-matched B6 mice (n = 3) were immunized subcutaneously, on days 0 and 14, with a mixture of 4 or 5 SARS-CoV-2 derived B-cell peptide epitopes emulsified in alum and CpG1826 adjuvants. Alum/CpG1826 adjuvants alone were used as negative controls (mock-immunized). (B and C) The frequencies of IgG-producing CD3(−)CD138(+)B220(+) plasma B cells were determined in the spleen of immunized mice by flow cytometry. (B) The gating strategy was as follows: Lymphocytes were identified by a low forward scatter (FSC) and low side scatter (SSC) gate. Singlets were selected by plotting forward scatter area (FSC-A) versus forward scatter height (FSC-H). B cells were then gated by the expression of CD3(−) and B220(+) cells and CD138 expression on plasma B cells determined. (C) Representative FACS plot (left panels) and average frequencies (right panel) of plasma B cells detected in spleen of immunized mice. The percentages of plasma CD138(−)B220(+)B cells is indicated on the top left of each dot plot. (D) SARS-CoV-2 derived B-cell epitopes-specific IgG responses were quantified in immune serum, 14 days post-second immunization (i.e. day 28), by ELISpot (Number of IgG(+)Spots). Representative ELISpot images (left panels) and average frequencies (right panel) of anti-peptide specific IgG-producing B cell spots (1×10⁶ splenocytes/well) following 4 days in vitro B cell polyclonal stimulation with mouse Poly-S (Immunospot). The top/left of each ELISpot image shows the number of IgG-producing B cells per half a million cells. ELISA plates were coated with each individual immunizing peptide. The B-cell epitopes-specific IgG concentrations (μg/mL) measured by ELISA in: (E) Levels of IgG detected in peptide-immunized B6 mice, after subtraction of the background measured from mock-vaccinated mice. The dashed horizontal line indicates the limit of detection; and in (F) Level of IgG specific to each of the 22 Spike peptides detected SARS-CoV-2 infected patients (n=40), after subtraction of the background measured from healthy non-exposed individuals, as shown in (G) (n=10). Black bars and gray bars show high and medium immunogenic B cell peptides, respectively. The dashed horizontal line indicates the limit of detection.
Figure 8:
Figure 8:. Illustrations of the SARS-CoV/SARS-CoV-2 genome-wide location of the highly conserved, antigenic and immunogenic CD4+ T cell, CD8+ T cell, and B-cell epitopes.
(A) Enveloped, spherical, about 120 nm in diameter, SARS-CoV/SARS-CoV-2 genome encodes four structural proteins: spike (S), envelope (E), membrane (M), and nucleocapsid (N), highlighted in blue, green, gray and black, respectively. (B) The SARS-CoV/SARS-CoV-2 genome encodes two large non-structural genes ORF1a (green) and ORF1b (gray), encoding 16 non-structural proteins (NSP1– NSP16). The genome encodes at least six accessory proteins (shades of light grey) that are unique to SARS-CoV/SARS-CoV-2 in terms of number, genomic organization, sequence, and function. The common SARS-CoV, SARS-CoV-2 and SL-CoVs-derived human B (blue), CD4+ (green) and CD8+ (black) T cell epitopes are shown. Structural and non-structural open reading frames utilized in this study were from SARS-CoV-2-Wuhan-Hu-1 strain (NCBI accession number MN908947.3). The amino acid sequence of the SARS-CoV-2-Wuhan-Hu-1 structural and non-structural proteins was screened for human B, CD4+ and CD8+ T cell epitopes using different computational algorithms as previously described in Materials and Methods. Shown are genome-wide identified SARS-CoV-2 human B cell epitopes (in blue), CD4+ T cell epitopes (in green), CD8+ T cell epitopes (in black) that are highly conserved between human and animal Coronaviruses.

Update of

References

    1. Carroll D, Watson B, Togami E, Daszak P, Mazet JA, Chrisman CJ, Rubin EM, Wolfe N, Morel CM, Gao GF, Burci GL, Fukuda K, Auewarakul P, and Tomori O. 2018. Building a global atlas of zoonotic viruses. Bull World Health Organ 96: 292–294. - PMC - PubMed
    1. Allen T, Murray KA, Zambrana-Torrelio C, Morse SS, Rondinini C, Di Marco M, Breit N, Olival KJ, and Daszak P. 2017. Global hotspots and correlates of emerging zoonotic diseases. Nat Commun 8: 1124. - PMC - PubMed
    1. Valitutto MT, Aung O, Tun KYN, Vodzak ME, Zimmerman D, Yu JH, Win YT, Maw MT, Thein WZ, Win HH, Dhanota J, Ontiveros V, Smith B, Tremeau-Brevard A, Goldstein T, Johnson CK, Murray S, and Mazet J. 2020. Detection of novel coronaviruses in bats in Myanmar. PloS one 15: e0230802. - PMC - PubMed
    1. Vijaykrishna D, Smith GJ, Zhang JX, Peiris JS, Chen H, and Guan Y. 2007. Evolutionary insights into the ecology of coronaviruses. J Virol 81: 4012–4020. - PMC - PubMed
    1. Masters PS 2006. The molecular biology of coronaviruses. Adv Virus Res 66: 193–292. - PMC - PubMed

Publication types

MeSH terms