. 2021 May 4;118(18):e2023230118.
doi: 10.1073/pnas.2023230118.

ADAM9 enhances Th17 cell differentiation and autoimmunity by activating TGF-β1

Affiliations

ADAM9 enhances Th17 cell differentiation and autoimmunity by activating TGF-β1

Masataka Umeda et al. Proc Natl Acad Sci U S A. .

Abstract

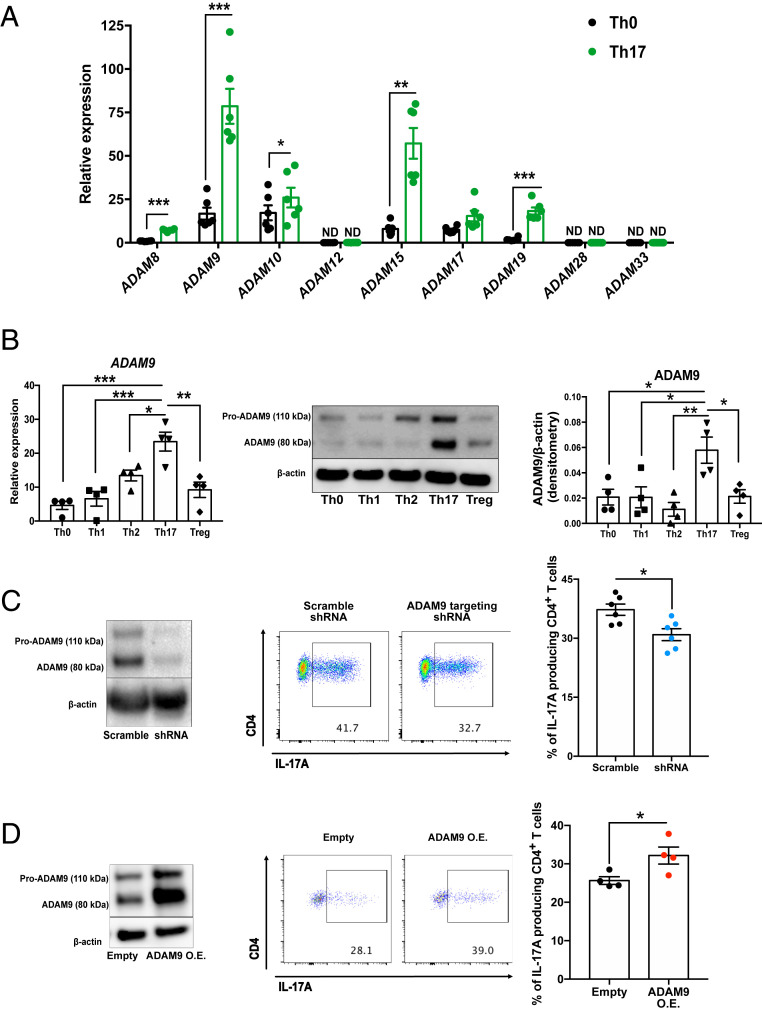
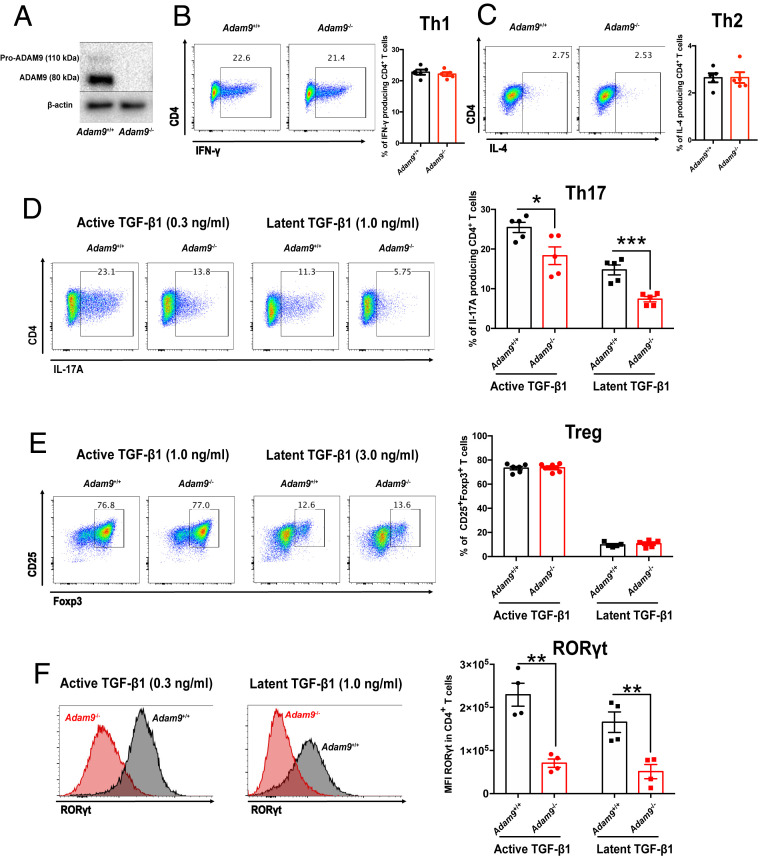
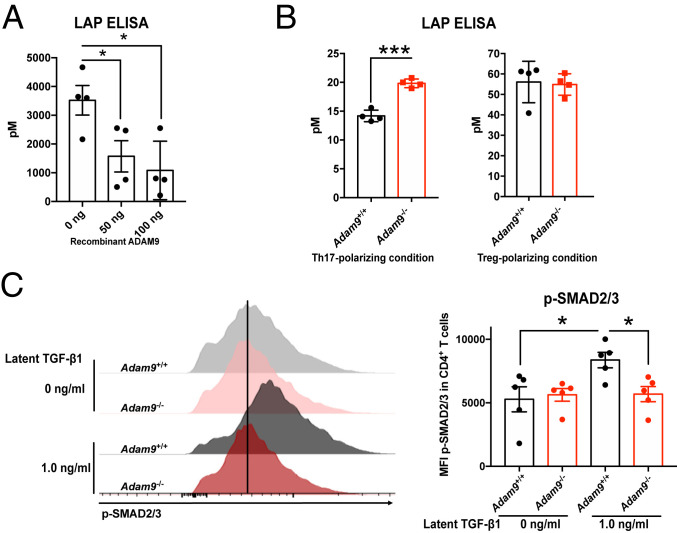
The a disintegrin and metalloproteinase (ADAM) family of proteinases alter the extracellular environment and are involved in the development of T cells and autoimmunity. The role of ADAM family members in Th17 cell differentiation is unknown. We identified ADAM9 to be specifically expressed and to promote Th17 differentiation. Mechanistically, we found that ADAM9 cleaved the latency-associated peptide to produce bioactive transforming growth factor β1, which promoted SMAD2/3 phosphorylation and activation. A transcription factor inducible cAMP early repressor was found to bind directly to the ADAM9 promoter and to promote its transcription. Adam9-deficient mice displayed mitigated experimental autoimmune encephalomyelitis, and transfer of Adam9-deficient myelin oligodendrocyte globulin-specific T cells into Rag1-/- mice failed to induce disease. At the translational level, an increased abundance of ADAM9 levels was observed in CD4+ T cells from patients with systemic lupus erythematosus, and ADAM9 gene deletion in lupus primary CD4+ T cells clearly attenuated their ability to differentiate into Th17 cells. These findings revealed that ADAM9 as a proteinase provides Th17 cells with an ability to activate transforming growth factor β1 and accelerates its differentiation, resulting in aberrant autoimmunity.

Keywords: Th17 cell; a disintegrin and metalloproteinase; systemic lupus erythematosus.


Conflict of interest statement

The authors declare no competing interest.

Figures

Fig. 1.
Fig. 1.
ADAM9 is expressed by Th17 cells and promotes Th17 cell differentiation. (A) Gene expression (qRT-PCR) of members of the ADAM family in CD4+ T cells cultured for 3 d under Th0 and Th17 conditions. Cumulative data are shown (mean ± SEM, n = 6). (B) Gene expressions (qRT-PCR) of ADAM9 in CD4+ cells cultured under the indicated conditions. Cumulative data are shown (Left, mean ± SEM, n = 4). A representative Western blot of CD4+ cells cultured for 3 d for pro-ADAM9, ADAM9 (active), and β-actin expressions are shown (Center), and cumulative densitometric readings of ADAM9 (active) and β-actin are shown (Right, mean ± SEM, n = 4). (C) Naive CD4+ T cells were cultured under Th17-polarizing conditions and transfected with ADAM9-shRNA or scramble-shRNA as a negative control. Pro-ADAM9, ADAM9 (active), and β-actin protein expressions on day 3 were assessed by Western blotting. A representative (of three) blot is shown (Left). Representative flow plots (Center) and cumulative data (Right) are shown (mean ± SEM, n = 6). (D) Naive CD4+ T cells were cultured under Th17-polarizing conditions and empty vector (empty) or ADAM9 overexpression (ADAM9 O.E.) plasmids were transfected into cultured T cells on day 1. Pro-ADAM9, ADAM9 (active), and β-actin protein expressions on day 3 were assessed by Western blotting. Representative (of three) blots are shown (Left). Representative flow plots (Center) on day 3 and cumulative data (Right) are shown (mean ± SEM, n = 4). *P < 0.05, **P < 0.01, ***P < 0.001, ND: not detected.
Fig. 2.
Fig. 2.
Genetic ADAM9 deficiency results in decreased Th17 cell differentiation. (AF) Naïve CD4+ T cells from B6. Adam9+/+ mice or B6. Adam9−/− mice were polarized for 3 d under the indicated conditions. (A) Pro-ADAM9, ADAM9 (active), and actin protein expressions were assessed on day 3 by Western blotting. A representative (of three) blot is shown. (BE) Representative flow plots of intracellular expressions of IFNγ, IL-4, IL-17A, and Foxp3 (Left) of cells cultured under the indicated conditions and cumulative data (Right) are shown (mean ± SEM, n = 5). (F) Representative flow histogram (Left) and cumulative MFI of RORγt (Right) are shown (mean ± SEM, n = 4). *P < 0.05, **P < 0.01, ***P < 0.001.
Fig. 3.
Fig. 3.
ADAM9 drives Th17 cell differentiation through the TGF-β1 activation. (A) Recombinant ADAM9 or buffer alone were incubated with 50 ng of latent TGF-β1 at 37 °C for 16 h at pH 7.4. The reaction products which contain latency-associated peptide (LAP) were analyzed by ELISA kit for detecting LAP (mean ± SEM, n = 4). (B) Naïve CD4+ T cells were cultured under Th17 or Treg conditions. After 48 h of incubation, culture media were changed to the Th17-polarizing conditions with latent TGF-β1 (1.0 ng/mL) or Treg-polarizing conditions with latent TGF-β1 (3.0 ng/mL), respectively. After 16 h of incubation, the concentration of LAP in the supernatants was determined by ELISA (mean ± SEM, n = 4). (C) Naïve CD4+ T cells were cultured under the Th17 condition with latent TGF-β1 (1.0 ng/mL). After 48 h of incubation, culture media was changed to the Th17-polarizing condition with latent TGF-β1 (1.0 ng/mL or 0 ng/mL as a control), but without FBS to make serum-starved condition. After 16 h of incubation with the serum-starved condition, cells were analyzed by flow cytometry to assess p-Smad2/3. Representative flow histogram (Left) and cumulative MFI of phosphorylated SMAD2/3 (Right) are shown (mean ± SEM, n = 5). *P < 0.05, ***P < 0.001.
Fig. 4.
Fig. 4.
Transcriptional factor ICER promotes ADAM9 expression in Th17 cells. (A and B) ICER/CREM-deficient or -sufficient naïve CD4+ T cells cultured under Th17-polarizing conditions for 3 d. (A) Relative ADAM9 mRNA expressions were assessed by qRT-PCR. Cumulative data are shown (mean ± SEM, n = 12). (B) Pro-ADAM9, ADAM9 (active), and β-actin expressions on day 3 were determined by Western blotting. A representative (of six) blot is shown (Left) and cumulative densitometric readings of ADAM9 (active) and β-actin are shown (Right) (mean ± SEM, n = 6). (C) Naïve CD4+ T cells from ICER/CREM-deficient or -sufficient IL-17GFP mice were polarized under Th17 conditions for 3 d. ADAM9 mRNA expression of FACS-sorted GFP+ cells (IL-17A–producing cells) was assessed by qRT-PCR (mean ± SEM, n = 7). (D) Th17-polarized naive CD4+ T cells were cultured in the presence of a STAT3 inhibitor (STA21, 10 μM) or dimethyl sulfoxide (DMSO) for 3 d. Pro-ADAM9, ADAM9 (active), and β-actin expressions were determined by Western blotting. A representative (of five) blot is shown (Left) and cumulative densitometric readings of ADAM9 (active) and β-actin are shown (Right) (mean ± SEM, n = 5). (E) Naive CD4+ T cells from ICER/CREM-deficient IL-17GFP mice were cultured under Th17-polarizing conditions and empty vector (empty) or ADAM9 overexpression (ADAM9 O.E.) plasmids were transfected into cultured T cells on day 1. Representative flow plots on day 3 (Left) and cumulative data (Right) are shown (mean ± SEM, n = 5). (FH) ICERγ binds to the ADAM9 promoter directly and increases its activity. ICER/CREM-deficient or -sufficient naïve CD4+ T cells were cultured under Th17-polarizing conditions. (F) Schematic representation of the used reporter constructs. Numbers represent the position from the transcription start site of the murine ADAM9 gene. (G) The full-length ADAM9 promoter region (full) or a version containing a mutated CRE binding site (Δ-134/-130) were transfected into Th17-polarized T cells on day 1. Cells were harvested and lysed on day 2. Cumulative results of four independent experiments are shown (mean ± SEM). (H) The FLAG-tagged ICERγ overexpression vector was transfected into ICER/CREM-deficient CD4+ T cells on day one. Cells were harvested and lysed on day 3, and binding of FLAG/ICERγ to the CRE was assessed by ChIP assay. CRE at the intron1 of the ADAM9 gene and CRE at the intron 3 of the adjacent gene (Tm2d2) were used as negative controls for ChIP enrichment. Representative blots from three experiments are shown. *P < 0.05, **P < 0.01.
Fig. 5.
Fig. 5.
ADAM9 deletion mitigates EAE. (AD) EAE was induced in B6. ADAM9+/+ mice or B6. Adam9−/− mice by immunization with MOG35–55 emulsified in the complete Freund’s adjuvant. (A) Clinical scores. Cumulative results of two independent experiments are shown (mean ± SEM, n = 7). (B) Spinal cords were harvested on day 14 and stained with H&E to assess inflammation (scale bars, 500 μm or 100 μm [magnified panels]). Quantitative cumulative data are shown on the right (mean ± SEM, n = 9. (C) Absolute cell numbers of spinal cord–infiltrated CD4+ T cells, IL-17A–producing CD4+ T cells, IFNγ-producing CD4+ T cells, and Foxp3+ CD4+ T cells were evaluated by flow cytometry on day 14. Cumulative data are shown (mean ± SEM, n = 7). (D) Mononuclear cells harvested from inguinal lymph nodes on day 8 were activated in vitro with MOG35–55 for 3 d. IL-17A and IFNγ concentrations were measured by ELISA. Cumulative data are shown (mean ± SEM, n = 6). (E and F) Naïve CD4+ T cells from Adam9+/+ 2D2 mice or Adam9−/− 2D2 mice were cultured under Th17-polarizing conditions. On day 3 of culture, harvested cells were transferred to recipient Rag−/− mice intravenously. (E) Clinical scores of recipient mice. Cumulative results of six to seven mice per group are shown (mean ± SEM). (F) Absolute cell numbers of spinal cord–infiltrated CD4+ T cells and IL-17A–producing CD4+ T cells were evaluated by flow cytometry on day 14. Cumulative data are shown (mean ± SEM, n = 6-7). *P < 0.05; **P < 0.01, ***P < 0.001.
Fig. 6.
Fig. 6.
ADAM9 highly expressed in CD4+ T cells from SLE patients and promoted Th17 differentiation. (A) Purified CD4+ T cells from healthy controls (HC) and SLE patients were stimulated with plate-bound CD3 and CD28 antibodies. After overnight (14–16 h) stimulation, cells were collected, and ADAM9 and actin expressions were examined by Western blotting. A representative (n = 14) blot is shown (Left), and densitometric readings from cumulative data are shown on the Right (mean ± SEM, n = 14). (B) Naive CD4+ T cells from SLE patients were cultured under Th17-polarizing conditions and nontarget sgRNA or ADAM9-targeting sgRNA along with Cas9 protein were transfected on day 2. A representative (n = 3) blot, which confirmed the efficient deletion of ADAM9, is shown on the Left. Representative flow plots on day 7 (Center) and cumulative data (Right) are shown (mean ± SEM, n = 6). (C) A proposed model represents that ADAM9 drives Th17 cell differentiation through the activation of TGF-β1.

Similar articles

Cited by

References

    1. Tsokos G. C., Systemic lupus erythematosus. N. Engl. J. Med. 365, 2110–2121 (2011). - PubMed
    1. Koga T., Ichinose K., Kawakami A., Tsokos G. C., The role of IL-17 in systemic lupus erythematosus and its potential as a therapeutic target. Expert Rev. Clin. Immunol. 15, 629–637 (2019). - PubMed
    1. Ouyang W., Kolls J. K., Zheng Y., The biological functions of T helper 17 cell effector cytokines in inflammation. Immunity 28, 454–467 (2008). - PMC - PubMed
    1. Burkett P. R., Meyer zu Horste G., Kuchroo V. K., Pouring fuel on the fire: Th17 cells, the environment, and autoimmunity. J. Clin. Invest. 125, 2211–2219 (2015). - PMC - PubMed
    1. Wong C. K., et al. ., Hyperproduction of IL-23 and IL-17 in patients with systemic lupus erythematosus: Implications for Th17-mediated inflammation in auto-immunity. Clin. Immunol. 127, 385–393 (2008). - PubMed

Publication types

MeSH terms