. 2021 Apr 28;12(1):2460.
doi: 10.1038/s41467-021-22814-9.

Rapid evolution and host immunity drive the rise and fall of carbapenem resistance during an acute Pseudomonas aeruginosa infection

Affiliations

Rapid evolution and host immunity drive the rise and fall of carbapenem resistance during an acute Pseudomonas aeruginosa infection

Rachel Wheatley et al. Nat Commun. .

Abstract

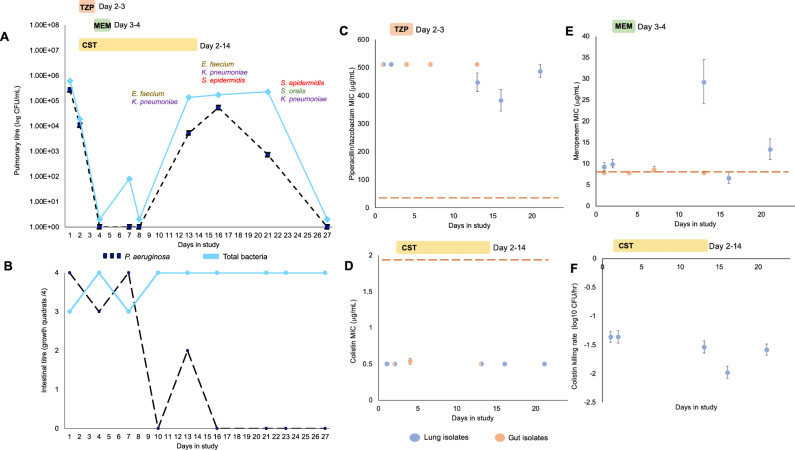
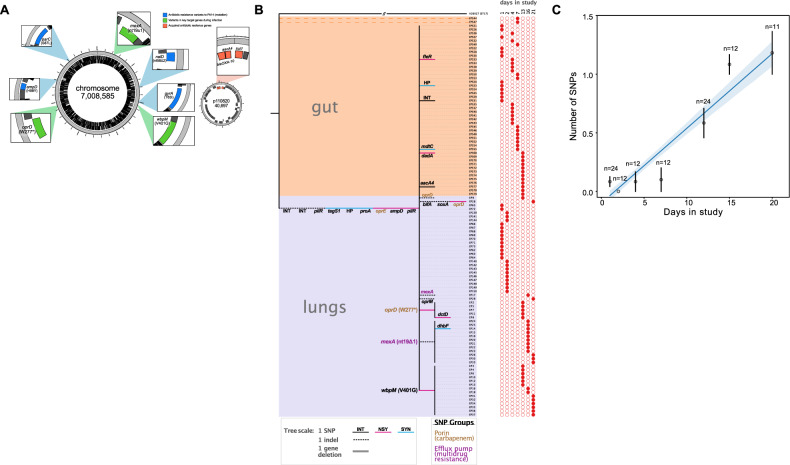
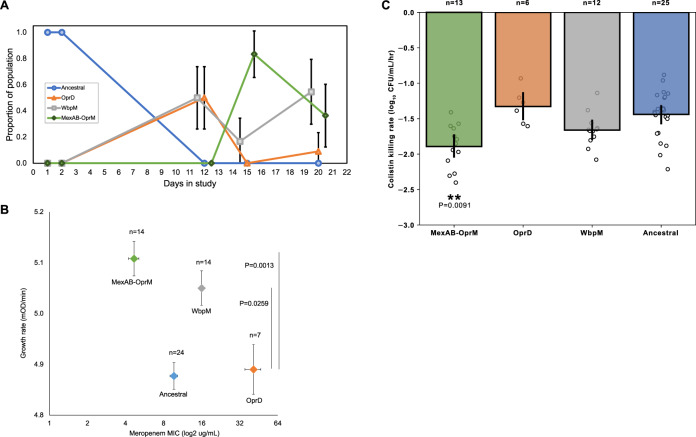
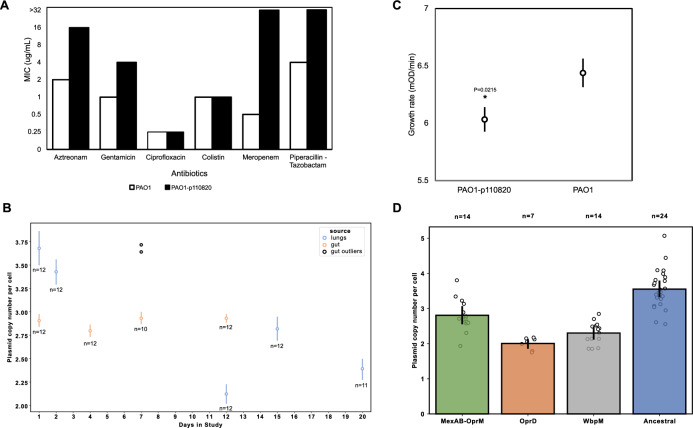
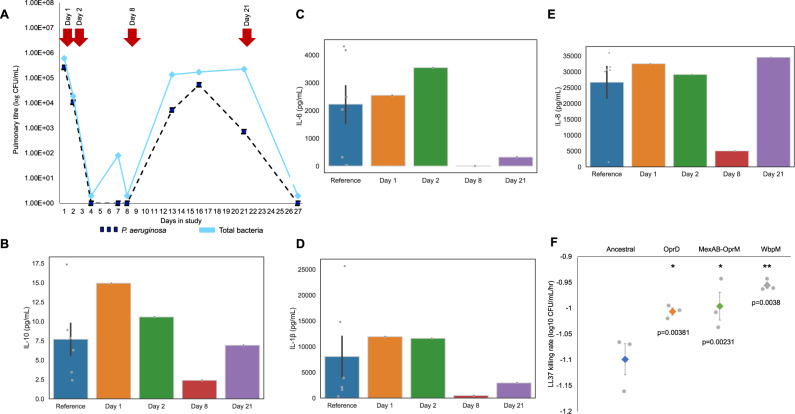
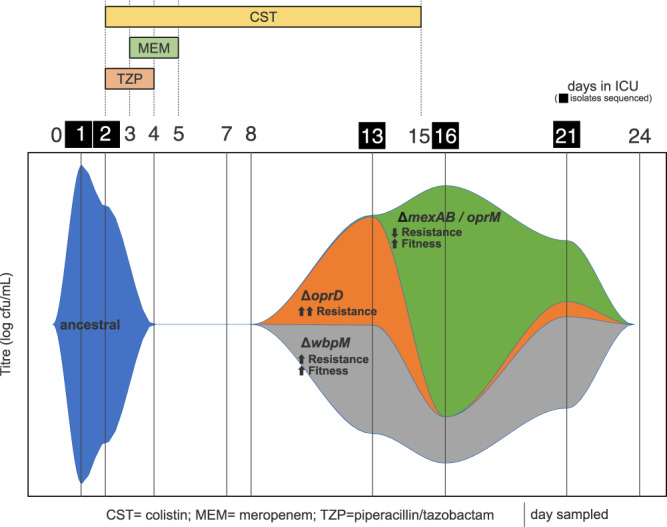
It is well established that antibiotic treatment selects for resistance, but the dynamics of this process during infections are poorly understood. Here we map the responses of Pseudomonas aeruginosa to treatment in high definition during a lung infection of a single ICU patient. Host immunity and antibiotic therapy with meropenem suppressed P. aeruginosa, but a second wave of infection emerged due to the growth of oprD and wbpM meropenem resistant mutants that evolved in situ. Selection then led to a loss of resistance by decreasing the prevalence of low fitness oprD mutants, increasing the frequency of high fitness mutants lacking the MexAB-OprM efflux pump, and decreasing the copy number of a multidrug resistance plasmid. Ultimately, host immunity suppressed wbpM mutants with high meropenem resistance and fitness. Our study highlights how natural selection and host immunity interact to drive both the rapid rise, and fall, of resistance during infection.


Conflict of interest statement

The authors declare no competing interests.

Figures

Fig. 1
Fig. 1. Clinical timeline and resistance phenotyping.
A Bacterial abundance in the lung was assessed by plating out samples of endotracheal aspirate (ETA) on Pseudomonas selective agar (dark blue) and blood agar (total titer, light blue). Rank-order species abundance data is shown for the total bacterial counts. B Bacterial abundance in the gut was assessed on a nominal scale by streaking peri-anal swabs on Pseudomonas selective agar and blood agar (total titer). Day 1 in study is 72 h after ICU admission and corresponds to the first day of patient informed consent. The patient received intravenous treatment with piperacillin/tazobactam (TZP: 4 g/0.5 g IV q8h), meropenem (MEM1: g IV q8h) and colistin (CST 3 million IU IV q8h). Panels CE show the mean MIC of lung (blue) and intestinal (beige) isolates, as determined by broth microdilution (+/− s.e.m; n = 11 or 12 isolates). Red dashed lines represent the EUCAST clinical breakpoint (01/01/2019 edition). Panel F shows the mean rate of change in viable cell titer of lung isolates following treatment with 2 mg/L of colistin (+/− s.e.m; n = 10-12 isolates). Source data are provided as a Source Data file.
Fig. 2
Fig. 2. Genomic data and isolate phylogeny.
A Closed reference genome of the ST17 clone that initiated lung infection, highlighting pre-existing resistance genes and key variants acquired during infection. B Neighbor-joining tree showing SNPs and indels in lung and gut isolates compared to the reference genome, rooted to an ST17 outgroup genome (H26027). The tree shows intergenic (INT), synonymous (SYN) and non-synonymous mutations (NSY) SNPs and indels in coding and non-coding (INT) regions. Key mutations in oprD, mexA, and wbpM are highlighted. Note that 2 gut isolates lack 8 SNPs found in the reference genome and all of the other isolates. C Root-to-tip regression comparing genetic divergence from the reference genome (i.e., number of SNPs) with day of isolate sampling (mean + /− s.e.m; n > 10 isolates per time point). Note that this plot excludes the two outlier isolates from B. The solid line shows a linear regression of SNP accumulation against time (+/− 95% confidence intervals). The image shown in 2A was created by J.D-C using Circos v. 0.69 (ref. ) and modified using Affinity Designer [West Bridgford, UK]. Source data are provided as a Source Data file.
Fig. 3
Fig. 3. Evolutionary responses to antibiotic treatment in the lung.
A Changes in the genetic composition of the lung population over time. Plotted points show the portion of isolates of the ancestral strain and mutants that evolved in situ (n = 11 or 12 isolates per time point). Data points were offset for visual clarity and error bars show 90% confidence intervals in proportions calculated by the normal approximation to the binomial distribution. B Meropenem resistance and fitness of respiratory isolates (mean + /− s.e.m; n > 5 isolates per group). Fitness was measured as log-phase growth rate in culture medium lacking antibiotics (10 replicates per isolate). WbpM and MexAB-OprM mutants had high fitness relative to OprD mutants, as determined by a two-tailed Dunnett’s test treating oprD as the control group. C Colistin tolerance, as measured by the rate of cell killing at 2 mg/L colistin (mean + /− s.e.m; n > 5 isolates per group). Altered colistin tolerance was only found in MexAB-OprM mutants, as determined by a two-tailed Dunnett’s test treating the ancestral strain as a control group (P = 0.0091). Source data are provided as a Source Data file.
Fig. 4
Fig. 4. Plasmid-encoded resistance.
A Antibiotic resistance phenotypes of PA01:p110820 transformants compared to a plasmid-free PA01 control. Plasmid carriage increased resistance to meropenem and piperacillin-tazobactam to at least 32 mg/L, exceeding the EUCAST clinical breakpoints (meropenem, 8 mg/L; piperacillin-tazobactam, 16 mg/L). B Changes in plasmid copy number during infection. Plotted points show the mean plasmid copy number of lung (blue) and gut (beige) isolates from each time point (+/− s.e.m.; n = 10–12 isolates), excluding two genetically divergent gut isolates that are plotted separately. The second wave of lung infection was associated with a reduced plasmid copy number compared to the initial infection (two-tailed t57 = 8.15, P < 0.0001). C Fitness effects of plasmid carriage were assayed by measuring the growth rate of PA01 and PA01:p110820 in antibiotic-free culture medium (n = 11 replicates/strain). Plasmid carriage reduced growth rate (two-tailed t21 = 2.48, P = 0.0215). D Plasmid copy number of lung isolates according to genotype (mean + /− s.e.m.; n = 7–24 isolates per genotype). Source data are provided as a Source Data file.
Fig. 5
Fig. 5. Immune responses to infection.
Cytokine concentrations were measured in samples of ETA collected over the course of infection. Panel A places cytokine sampling points into the context of the infection. Panels BE show levels of cytokines that have been shown to protect against P. aeruginosa infection. A single measure of cytokine abundance was taken from each ETA sample due to the high reproducibility of these assays. Reference shows the abundance of cytokines in critically ill patients from the ASPIRE-ICU study who did not develop pneumonia (mean + /− s.e.m; n = 6 patients). F LL-37 tolerance of lung isolates, as measured by the rate of cell death at a fixed dose of LL-37 (50 μg/mL). Plotted points show death rate of each genotype (mean + /− s.e.m; n = 3 isolates). Increased LL-37 tolerance was only found in all mutants, as determined by a two-tailed Dunnett’s test treating the ancestral strain as a control group. Source data are provided as a Source Data file.
Fig. 6
Fig. 6. Summary of bacterial dynamics during infection.
This Muller plot summarizes changes in the density and composition of the lung population of P. aeruginosa during infection and it highlights the key phenotypic effects of observed mutations. This plot does not represent the reduction in the copy number of the p110820 plasmid during infection (Fig. 4C).

References

    1. Friedman ND, Temkin E, Carmeli Y. The negative impact of antibiotic resistance. Clin. Microbiol. Infect. 2016;22:416–422. doi: 10.1016/j.cmi.2015.12.002. - DOI - PubMed
    1. Bell BG, Schellevis F, Stobberingh E, Goossens H, Pringle M. A systematic review and meta-analysis of the effects of antibiotic consumption on antibiotic resistance. BMC Infect. Dis. 2014;14:13. doi: 10.1186/1471-2334-14-13. - DOI - PMC - PubMed
    1. Fish DN, Piscitelli SC, Danziger LH. Development of resistance during antimicrobial therapy: a review of antibiotic classes and patient characteristics in 173 studies. Pharmacotherapy: J. Hum. Pharmacol. Drug Ther. 1995;15:279–291. - PubMed
    1. Shorr AF, Combes A, Kollef MH, Chastre J. Methicillin-resistant Staphylococcus aureus prolongs intensive care unit stay in ventilator-associated pneumonia, despite initially appropriate antibiotic therapy. Crit. Care Med. 2006;34:700–706. doi: 10.1097/01.CCM.0000201885.57697.21. - DOI - PubMed
    1. Costelloe C, Metcalfe C, Lovering A, Mant D, Hay AD. Effect of antibiotic prescribing in primary care on antimicrobial resistance in individual patients: systematic review and meta-analysis. BMJ. 2010;340:c2096. doi: 10.1136/bmj.c2096. - DOI - PubMed

Publication types

MeSH terms