. 2021 Apr 28;11(1):9218.
doi: 10.1038/s41598-021-87534-y.

A role for circular code properties in translation

Affiliations

A role for circular code properties in translation

Simone Giannerini et al. Sci Rep. .

Abstract

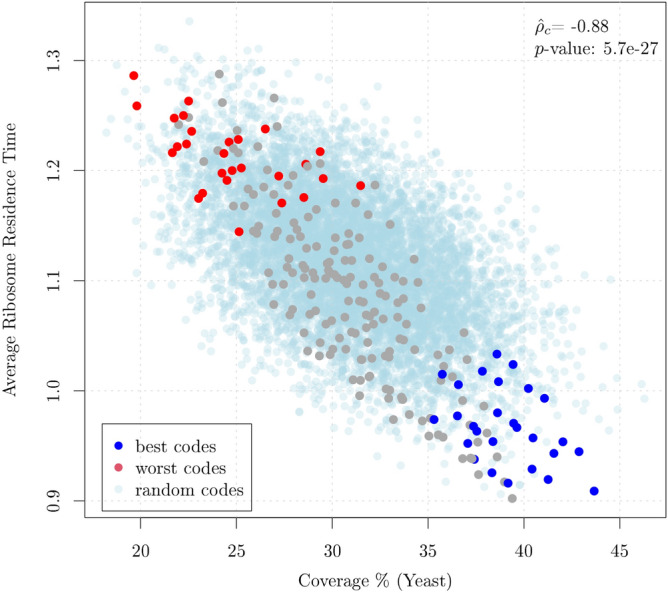
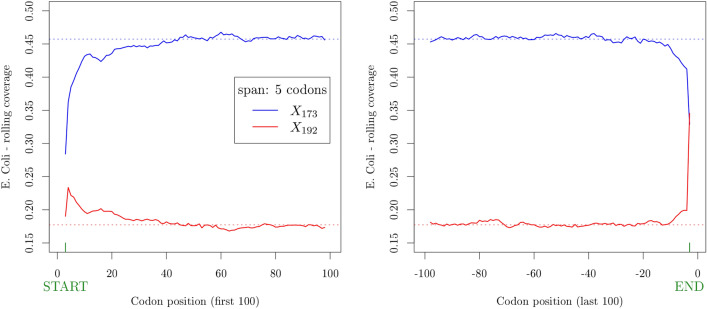
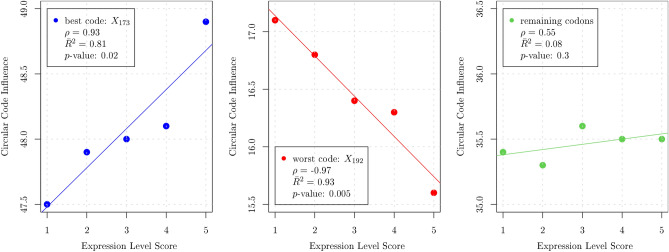
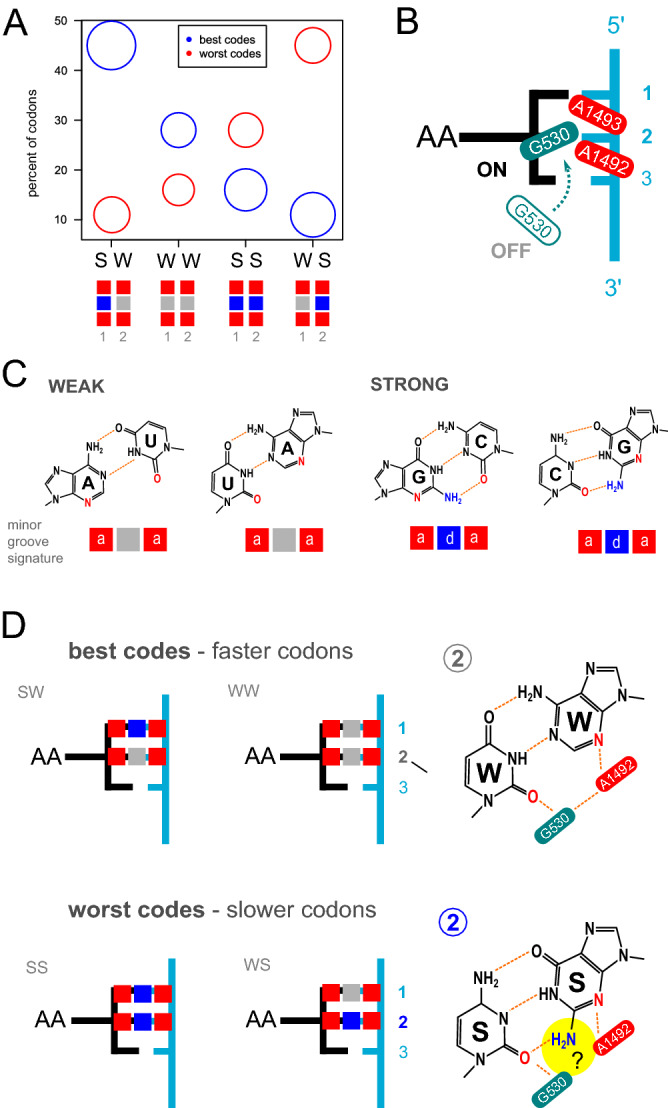
Circular codes represent a form of coding allowing detection/correction of frame-shift errors. Building on recent theoretical advances on circular codes, we provide evidence that protein coding sequences exhibit in-frame circular code marks, that are absent in introns and are intimately linked to the keto-amino transformation of codon bases. These properties strongly correlate with translation speed, codon influence and protein synthesis levels. Strikingly, circular code marks are absent at the beginning of coding sequences, but stably occur 40 codons after the initiator codon, hinting at the translation elongation process. Finally, we use the lens of circular codes to show that codon influence on translation correlates with the strong-weak dichotomy of the first two bases of the codon. The results can lead to defining new universal tools for sequence indicators and sequence optimization for bioinformatics and biotechnological applications, and can shed light on the molecular mechanisms behind the decoding process.


Conflict of interest statement

The authors declare no competing interests.

Figures

Figure 1
Figure 1
Universal scaling properties of the coverage within equivalence classes for the three reading frames.
Figure 2
Figure 2
Ordered speed of the 64 codons, the data come from the experiment of and lower values indicate faster codons. The codons coloured in blue (upper panel) and in red (lower panel) belong to code X173 and X192, respectively. They are the best and worst codes within the set of 8 codes forming the equivalence class shown in Table 4.
Figure 3
Figure 3
Average speed of translation versus Coverage (percent) for the 216 circular codes partitioned in 27 equivalence classes of 8 codes each. The points in blue and red correspond to the 27 best and 27 worst codes (corresponding to the KM transformation of the best codes) within their associated equivalence class. Clearly, the coverage is a predictor of the speed of translation and the best and worst codes within their equivalence class clusterize. The results for 8000 random codes are also shown in light blue and the p-value for the test that the observed correlation is equal to that of random codes is reported.
Figure 4
Figure 4
Average codon influence versus Coverage (percent) computed on the 216 circular codes partitioned in 27 equivalence classes of 8 codes each. The points in blue and red correspond to the 27 best and 27 worst codes within their associated equivalence class, respectively. As for the speed of translation (Fig. 3), the coverage is a predictor of codon influence and the best and worst codes within their equivalence class clusterize. The results for 8000 random codes are also shown in light blue and the p-value for the test that the observed correlation is equal to that of random codes is reported.
Figure 5
Figure 5
Average Ribosome Residence Time (RRT) versus Coverage (percent) computed on the 216 circular codes partitioned in 27 equivalence classes of 8 codes each. The points in blue and red correspond to the 27 best and 27 worst codes within their associated equivalence class, respectively. Similarly to the experiments shown above, the coverage is a predictor of the RRT and the best and worst codes within their equivalence class clusterize. The results for 8000 random codes are also shown in light blue and the p-value for the test that the observed correlation is equal to that of random codes is reported.
Figure 6
Figure 6
Rolling coverage (span: 5 codons) computed on the first (left) and last (right) 100 codon positions, averaged over the whole set of 3983 complete coding sequences of E. coli. The blue and red solid lines correspond to code X173 and X192, respectively. The dotted lines correspond to the global coverage of the codes over the whole genome.
Figure 7
Figure 7
Expression level score versus average cumulative influence of circular codes. Left panel: best code X173. Center panel: worst code X192. Right panel: remaining codons, excluding stops.
Figure 8
Figure 8
Correlation of circular code properties with the S/W character of the codon hint at the decoding mechanism dynamics. (A) Comparison of codon composition of best codes (blue) and worst codes (red) according to the S/W chemical dichotomy of the first two nucleotides of the codon. The area of the bubbles is proportional to the average codon influence. Codons of the kind SWN and WWN identify the best codes, i.e. those associated to a higher expression level and coverage. Conversely, codons of the kind SSN and WSN characterize the codes having lower expression level and coverage. Boxed rectangles depict H-bond pattern formation in the minor groove of the codon-anticodon minihelix in positions 1 and 2 (see panel C for molecular details). (B) Model for the cognate codon-anticodon recognition in the minor groove of the decoding center (A site) of the ribosome; mRNA (light blue), aminoacyl-tRNA (black), universally conserved A1492 and A1493 nucleotides forming A-minor motif (red); universally conserved G530 nucleotide involved in latch closure and H-bonding with A1492 and A1493 (petrol green); numbers denote the nucleotide position of the codon. (C) Molecular detail of all possible cognate Watson-Crick base pairs. The minor grove locates beneath each pair. Notice that W–W (A–U and U–A, respectively) and S–S (G–C and C–G) display the same signature of H-bond acceptors (a, red) and donors (d, blue). (D) Projection of the H-bond acceptor and donor signatures on the decoding center model. Faster codons (more abundant in better codes) lack the central H-bond donor in the second nucleotide of the codon (highlighted in yellow), which characterize the slowest codons (more frequent in worst codes). Note that the keto-amino (KM) transformation, invariably leading from the best to the worst code in each equivalence class, always transforms a W base in S and viceversa.

References

    1. Woese C. Order in the genetic code. Proc. Nat. Acad. Sci. 1965;54:71–75. doi: 10.1073/pnas.54.1.71. - DOI - PMC - PubMed
    1. Itzkovitz S, Alon U. The genetic code is nearly optimal for allowing additional information within protein-coding sequences. Genome Res. 2007;17:405–412. doi: 10.1101/gr.5987307. - DOI - PMC - PubMed
    1. Bergman S, Tuller T. Widespread non-modular overlapping codes in the coding regions. Phys. Biol. 2020 doi: 10.1088/1478-3975/ab7083. - DOI - PubMed
    1. Quax T, Claassens N, Söll D, van der Oost J. Codon bias as a means to fine-tune gene expression. Mol. Cell. 2015;59:149–161. doi: 10.1016/j.molcel.2015.05.035. - DOI - PMC - PubMed
    1. Boël G, et al. Codon influence on protein expression in E. coli correlates with mRNA levels. Nature. 2016;529:358–376. doi: 10.1038/nature16509. - DOI - PMC - PubMed

LinkOut - more resources