. 2021 Apr;592(7856):747-755.
doi: 10.1038/s41586-020-03040-7. Epub 2021 Apr 28.

Universal nomenclature for oxytocin-vasotocin ligand and receptor families

Affiliations

Universal nomenclature for oxytocin-vasotocin ligand and receptor families

Constantina Theofanopoulou et al. Nature. 2021 Apr.

Abstract

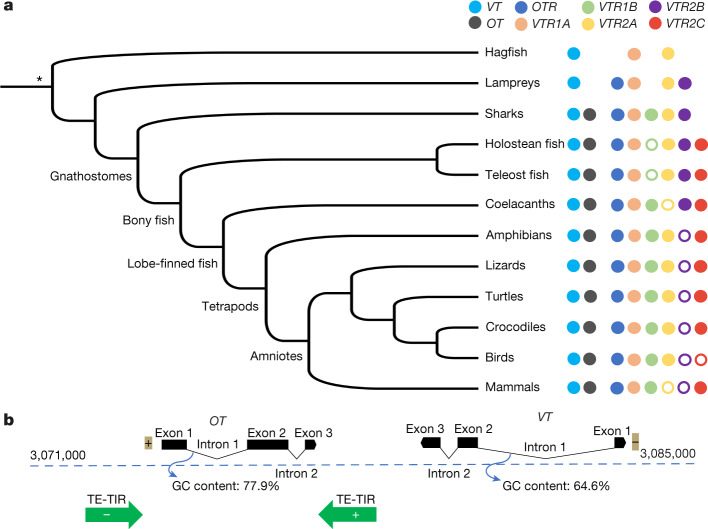
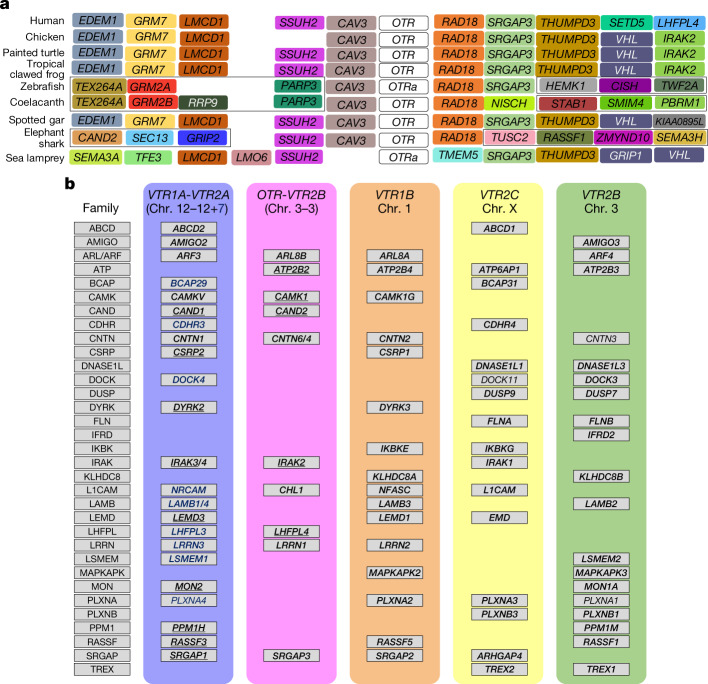
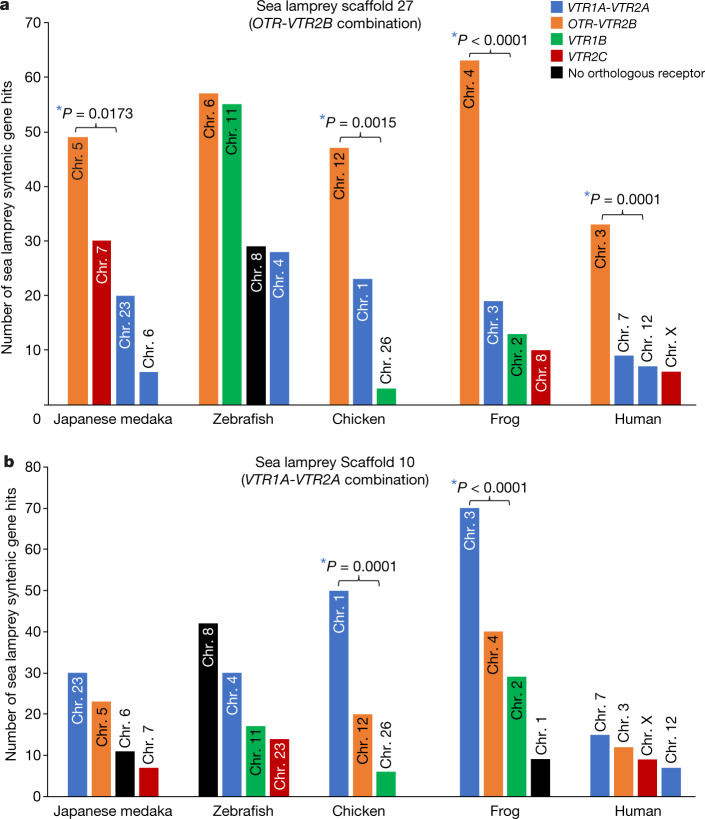
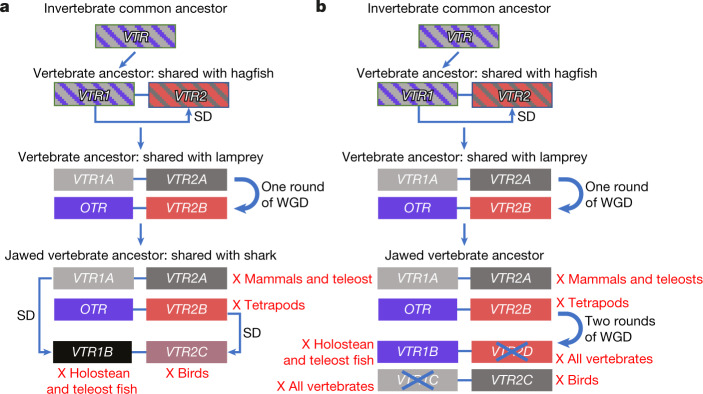
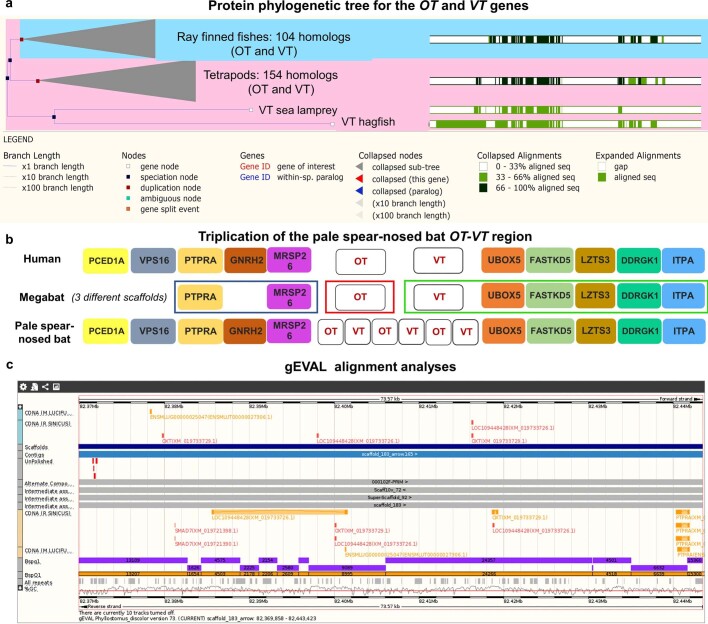
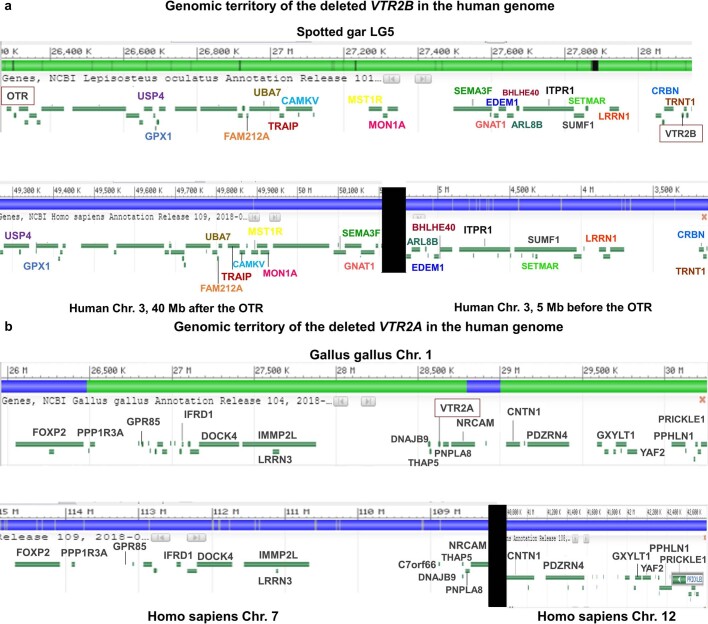
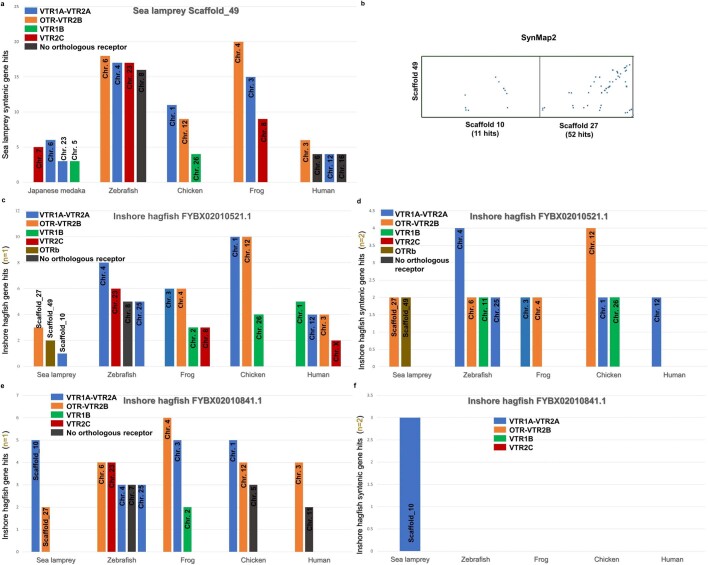
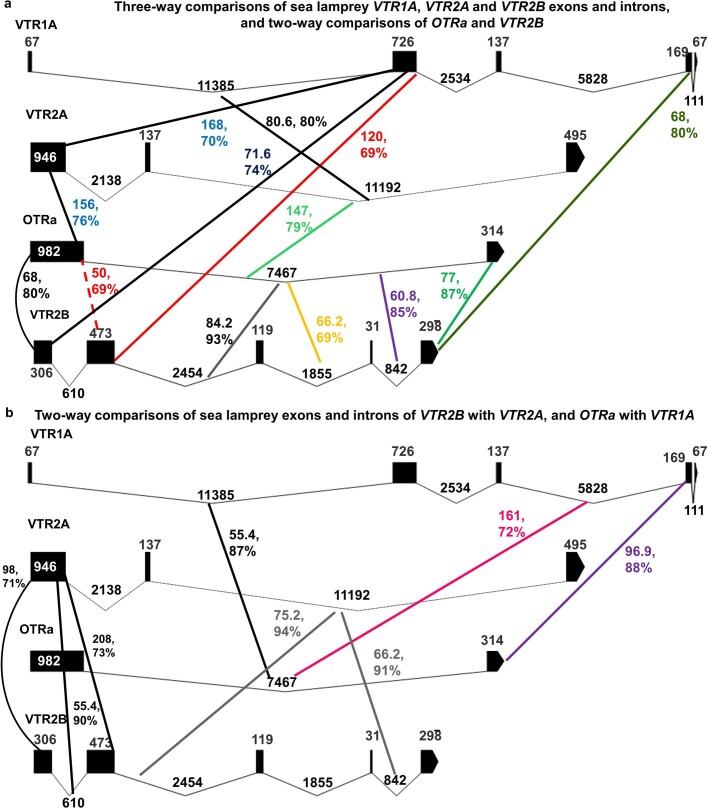
Oxytocin (OXT; hereafter OT) and arginine vasopressin or vasotocin (AVP or VT; hereafter VT) are neurotransmitter ligands that function through specific receptors to control diverse functions1,2. Here we performed genomic analyses on 35 species that span all major vertebrate lineages, including newly generated high-contiguity assemblies from the Vertebrate Genomes Project3,4. Our findings support the claim5 that OT (also known as OXT) and VT (also known as AVP) are adjacent paralogous genes that have resulted from a local duplication, which we infer was through DNA transposable elements near the origin of vertebrates and in which VT retained more of the parental sequence. We identified six major oxytocin-vasotocin receptors among vertebrates. We propose that all six of these receptors arose from a single receptor that was shared with the common ancestor of invertebrates, through a combination of whole-genome and large segmental duplications. We propose a universal nomenclature based on evolutionary relationships for the genes that encode these receptors, in which the genes are given the same orthologous names across vertebrates and paralogous names relative to each other. This nomenclature avoids confusion due to differential naming in the pre-genomic era and incomplete genome assemblies, furthers our understanding of the evolution of these genes, aids in the translation of findings across species and serves as a model for other gene families.


Conflict of interest statement

The authors declare no competing interests.

Figures

Fig. 1
Fig. 1. Phylogenetic distribution and local gene duplication.
a, Phylogenetic distribution of OT, VT and OTR-VTR genes among vertebrates. Filled circles, presence of a gene; empty circles, loss of a gene; no circle, the gene never evolved in that lineage. Phylogenetic tree based on ref. . *Unresolved relationship for whether hagfishes and lampreys constitute a single phylum or two separate phyla,. b, Local chromosomal organization of the OT and VT region. Representation of the position (in kb), orientation (+ or −) of OT and VT genes (exons + introns) in human chromosome 12, intron length (scale, 100 bases), GC content and DNA transposable elements with terminal inverted repeats (TE-TIRs) (green).
Fig. 2
Fig. 2. Interspecies and intraspecies synteny analyses.
a, Example of interspecies ten-gene microsynteny for OTR across vertebrates. Same colour, orthologous genes. Black boxes, genome rearrangements. OTRa in the sea lamprey and zebrafish is orthologous to OTR in all other vertebrates. Human OTR is currently known as OXTR; tropical clawed frog otr is currently known as oxtr. b, Intraspecies 10-Mb macrosynteny among 6 chromosomes (block colours) for all OTR-VTR gene regions in humans whether present (OTR, VTR1A, VTR1B and VTR2C) or deleted (VTR2A and VTR2B). Gene families are listed alphabetically on the left. In the blue column, underlined genes were found within a 10-Mb window of VTR1A on chromosome 12. In the pink column, underlined genes were found within a 10-Mb window of OTR on chromosome 3; genes in black bold were found within a 10-Mb window of the deleted VTR2A on chromosome 12 or (in blue bold) 7, or within the 10-Mb window of the deleted VTR2B on chromosome 3. Orange column, all genes listed (in black bold) were found within a 10-Mb window of VTR1B on chromosome 1 (orange block). Yellow column, all genes listed (in black bold) were found within a 10-Mb window of VTR2C on chromosome X (yellow block). Green column, an alternative syntenic territory of VTR2B (green) was also found at a different location of chromosome 3. Genes not in bold are found outside of the strict 10-Mb window, but are on the same chromosome as the respective OTR-VTR gene.
Fig. 3
Fig. 3. Analysis with SynMap2 identified syntenic gene hits between sea lamprey scaffolds containing two receptors each and chromosomes of other species.
Bar graphs were created from dot plots. a, Sea lamprey scaffold 27 is most syntenic with chromosomes of other species that contain the OTR-VTR2B combination. b, Sea lamprey scaffold 10 is most syntenic with chromosomes of other species that contain the VTR1A-VTR2A combination. The minimum number of aligned homologous gene pairs to be considered syntenic was 3 at a 20-gene maximum distance in each species. For comparisons including human, the minimum number was set to 2. *Significant differences between chromosomes with the highest number of gene hits within a species (P < 0.05; χ2 test, two-sided; n = 199 genes located on scaffold 27; n = 246 genes located on scaffold 10).
Fig. 4
Fig. 4. OTR-VTR gene family trees.
a, Tree topology inferred with the phylogenetic maximum likelihood method on an exon nucleotide alignment (MAFFT), with 1,000 non-parametric bootstrap replicates. Bootstrap values are shown as percentages at the branch points (values <50% were considered less informative). The tree is rooted with the three VTR genes we found in amphioxus. The gene names of the current accessions (see Table 1 and Supplementary Tables 4a–e for full list of synonyms) were written over according to our revised synteny-based orthology. Scale bar, phylogenetic distance of 0.78 substitutions. b, Tree topology inferred with the phylogenetic TreeFam method on an amino acid alignment generated via the Ensembl ‘gene tree’ tool (gene tree identifier: ENSGT00760000119156). Left, red boxes denote inferred gene duplication node; blue boxes denote inferred speciation events; and turquoise boxes denote ambiguous nodes. Right, green bars denote multiple amino acid alignment made with MUSCLE; white areas denote gaps in the alignment; and dark green bars denote consensus alignments. Gene names are revised according to our synteny-based orthology; Extended Data Fig. 8 shows a tree with the current nomenclature in Ensembl.
Fig. 5
Fig. 5. Two proposed hypotheses for the evolution of OTR-VTR genes.
a, Hypothesis 1 proposes the receptors evolved by an initial segmental duplication (SD), then a one round of whole-genome duplication (WGD), followed by two segmental duplications in different vertebrate lineages and then by losses (red X) in specific lineages. b, Hypothesis 2 proposes the initial segmental duplication was followed by two rounds of whole-genome duplication and specific losses (X), including in all vertebrates (blue X). Lines connecting genes indicate that they are on the same chromosome in most species. Alignments between sets of genes indicate the closest related paralogues.
Extended Data Fig. 1
Extended Data Fig. 1. Lineage specific OT-VT specializations.
a, Protein phylogenetic tree for VT in hagfish and lamprey relative to other vertebrates. Maximum likelihood amino acid phylogenetic tree generated via the Ensembl ‘Gene tree’ tool (gene tree identifier: ENSGT00390000004511) that uses the Gene Orthology/Paralogy prediction method pipeline. The longest available protein of each species was used. The tree is reconciled with a species tree, generated by TreeBeST. Left, red boxes, inferred gene duplication node; blue boxes, inferred speciation events; turquoise boxes, ambiguous nodes. Right, green bars, multiple amino acid alignment made with MUSCLE; white areas, gaps in the alignment; dark green bars, consensus alignments. We curated the tree and renamed genes using the universal nomenclature proposed in this Article. The tree with the current nomenclature used in the annotations of these genomes can be found at http://www.ensembl.org/Multi/GeneTree/Image?collapse=none;db=core;gt=ENSGT00390000004511. b, Triplication of the pale spear-nosed bat OT-VT region. An approximately10-gene window of synteny between human, megabat and pale spear-nosed bat is shown. In megabat, OT, VT and their syntenic genes are found in three different scaffolds (three boxes). In the pale spear-nosed bat with a higher-quality assembly, a syntenic triplication of the OT-VT region is found. c, gEVAL alignment analyses (https://geval.sanger.ac.uk/index.html). This panel shows gapless Pacbio-based long-read contigs (dark blue) and gapless Bionano optical maps (yellow), which span through the entire region with the OT and VT duplications in the pale spear-nosed bat, without any noticeable assembly errors.
Extended Data Fig. 2
Extended Data Fig. 2. Lost VTR receptors in human, representative of mammals.
a, Genomic territory of the deleted VTR2B in the human genome. The genomic territory before the spotted gar VTR2B (top) was found in human chromosome 3 (49–51 Mb), 40 Mb after the location of human OTR (bottom). The genomic territory before the spotted gar VTR2B was also found in human chromosome 3 (3–5 Mb), 5 Mb before the location of human OTR. Text colours denote orthologous genes. Solid black region links two different regions on chromosome 3 in the human genome. b, Genomic territory of the deleted VTR2A in the human genome. The genomic territory before the chicken VTR2A (top) was found in human chromosome 7 (100–115 Mb) (bottom). The genomic territory after the chicken VTR2A was found in human chromosome 12 (40–43 Mb). The solid back region links two regions from chromosomes 7 and 12 in the human genome.
Extended Data Fig. 3
Extended Data Fig. 3. Macrosynteny SynFind analyses.
ad, Comparisons between closely related species (human and chimpanzee) for four receptors, showing maximum syntenies found using this method. eh, Comparisons between intermediately related species (human and chicken) for the same four receptors in ad. il, Comparisons between distantly related species (human and fish). mp, Comparisons between distantly related non-human species. On the x axis, 0 represents the query OTR-VTR in the query organism and the numbers represent the number of genes on the 5′ (left) and 3′ (right) of the query OTR-VTR in the genome. The y axis shows the cumulative number of the matched homologous (orthologous or paralogous) syntenic genes in the reference genome for each reference receptor. For example, in a the chimpanzee OTR region (red line) shows 17 syntenic gene matches within 20 genes 5′ (left) of human OTR, and 18 matches within 20 genes 3′ (right) of human OTR. If the reference OTR-VTR does not show any match, then it is 0 on the y axis (for example, the chimpanzee VTR1B (shown in green in a)); if the reference OTR-VTR matches only the query OTR-VTR, it reaches 1 (for example, chimpanzee VTR1A (shown in in blue in d) was orthologous only to human VTR2C). If the reference OTR-VTR is not orthologous to the query OTR-VTR, but does show gene matches in the neighbouring territory, then it indicates a deletion of the receptor in the query species (for example, chicken VTR1A (shown in blue in f)).
Extended Data Fig. 4
Extended Data Fig. 4. Additional chromosomal SynMap2 analyses with lamprey and hagfish.
Bar graphs were created from dot plots. a, Additional scaffold in sea lamprey (scaffold 49) with a VTR gene is most syntenic with chromosomes of other species containing a VTR1-VTR2 combination, with a 3-gene minimum per 20-gene window criterion. b, SynMap2 dot plot between sea lamprey scaffold 49 and scaffolds 10 and 27, with a 3-gene minimum per 10- gene window criterion. c, The inshore hagfish scaffold FYBX02010521.1, in which the putative VTR2 is located, is most syntenic with chromosomes of other species containing a VTR2A or VTR2B sequence, with a 1-gene minimum per 20-gene window criterion. d, Same synteny analyses as in c, but with a 2-gene minimum per 20-gene window criterion. e, The inshore hagfish scaffold FYBX02010841.1, in which the putative VTR1 is located, is most syntenic with chromosomes of other species containing a VTR1A or OTR sequence, with a 1-gene minimum per 20-gene window criterion. f, Same synteny analyses as in e, but with a 2-gene minimum per 20-gene window criterion.
Extended Data Fig. 5
Extended Data Fig. 5. Interspecies BLASTn comparisons between exons and introns of all sea lamprey OTR-VTRs in multiple combinations.
a, Three-way comparisons of sea lamprey VTR1A, VTR2A and VTR2B exons (boxes) and introns (lines), and two-way comparisons of OTRa and VTR2B. b, Two-way comparisons of sea lamprey exons and introns of VTR2B with VTR2A, and OTRa with VTR1A. Maximum scores and per cent identities are shown for the alignments that exceed a threshold (maximum score > 40 and E value < 10−4). Sequence length is shown in bp.
Extended Data Fig. 6
Extended Data Fig. 6. Interspecies non-coding RNA paralogous synteny analyses.
a, Long non-coding RNAs around the OTR and VTR1 genes within human. b, Long non-coding RNAs around the OTR-VTRs in sea lamprey. Lines connect the long non-coding RNAs that shared identity beyond a threshold (maximum score > 40 and E value < 10−4) in the BLASTn comparisons. Maximum score (bit score) and per cent identity are shown for each pair of long non-coding RNAs. Genomic location is in Mb.
Extended Data Fig. 7
Extended Data Fig. 7. Intraspecies BLASTn comparisons between exons and introns of OTR-VTRs.
a, Two-way comparisons of exons (boxes) and introns (lines) of elephant shark VTR1B with sea lamprey VTR1A and OTRa. b, Two-way comparisons of exons and introns of coelacanth VTR2C with sea lamprey VTR2A and OTRa. Maximum scores and per cent identities are shown for the alignments that yielded results beyond a threshold (maximum score > 40 and E value <10−4). Sequence length is shown in bp.
Extended Data Fig. 8
Extended Data Fig. 8. Protein phylogenetic tree for OTR-VTRs with the currently used gene nomenclature.
The same amino acid tree as in Fig. 4b, but labelled with the nomenclature used to date. Further variations within large vertebrate groups, such as tetrapods (for example, VT1 to VT4 in birds, AVPR3 in mammals and AVPR4 in fish), are not shown.
Extended Data Fig. 9
Extended Data Fig. 9. Microsynteny for VTR2A across vertebrates and VTR2A and OTRb within sea lamprey.
An approximately 14-gene window around the VTR2A orthologue across species is shown. In the sea lamprey, OTRb is our revised nomenclature for PMZ_0045207-RA/PMZ_0032217-RA on scaffold 49 (Supplementary Table 14), and VTR2A is our revision for PMZ_0042163-RA on scaffold 10 (Supplementary Table 14). Orthologous genes are filled with the same colour; genes found in the territory of the sea lamprey are further outlined in black lines. Further discussion is provided in Supplementary Note 2.
Extended Data Fig. 10
Extended Data Fig. 10. MAFFT alignment of the OTR-VTRs of the best-quality assemblies available (human for OTR, VTR1A, VTR1B and VTR2C; zebra finch for VTR2A; and clingfish for VTR2B).
The MAFFT alignment using the FFT-NS-I parameter was visualized with the MSA viewer. The identifiers and protein sequences used, along with the alignment file can be found in https://github.com/constantinatheo/otvt. The functional annotation of transmembrane domains (TM) and intracellular loops (IT) and binding domains is based on findings with OTR. Amino acids marked with an asterisk are the OT polar-interacting sites to the receptor; amino acids marked with a # are differences between the VTR1 and VTR2 subfamilies. Colour coding of the amino acids is according to Clustal X (blue, hydrophobic; red, positive charge; green, polar; pink, cysteines; orange, glycines; yellow, prolines; cyan, aromatic; http://www.jalview.org/help/html/colourSchemes/clustal.html).

Comment in

References

    1. Knobloch HS, Grinevich V. Evolution of oxytocin pathways in the brain of vertebrates. Front. Behav. Neurosci. 2014;8:31. doi: 10.3389/fnbeh.2014.00031. - DOI - PMC - PubMed
    1. Meyer-Lindenberg A, Domes G, Kirsch P, Heinrichs M. Oxytocin and vasopressin in the human brain: social neuropeptides for translational medicine. Nat. Rev. Neurosci. 2011;12:524–538. doi: 10.1038/nrn3044. - DOI - PubMed
    1. Rhie, A. et al. Towards complete and error-free genome assemblies of all vertebrate species. Nature10.1038/s41586-021-03451-0 (2021). - PMC - PubMed
    1. Jebb D, et al. Six reference-quality bat genomes reveal evolution of bat adaptations. Nature. 2020;583:578–584. doi: 10.1038/s41586-020-2486-3. - DOI - PMC - PubMed
    1. Hoyle CH. Neuropeptide families and their receptors: evolutionary perspectives. Brain Res. 1999;848:1–25. doi: 10.1016/S0006-8993(99)01975-7. - DOI - PubMed

LinkOut - more resources