. 2021 Apr;592(7856):737-746.
doi: 10.1038/s41586-021-03451-0. Epub 2021 Apr 28.

Towards complete and error-free genome assemblies of all vertebrate species

Arang Rhie #  1 Shane A McCarthy #  2   3 Olivier Fedrigo #  4 Joana Damas  5 Giulio Formenti  4   6 Sergey Koren  1 Marcela Uliano-Silva  7   8 William Chow  3 Arkarachai Fungtammasan  9 Juwan Kim  10 Chul Lee  10 Byung June Ko  11 Mark Chaisson  12 Gregory L Gedman  6 Lindsey J Cantin  6 Francoise Thibaud-Nissen  13 Leanne Haggerty  14 Iliana Bista  2   3 Michelle Smith  3 Bettina Haase  4 Jacquelyn Mountcastle  4 Sylke Winkler  15   16 Sadye Paez  4   6 Jason Howard  17 Sonja C Vernes  18   19   20 Tanya M Lama  21 Frank Grutzner  22 Wesley C Warren  23 Christopher N Balakrishnan  24 Dave Burt  25 Julia M George  26 Matthew T Biegler  6 David Iorns  27 Andrew Digby  28 Daryl Eason  28 Bruce Robertson  29 Taylor Edwards  30 Mark Wilkinson  31 George Turner  32 Axel Meyer  33 Andreas F Kautt  33   34 Paolo Franchini  33 H William Detrich 3rd  35 Hannes Svardal  36   37 Maximilian Wagner  38 Gavin J P Naylor  39 Martin Pippel  15   40 Milan Malinsky  3   41 Mark Mooney  42 Maria Simbirsky  9 Brett T Hannigan  9 Trevor Pesout  43 Marlys Houck  44 Ann Misuraca  44 Sarah B Kingan  45 Richard Hall  45 Zev Kronenberg  45 Ivan Sović  45   46 Christopher Dunn  45 Zemin Ning  3 Alex Hastie  47 Joyce Lee  47 Siddarth Selvaraj  48 Richard E Green  43   49 Nicholas H Putnam  50 Ivo Gut  51   52 Jay Ghurye  49   53 Erik Garrison  43 Ying Sims  3 Joanna Collins  3 Sarah Pelan  3 James Torrance  3 Alan Tracey  3 Jonathan Wood  3 Robel E Dagnew  12 Dengfeng Guan  2   54 Sarah E London  55 David F Clayton  56 Claudio V Mello  57 Samantha R Friedrich  57 Peter V Lovell  57 Ekaterina Osipova  15   40   58 Farooq O Al-Ajli  59   60   61 Simona Secomandi  62 Heebal Kim  10   11   63 Constantina Theofanopoulou  6 Michael Hiller  64   65   66 Yang Zhou  67 Robert S Harris  68 Kateryna D Makova  68   69   70 Paul Medvedev  69   70   71   72 Jinna Hoffman  13 Patrick Masterson  13 Karen Clark  13 Fergal Martin  14 Kevin Howe  14 Paul Flicek  14 Brian P Walenz  1 Woori Kwak  63   73 Hiram Clawson  43 Mark Diekhans  43 Luis Nassar  43 Benedict Paten  43 Robert H S Kraus  33   74 Andrew J Crawford  75 M Thomas P Gilbert  76   77 Guojie Zhang  78   79   80   81 Byrappa Venkatesh  82 Robert W Murphy  83 Klaus-Peter Koepfli  84 Beth Shapiro  85   86 Warren E Johnson  84   87   88 Federica Di Palma  89 Tomas Marques-Bonet  90   91   92   93 Emma C Teeling  94 Tandy Warnow  95 Jennifer Marshall Graves  96 Oliver A Ryder  44   97 David Haussler  43   85 Stephen J O'Brien  98   99 Jonas Korlach  45 Harris A Lewin  5   100   101 Kerstin Howe  102 Eugene W Myers  103   104   105 Richard Durbin  106   107 Adam M Phillippy  108 Erich D Jarvis  109   110   111
Affiliations

Towards complete and error-free genome assemblies of all vertebrate species

Arang Rhie et al. Nature. 2021 Apr.

Abstract

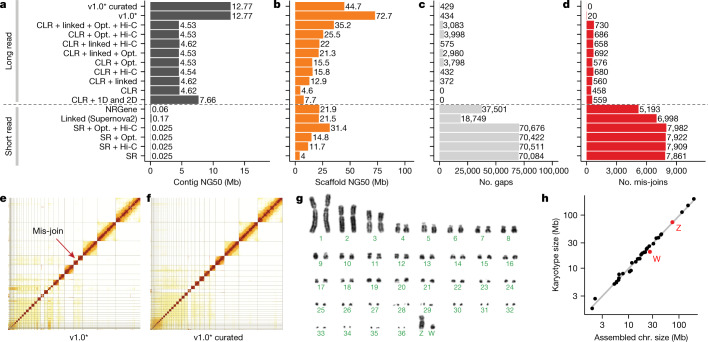
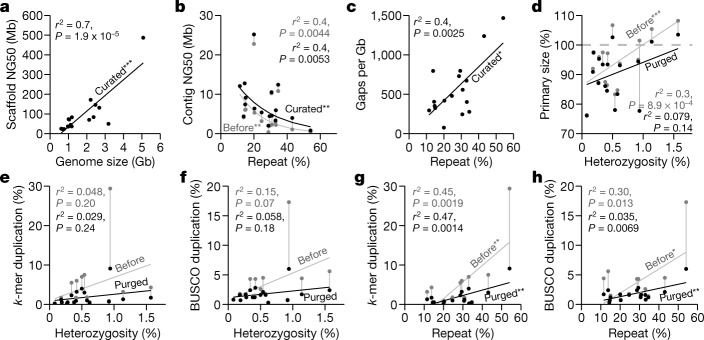
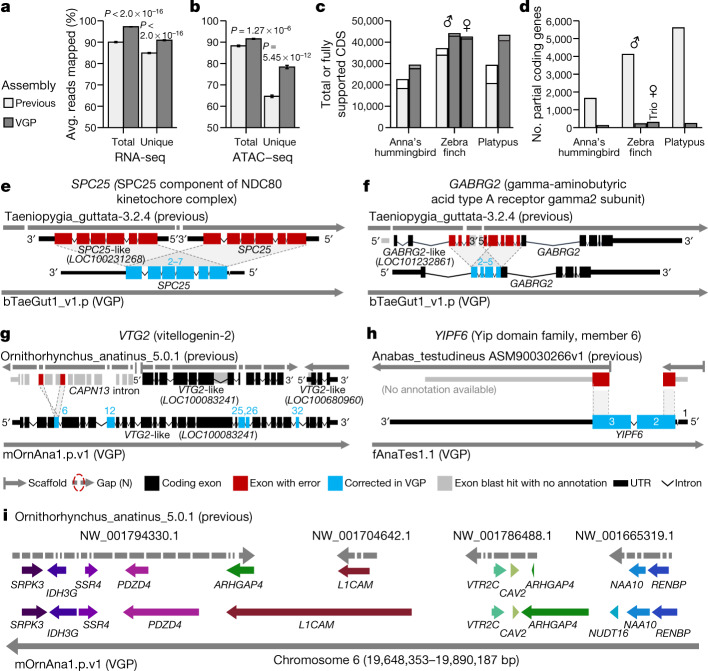
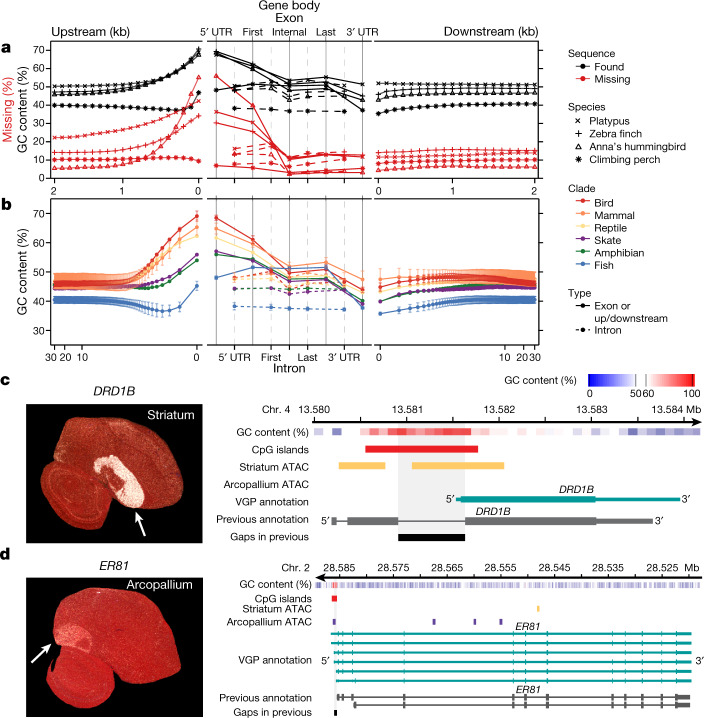
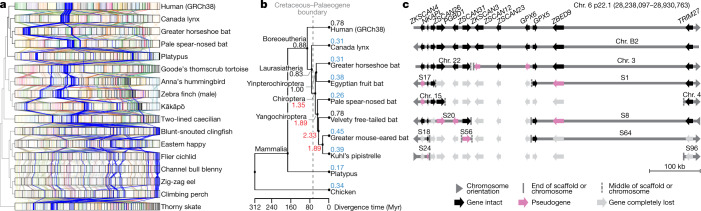
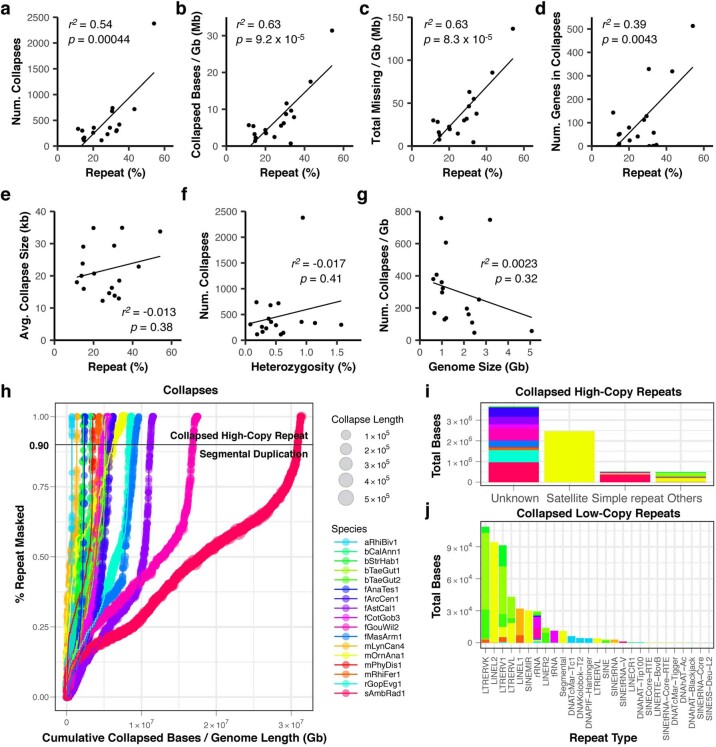
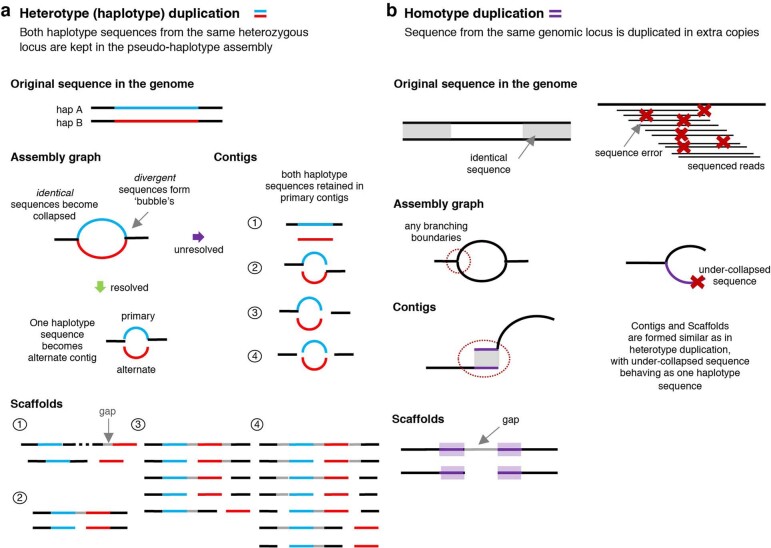
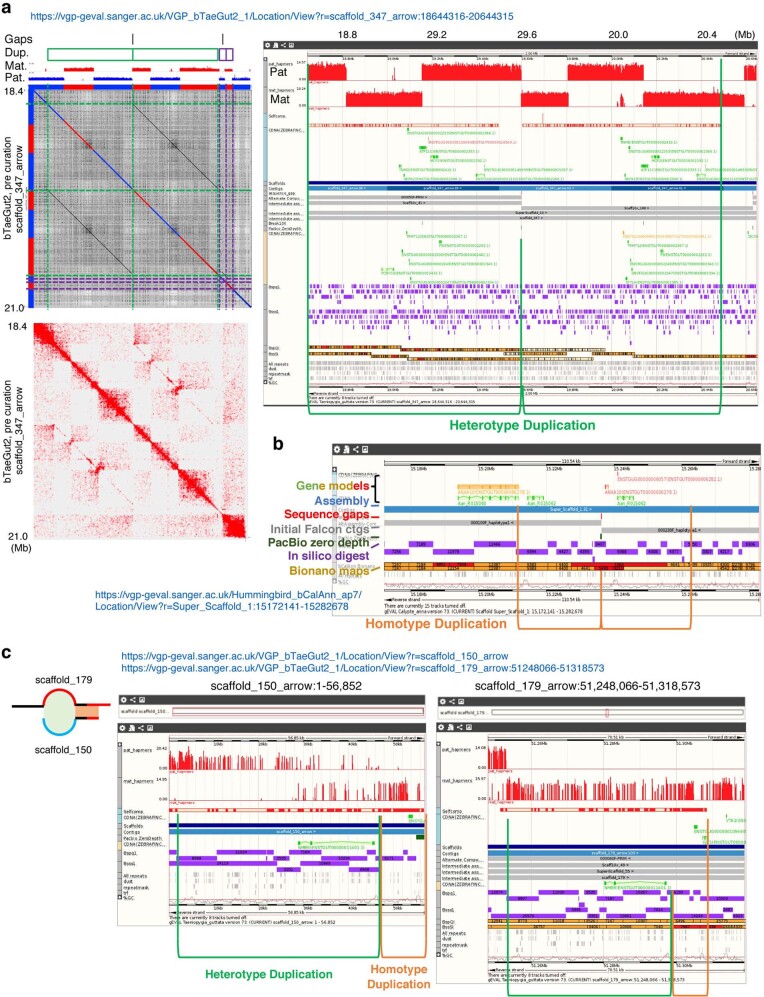
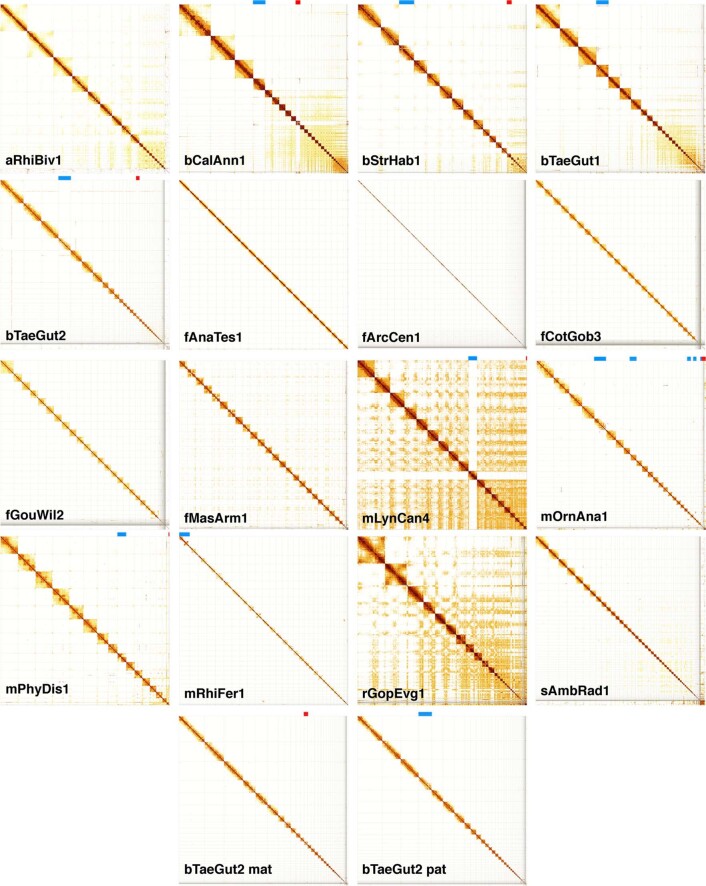
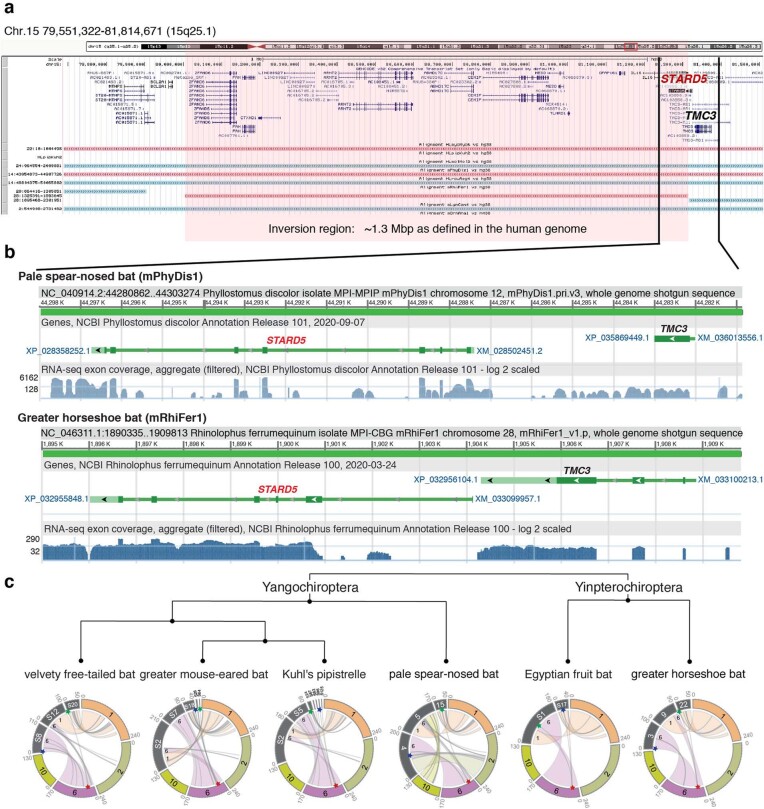
High-quality and complete reference genome assemblies are fundamental for the application of genomics to biology, disease, and biodiversity conservation. However, such assemblies are available for only a few non-microbial species1-4. To address this issue, the international Genome 10K (G10K) consortium5,6 has worked over a five-year period to evaluate and develop cost-effective methods for assembling highly accurate and nearly complete reference genomes. Here we present lessons learned from generating assemblies for 16 species that represent six major vertebrate lineages. We confirm that long-read sequencing technologies are essential for maximizing genome quality, and that unresolved complex repeats and haplotype heterozygosity are major sources of assembly error when not handled correctly. Our assemblies correct substantial errors, add missing sequence in some of the best historical reference genomes, and reveal biological discoveries. These include the identification of many false gene duplications, increases in gene sizes, chromosome rearrangements that are specific to lineages, a repeated independent chromosome breakpoint in bat genomes, and a canonical GC-rich pattern in protein-coding genes and their regulatory regions. Adopting these lessons, we have embarked on the Vertebrate Genomes Project (VGP), an international effort to generate high-quality, complete reference genomes for all of the roughly 70,000 extant vertebrate species and to help to enable a new era of discovery across the life sciences.


Conflict of interest statement

During the contributing period, B.T.H., M. Simbirsky, A.F. and M. Mooney were employees of DNAnexus Inc. S.B.K., R.H., Z.K., J. Korlach, I.S. and C.D. were full-time employees at Pacific Biosciences, a company developing single-molecule long read sequencing technologies. R.E.G., N.H.P., and J.G. were affiliated with Dovetail Genomics, a company developing genome assembly tools, including Hi-C. I.G. was affiliated with Oxford Nanopore Technologies, a company generating long read sequencing technologies. A.H. and J.L were employees of Bionano Genomics, a company developing optical maps for genome assembly. S. Selvaraj was an employee of Arima Genomics, a company developing Hi-C data for genome assemblies. R.D. is a scientific advisory board member of Dovetail Inc. P. Flicek is a member of the Scientific Advisory Boards of Fabric Genomics, Inc., and Eagle Genomics, Ltd. H.C. receives royalties from the sale of UCSC Genome Browser source code, LiftOver, GBiB, and GBiC licenses to commercial entities. S.K. has received travel funds to speak at symposia organized by Oxford Nanopore. M.D. and L.N. receive royalties from licensing of UCSC Genome Browser. For W.E.J., the content here is not to be construed as the views of the DA or DOD. All other authors declare no competing interests.

Figures

Fig. 1
Fig. 1. Comparative analyses of Anna’s hummingbird genome assemblies with various data types.
a, Contig NG50 values of the primary pseudo-haplotype. b, Scaffold NG50 values. c, Number of joins (gaps). d, Number of mis-join errors compared with the curated assembly. The curated assembly has no remaining conflicts with the raw data and thus no known mis-joins. *Same as CLR + linked + Opt. + Hi-C, but with contigs generated with an updated FALCON version and earlier Hi-C Salsa version (v2.0 versus v2.2; Supplementary Table 2) for less aggressive contig joining. e, f, Hi-C interaction heat maps before and after manual curation, which identified 34 chromosomes. Grid lines indicate scaffold boundaries. Red arrow, example mis-join that was corrected during curation. g, Karyotype of the identified chromosomes (n = 36 + ZW), consistent with previous findings. h, Correlation between estimated chromosome sizes (in Mb) based on karyotype images in g and assembled scaffolds in Supplementary Table 4 (bCalAna1) on a log–log scale. v1.0, VGP assembly v1.0 pipeline; linked, 10X Genomics linked reads; Hi-C, Hi-C proximity ligation; 1D, 2D, Oxford Nanopore long reads; NRGene, NRGene paired-end Illumina reads; SR, paired-end Illumina short reads.
Fig. 2
Fig. 2. Impact of repeats and heterozygosity on assembly quality.
a, Correlation between scaffold NG50 and genome size of the curated assemblies. b, Nonlinear correlation between contig NG50 and repeat content, before and after curation. c, Correlation between number of gaps per Gb assembled and repeat content. d, Correlation between primary assembly size relative to estimated genome size (y axis) and genome heterozygosity (x axis), before and after purging of false duplications. Assembly sizes above 100% indicate the presence of false duplications and those below 100% indicate collapsed repeats. e, f, Correlations between genome duplication rate using k-mers (e) and conserved BUSCO vertebrate gene set (f), and genome heterozygosity before and after purging of false duplications. g, h, As in e, f, but with whole-genome repeat content before and after purging of false duplications. Genome size, heterozygosity, and repeat content were estimated from 31-mer counts using GenomeScope, except for the channel bull blenny, as the estimates were unreliable (see Methods). Repeat content was measured by modelling the k-mer multiplicity from sequencing reads. Sequence duplication rates were estimated with Merqury using 21-mers. *P < 0.05; **P < 0.01; ***P < 0.001, of the correlation coefficient: P values and adjusted r2 from F-statistics. n = 17 assemblies of 16 species.
Fig. 3
Fig. 3. Improvements to alignments and annotations in VGP assemblies relative to prior references.
a, b, Average percentage of RNA-seq transcriptome samples (a; n = 44, mean ± s.e.m.) and ATAC–seq genome reads (b; n = 12) that align to the previous and VGP zebra finch assemblies. Unique reads mapped to only one location in the assembly. Total is the sum of unique and multi-mapped reads. P values are from paired t-test. c, d, Total number of coding sequence (CDS) transcripts (full bar) and portion fully supported (inner bar) (c) and the number of RefSeq coding genes annotated as partial (d) in the previous and VGP assemblies using the same input data. eh, Examples of assembly and associated annotation errors in previous reference assemblies corrected in the new VGP assemblies. See main text for descriptions. i, Gene synteny around the VTR2C receptor in the platypus shows completely missing genes (NUDT16), truncated and duplicated ARHGAP4, and many gaps in the earlier Sanger-based assembly compared with the filled in and expanded gene lengths in the new VGP assembly. Assembly accessions are in Supplementary Table 19.
Fig. 4
Fig. 4. VGP assemblies reveal GC content patterns in protein-coding genes.
a, Average GC content (n = 14,000–18,000 annotated coding genes; Extended Data Table 2) in VGP assemblies (black) and the percentage of genes with missing sequence in the earlier references (red) based on a Cactus alignment, in 100-bp blocks, 2 kb on either side of all protein-coding genes (left and right), and for UTRs, exons, and introns (middle). b, Average GC content (mean ± s.d. for lineages with more than one species) of the six major vertebrate lineages sequenced, for 30 kb upstream and downstream (in 100-bp blocks, log scale; left and right) and of the UTR, exons, and introns (middle). c, d, Left, specialized expression (arrows) shown by in situ hybridization of DRD1B in the zebra finch striatum (c) and ER81 in the arcopallium (d), from Jarvis et al.; the cerebellum was removed from the ER81 image. Right, ATAC–seq profiles in the GC-rich promoter regions of these genes, showing each gene’s GC content (red is high), the ATAC–seq peaks in striatum (purple) or arcopallium (yellow) neurons, and portions of missing sequence (black) in the previous reference assembly (grey).
Fig. 5
Fig. 5. Chromosome evolution among bats and other vertebrates.
a, Chromosome synteny maps across the species sequenced based on BUSCO gene alignments. Chromosome sizes (bar lengths) are normalized to genome size, to make visualization easier. Genes (lines) are coloured according to the human chromosome to which they belong; those on human chromosome 6 are highlighted in blue and other chromosomes are in lighter shades. The cladogram is from the TimeTree database. b, Phylogenetic relationship of the mammalian species sequenced and their inferred chromosome EBR rates (breaks per Myr) on different branches. Red, higher rates than average (0.84); blue, lower than average. c, Summary of alignment, gene organization, and functional gene status surrounding a bat interchromosomal EBR involving the homologue of human chromosome 6. End of scaffold (S) or chromosome (Chr.) means that the breakpoint is located at a chromosome arm end; middle means that it is located within a scaffold or chromosome. Scale is relevant for human Chr. 6 only. Actual gene sizes in the non-human species may differ and were drawn to match the annotated human gene sizes for simplicity.
Extended Data Fig. 1
Extended Data Fig. 1. Assessment of completeness of the Anna’s hummingbird assembly.
a, b, Steps and NG50 continuity values of the VGP assembly pipeline that gave the highest quality assembly for Anna’s hummingbird (a) and Canada lynx (b) in this study. The specific steps are outlined further in Extended Data Fig. 2a, and Methods. c, Whole-genome alignment of CLR (red), linked reads (green), optical maps (blue), and Hi-C reads (purple) of the Anna’s hummingbird, along with telomere motif (TTAGGG and its reverse complement, yellow) and gaps (grey) using Asset software. For each data type, the first row shows the mapped coverage, and the second shows the number of counts of low coverage or signs of collapsed repeats. Larger chromosomal scaffolds (1–19) have fewer gaps and low coverage or collapsed regions compared with the micro chromosomes (20–33). Chromosomes 14, 15 and 19 of the Anna’s hummingbird were the most structurally reliable scaffolds, having only one gap each with no low-support regions. We defined reliable blocks as those supported by at least two technologies. Reliable blocks excluded regions with structural assembly errors, such as collapsed repeats or unresolved segmental duplications. Low-support regions are those where the reliable blocks row has a peak.
Extended Data Fig. 2
Extended Data Fig. 2. VGP assembly pipeline applied across multiple species.
a, Iterative assembly pipeline of sequence data types (coloured as in b) with increasing chromosomal distance. Thin bars, sequence reads; thick black bars, assembled contigs; black bars with space and arcing links, scaffolds; grey bars, gaps placed by previous steps; thick red border, tracking of an example contig in the pipeline. The curation step shows an example of a mis-assembly break identified by sequence coverage (grey, left) and an example of an inversion error (right) detected by the optical map. b, Intra-molecule length distribution of the four data types used to generate the assemblies of 16 vertebrate species, weighted by the fraction of bases in each length bin (log scaled). Molecule length above 1 kb was measured from read length for CLR, estimated molecule coverage for linked reads, raw molecule length for optical maps, and interaction distance for Hi-C reads. For each species, the fragment length distribution of each data type was similar to those for the Anna’s hummingbird, with differences primarily influenced by tissue type, preservation method, and collection or storage conditions (unpublished data).
Extended Data Fig. 3
Extended Data Fig. 3. Flow charts of assembly pipelines used to generate high-quality assemblies in this study.
a, Standard VGP assembly pipeline when sequencing data of one individual, that generated the highest quality assemblies: generate primary pseudo-haplotype and alternate haplotype contigs with CLR using FALCON-Unzip; generate scaffolds with linked reads using Scaff10x; break mis-joins and further scaffold with optical maps using Solve; generate chromosome-scale scaffolds with Hi-C reads using Salsa2; fill in gaps and polish base-errors with CLR using Arrow (Pacific BioSciences); perform two or more rounds of short-read polishing with linked reads using FreeBayes; and perform expert manual curation to correct potential assembly errors using gEVAL, b, Standard VGP trio assembly pipeline when DNA is available for a child and parents. Dashed line indicates that the other haplotype went through the same steps before curation. In addition to the curated assemblies of both haplotypes, a representative haplotype with both sex chromosomes is submitted. c, Mitochondrial assembly pipeline. Figure key applies to ac. Steps newly introduced in v1.5–v1.6 are highlighted in light blue. c, contigs; p, purged false duplications from primary contigs; q, purged alternate contigs; s, scaffolds; t, polished scaffolds. Further details and instructions are available elsewhere and at https://github.com/VGP/vgp-assembly.
Extended Data Fig. 4
Extended Data Fig. 4. Relationship between collapses and genomic characteristics.
a, Correlation between the total number of collapses and percentage repeat content estimated in the submitted curated versions of n = 17 genomes from 16 species. b, Correlation between total number of bases in collapsed regions per Gb and repeat content. c, Correlation between total missing bases collapsed per Gb and repeat content. d, Correlation between total number of genes (coding and non-coding) in the collapsed regions and repeat content. e, Lack of correlation between the average collapsed size and repeat content. f, Lack of correlation between the total number of collapses and percentage heterozygosity. g, Lack of correlation between the total number of collapses per Gb and genome size. Genome size, heterozygosity, and repeat content were estimated from 31-mer counts using GenomeScope. Reported are adjusted r2 and P values from F-statistics. h, Cumulative collapsed bases per Gb in each collapse and percentage repeat masked. Each circle is coloured by species with its size relative to the length of the collapse as it appears in the assembly. Collapses above the horizontal bar (>90%) are further classified as collapsed high-copy repeats, and those below the horizontal bar are classified as segmental duplications (low-copy repeats). i, Major repeat types in collapsed high-copy repeats. Most of the repeats were masked only with WindowMasker, with no annotation available by RepeatMasker. j, Minor repeat types in collapsed repeats. This is a breakdown of the repeats categorized as ‘Others’ in i, owing to the smaller scale. Bar colours in i and j are as in h. Note smaller scale in j compared with i. Collapsed satellite arrays were almost exclusively found in the platypus, comprising ~2.5 Mb. Collapsed simple repeats were the major source in the thorny skate (~400 kb). There was a higher proportion of LTRs in birds, LINEs and SINEs in mammals, and DNA repeats in the amphibian. Among the genes in the collapses, many were repetitive short non-coding RNAs. P values from F-statistics.
Extended Data Fig. 5
Extended Data Fig. 5. False duplication mechanisms in genome assembly.
a, False heterotype (haplotype) duplications occurs when more divergent sequence reads from each haplotype A (blue) and B (red) (maternal and paternal) form greater divergent paths in the assembly graph (bubbles), while nearly identical homozygous sequences (black) become collapsed. When the assembly graph is properly formed and correctly resolved (green arrow), one of the haplotype-specific paths (red or blue) is chosen for building a ‘primary’ pseudo-haplotype assembly and the other is set apart as an ‘alternate’ assembly. When the graph is not correctly resolved (purple arrow), one of four types of pattern are formed in the contigs and subsequent scaffolds. Depending on the supporting evidence, the scaffolder either keeps these haplotype contigs on separate scaffolds or brings them together on the same scaffold, often separated by gaps: 1. Separate contigs: both contigs are retained in the primary contig set, an error often observed when haplotype-specific sequences are highly diverged. 2. Flanking contigs: the assembly graph is partially formed, connecting the homozygous sequence of the 5′ side to one haplotype (blue) and the 3′ side to the other haplotype (red). 3. Partial flanking contigs: only one haplotype (blue) flanks one side of the homozygous sequence. 4. Failed connecting of contigs: all haplotype sequences fail to properly connect to flanking homozygous sequences. b, False homotype duplications occur where a sequence from the same genomic locus is duplicated, and are of two types: 1. Overlapping sequences at contig boundaries: in current overlap-layout-consensus assemblers, branching sequences in assembly graphs that are not selected as the primary path have a small overlapping sequence (purple), dovetailing to the primary path where it originated a branch. The size of the duplicated sequence is often the length of a corrected read. Subsequent scaffolding results in tandem duplicated sequences with a gap between. 2. Under-collapsed sequences: sequencing errors in reads (red x) randomly or systematically pile up, forming under-collapsed sequences. Subsequent duplication errors in the scaffolding are similar to the heterotype duplications. Purge_haplotigs align sequences to themselves to find a smaller sequence that aligns fully to a larger contig or scaffold, and removes heterotype duplication types 1, 3, and 4. Purge_dups additionally uses coverage information to detect heterotype duplication type 2 and homotype duplications. We distinguished the two types of duplications by: 1) haplotype-specific variants in reads aligning at half coverage to each heterotype duplication; 2) differing consensus quality that resulted from read coverage fluctuations when aligning reads to homotype duplications; and 3) k-mer copy number anomalies in which homotype duplications were observed in the assembly with more than the expected number of copies.
Extended Data Fig. 6
Extended Data Fig. 6. False duplication examples fixed during manual curation.
a, An example of a heterotype duplication in the female zebra finch, non-trio assembly. Left, a self-dot plot of this region generated with Gepard, with sequences coloured by haplotypes. Gaps, duplicated sequences (green and purple), and haplotype-specific marker densities are indicated at the top. Right, a detailed alignment view of the green haplotype duplication with paternal and maternal markers, self-alignment components, transcripts annotated, contigs, bionano maps, and repeat components displayed in gEVAL. b, Example of a homotype duplication found in the hummingbird assembly. These were caused by an algorithm bug in FALCON, which was later fixed. c, Example of a combined duplication involving both heterotype (green) and homotype (orange) duplications. Assembly graph structure is shown on the left for clarity, highlighting the overlapping sites at the contig boundary shaded following the duplication type. Assembly errors including the above false duplications were detected and fixed during the curation process.
Extended Data Fig. 7
Extended Data Fig. 7. Evidence of near-complete chromosome scaffolds in the VGP assemblies.
Shown are Hi-C interaction heat maps for each species after curation, visualized with PretextView. A scaffold is considered a putative arm-to-arm chromosome when all Hi-C read pairs in a row and column map to a square (that is, an assembled chromosome) on the diagonal without any other interactions off the diagonal. Those with remaining off-diagonal matches to smaller scaffolds are not linked because of ambiguous order or orientation, and are instead submitted as ‘unlocalized’ belonging to the relevant chromosome. Bands at the top of each heat map show scaffolds identified as X, Z (blue) or Y, W (red) sex chromosomes. The Hi-C map of fAstCal1 is not included as we had no remaining tissue left of the animal used to generate Hi-C reads.
Extended Data Fig. 8
Extended Data Fig. 8. Comparison of chromosomal organization between previous and new VGP assemblies.
a, Zebra finch male compared to a previous reference assembly of the same animal. b, Platypus male compared with a previous reference female assembly (so the Y chromosomes are absent in the previous reference). c, Hummingbird female compared to a previous reference of the same animal. d, Climbing perch compared to a previous reference. Each row represents a VGP-generated chromosome for the target species. Colours depict identity with the reference (see key to the right); more than one colour indicates reorganization in the VGP assembly relative to the reference. The lines within each block depict orientation relative to the reference; a positive slope is the same orientation as the reference, whereas a negative slope is the inverse orientation. Gaps are white boxes with no lines, in the reference relative to the VGP assembly. A white box for the entire chromosome means a newly identified chromosome in the VGP assembly. Top 20 is the longest 20 scaffolds of the hummingbird and climbing perch assemblies. Accession numbers of the assemblies compared are listed in Supplementary Table 19.
Extended Data Fig. 9
Extended Data Fig. 9. Haplotype-resolved sex chromosomes and mitochondrial genomes.
a, Alignment scatterplot, generated with MUMmer NUCmer, visualized with dot, of maternal and paternal chromosomes from the female zebra finch trio-based assembly. Blue, same orientation; red, inversion; orange, repeats between haplotypes. The paternal Z chromosome is highly divergent from the maternal W, and thus mostly unaligned. b, Alignment scatterplot of assembled Z and W chromosomes across the three bird species, approximated with MashMap2. Segments of 300 kb (green), 500 kb (blue), and 1 Mb (purple) are shaded darker with higher sequence identity, with a minimum of 85%. The smaller size and higher repeat content of the W chromosome are clearly visible. c, X and Y chromosome segments of the mammals (platypus, Canada lynx, pale spear-nosed bat, and greater horseshoe bat) showing a higher density of repeats within the mammalian X chromosome than the avian Z chromosome. d, VGP kākāpō mitochondrial genome assembly reveals previously missing repetitive sequences (adding 2,232 bp) in the origin of replication region, containing an 83-bp repeat unit. e, VGP climbing perch mitochondrial genome assembly showing a duplication of trnL2 and partial duplication of Nad1, which were absent from the prior reference. Orange arrows and red lines, tRNA genes and their alignments; dark grey arrows and grey shading, all other genes and their alignments; black, non-coding regions; green line, conventional starting point of the circular sequence.
Extended Data Fig. 10
Extended Data Fig. 10. Large haplotype inversions with direct evidence in the zebra finch trio assembly.
a, Two inversions (green and red) in chromosome 5 found from the MUMmer NUCmer alignment of the maternal and paternal haplotype assemblies, visualized with dot. b, Hi-C interaction plot showing that the trio-binned Hi-C data remove most of the interactions from the other haplotype (red arrows), which could be erroneously classified as a mis-assembly if only one haplotype was used as a reference. c, An 8.5-Mb inversion found on chromosome 11 and a complicated 8.1-Mb rearrangement on chromosome 13 between maternal and paternal haplotypes. d, No mis-assembly signals were detected from the binned Hi-C interaction plots, indicating that the haplotype-specific inversions are real. e, Half the PacBio CLR span and Bionano optical maps agree with the inversion breakpoints in chromosome 11, supporting the haplotype-specific inversion.
Extended Data Fig. 11
Extended Data Fig. 11. Polishing artefacts.
a, An example of uneven mapping coverage in the primary and alternate sequence pair of the Anna’s hummingbird assembly. In this example, the alternate (alt) sequence was built at higher quality, attracting all linked-reads for polishing. The matching locus in the primary (pri) assembly was left unpolished, resulting in frameshift errors in the TLK1 gene. b, Haplotype-specific markers (red for maternal, blue for paternal) and error markers found in the assembly on the Z chromosome (inherited from the paternal side) of the trio-binned female zebra finch assembly. Each row shows markers before short-read polishing, mapping all reads to both haplotype assemblies, and polishing by mapping paternally binned reads to the paternal assembly. Polishing improves QV, but introduces haplotype switch errors when using reads from both haplotypes as shown in row 2. This can be avoided when using haplotype binned reads for polishing. c, Example of over-polishing. The nuclear mitochondria (NuMT) sequence was transformed as a full mitochondria (MT) sequence during long-read polishing owing to the absence of the MT contig, where the NuMT attracted all long reads from the MT. In comparison, the trio-binned assembly had the MT sequence assembled in place, preventing mis-placing of MT reads during read mapping.
Extended Data Fig. 12
Extended Data Fig. 12. Chromosome evolution among the bat species sequenced.
a, Genes surrounding an inversion in the greater horseshoe bat, relative to human chromosome 15 (red highlight). The STARD5 gene is directly disrupted by this inversion, which separates exons 1–5 from exon 6 in the greater horseshoe bat. b, RNA-seq tracks showing the lack of RNA splicing evidence of STARD5 transcripts in the greater horseshoe bat (bottom) in comparison to the pale spear-nosed bat where the STARD5 gene is not disrupted (top). c, Circos plots of chromosome organization relationships between the each of the analysed bats and segments of the human chromosomes 1, 2, 6 and 10. Red star, breakpoint location in human chromosome 6, depicting the fission of the boreoeutherian chromosome 5 in the bat ancestor; blue star, the region upstream of the breakpoint in the bats; green star, the region downstream of the breakpoint in the bats. The red starred breakpoint was confirmed as reused, as opposed to assembly errors, in chromosomal rearrangements of the pale spear-nosed bat, Egyptian fruit bat, and greater horseshoe bat. There is no evidence of reuse for the velvety free-tailed bat. We could not confirm breakpoint reuse in the greater mouse-eared bat or Kuhl’s pipistrelle at the chromosomal scale because they were on small scaffolds that may not be completely assembled.

Comment in

  • Assembling vertebrate genomes.
    Wrighton KH. Wrighton KH. Nat Rev Genet. 2021 Jul;22(7):413. doi: 10.1038/s41576-021-00379-z. Nat Rev Genet. 2021. PMID: 34017104 No abstract available.

Similar articles

Cited by

  • The genome sequence of a bluebottle fly, Calliphora vicina (Linnaeus, 1758).
    Sivell O; Natural History Museum Genome Acquisition Lab; Darwin Tree of Life Barcoding collective; Wellcome Sanger Institute Tree of Life Management, Samples and Laboratory team; Wellcome Sanger Institute Scientific Operations: Sequencing Operations; Wellcome Sanger Institute Tree of Life Core Informatics team; Tree of Life Core Informatics collective; Darwin Tree of Life Consortium. Sivell O, et al. Wellcome Open Res. 2024 Jun 24;9:335. doi: 10.12688/wellcomeopenres.22469.1. eCollection 2024. Wellcome Open Res. 2024. PMID: 39473873 Free PMC article.
  • The genome sequence of the Brindled Ochre moth, Dasypolia templi (Thunberg, 1792).
    Griffiths A; Wellcome Sanger Institute Tree of Life Management, Samples and Laboratory team; Wellcome Sanger Institute Scientific Operations: Sequencing Operations; Wellcome Sanger Institute Tree of Life Core Informatics team; Tree of Life Core Informatics collective; Darwin Tree of Life Consortium. Griffiths A, et al. Wellcome Open Res. 2024 Sep 20;9:542. doi: 10.12688/wellcomeopenres.23054.1. eCollection 2024. Wellcome Open Res. 2024. PMID: 39484641 Free PMC article.
  • The genome sequence of the Currant Clearwing moth, Synanthedon tipuliformis (Clerck, 1759).
    Boyes D, Holland PWH; University of Oxford and Wytham Woods Genome Acquisition Lab; Darwin Tree of Life Barcoding collective; Wellcome Sanger Institute Tree of Life programme; Wellcome Sanger Institute Scientific Operations: DNA Pipelines collective; Tree of Life Core Informatics collective; Darwin Tree of Life Consortium. Boyes D, et al. Wellcome Open Res. 2024 Oct 11;8:300. doi: 10.12688/wellcomeopenres.19647.2. eCollection 2023. Wellcome Open Res. 2024. PMID: 39449983 Free PMC article.
  • Squalomix: shark and ray genome analysis consortium and its data sharing platform.
    Nishimura O, Rozewicki J, Yamaguchi K, Tatsumi K, Ohishi Y, Ohta T, Yagura M, Niwa T, Tanegashima C, Teramura A, Hirase S, Kawaguchi A, Tan M, D'Aniello S, Castro F, Machado A, Koyanagi M, Terakita A, Misawa R, Horie M, Kawasaki J, Asahida T, Yamaguchi A, Murakumo K, Matsumoto R, Irisarri I, Miyamoto N, Toyoda A, Tanaka S, Sakamoto T, Semba Y, Yamauchi S, Yamada K, Nishida K, Kiyatake I, Sato K, Hyodo S, Kadota M, Uno Y, Kuraku S. Nishimura O, et al. F1000Res. 2022 Sep 21;11:1077. doi: 10.12688/f1000research.123591.1. eCollection 2022. F1000Res. 2022. PMID: 36262334 Free PMC article.
  • The genome sequence of the Brown Litter Worm, Bimastos eiseni (Levinsen, 1884).
    Brown KD, Sherlock E, Crowley LM; University of Oxford and Wytham Woods Genome Acquisition Lab; Darwin Tree of Life Barcoding collective; Wellcome Sanger Institute Tree of Life Management, Samples and Laboratory team; Wellcome Sanger Institute Scientific Operations: Sequencing Operations; Wellcome Sanger Institute Tree of Life Core Informatics team; Tree of Life Core Informatics collective; Darwin Tree of Life Consortium. Brown KD, et al. Wellcome Open Res. 2024 May 20;9:279. doi: 10.12688/wellcomeopenres.21622.1. eCollection 2024. Wellcome Open Res. 2024. PMID: 39296368 Free PMC article.

References

    1. International Human Genome Sequencing Consortium Initial sequencing and analysis of the human genome. Nature. 2001;409:860–921. - PubMed
    1. Sulston J, et al. The C. elegans genome sequencing project: a beginning. Nature. 1992;356:37–41. - PubMed
    1. Mouse Genome Sequencing Consortium Initial sequencing and comparative analysis of the mouse genome. Nature. 2002;420:520–562. - PubMed
    1. Howe K, et al. The zebrafish reference genome sequence and its relationship to the human genome. Nature. 2013;496:498–503. - PMC - PubMed
    1. Genome 10K Community of Scientists Genome 10K: a proposal to obtain whole-genome sequence for 10,000 vertebrate species. J. Hered. 2009;100:659–674. - PMC - PubMed

Publication types