. 2021 Apr;592(7856):704-707.
doi: 10.1038/s41586-021-03394-6. Epub 2021 Apr 28.

X-ray quasi-periodic eruptions from two previously quiescent galaxies

Affiliations

X-ray quasi-periodic eruptions from two previously quiescent galaxies

R Arcodia et al. Nature. 2021 Apr.

Abstract

Quasi-periodic eruptions (QPEs) are very-high-amplitude bursts of X-ray radiation recurring every few hours and originating near the central supermassive black holes of galactic nuclei1,2. It is currently unknown what triggers these events, how long they last and how they are connected to the physical properties of the inner accretion flows. Previously, only two such sources were known, found either serendipitously or in archival data1,2, with emission lines in their optical spectra classifying their nuclei as hosting an actively accreting supermassive black hole3,4. Here we report observations of QPEs in two further galaxies, obtained with a blind and systematic search of half of the X-ray sky. The optical spectra of these galaxies show no signature of black hole activity, indicating that a pre-existing accretion flow that is typical of active galactic nuclei is not required to trigger these events. Indeed, the periods, amplitudes and profiles of the QPEs reported here are inconsistent with current models that invoke radiation-pressure-driven instabilities in the accretion disk5-9. Instead, QPEs might be driven by an orbiting compact object. Furthermore, their observed properties require the mass of the secondary object to be much smaller than that of the main body10, and future X-ray observations may constrain possible changes in their period owing to orbital evolution. This model could make QPEs a viable candidate for the electromagnetic counterparts of so-called extreme-mass-ratio inspirals11-13, with considerable implications for multi-messenger astrophysics and cosmology14,15.


Conflict of interest statement

The authors declare no competing interests.

Figures

Fig. 1
Fig. 1. The first eROSITA QPE.
a, eROSITA light curve in the 0.2–0.6-keV and 0.6–2.3-keV energy bands (circles and squares, respectively), with red and orange highlighting faint and bright observations, respectively. The start of the light curve teRO,0 is approximately MJD 58864.843 (MJD, modified Julian date), observed during the first eROSITA all-sky survey (eRASS1). b, eROSITA X-ray spectra of the bright and faint states in orange and red, as in a. c, Background-subtracted XMM-Newton X-ray light curves with 500-s bins for the European Photon Imaging Camera (EPIC) instruments: EPIC-pn (dark grey), MOS1 (green) and MOS2 (red) in the energy band shown in the legend. The beginning of both observations was contaminated by flares in the background and excluded; the dark grey solid line and contours show the underlying ≤1-keV EPIC-pn light curve to give a zeroth-order extrapolation of the rate, excluding the presence of obvious soft X-ray eruptions. tXMM,0 corresponds to the start of the cleaned MOS2 exposure in the first observation, approximately MJD 59057.805. XMM-Newton optical and UV fluxes are shown in the lower panels (units of erg cm−2 s−1, where Fλ is the spectral flux density and λ is the wavelength in angstroms), with non-detections shown as upper limits. d, Background-subtracted NICER-XTI light curve. The mean (and dispersion-on) rise-to-decay duration is approximately 7.6 h (~1.0 h) and the peak-to-peak separation is approximately 18.5 h (~2.7 h). All uncertainties are 1σ, shown as error bars or shaded regions.
Fig. 2
Fig. 2. The second eROSITA QPE.
a, b, As in Fig. 1a, b, for eRO-QPE2. The start of the eROSITA light curve is approximately MJD 59023.191. c, As in Fig. 1c, for the XMM-Newton observation of eRO-QPE2. tXMM,1 corresponds to the start of the cleaned MOS1 exposure, approximately MJD 59067.846. The mean (and related dispersion) of the rise-to-decay duration is about 27 min (~3 min), with a peak-to-peak separation of approximately 2.4 h (~5 min). All uncertainties are 1σ, shown as error bars or shaded regions.
Fig. 3
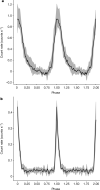
Fig. 3. Phase-folded light curves.
a, b, Median light curve profile (with related 16th and 84th percentile contours) for eRO-QPE1 (a) and eRO-QPE2 (b), folded at the eruption peaks (see Methods).
Extended Data Fig. 1
Extended Data Fig. 1. eRO-QPE1 position and identification.
a, Legacy DR8 image cut-out around the optical counterpart of eRO-QPE1. Red and green circles represent the astrometry-corrected eROSITA and XMM-Newton EPIC-pn positions, respectively, with 1σ positional uncertainties. The EPIC-pn position was corrected excluding the target (blue cross) to ensure an unbiased estimate of the possible positional offset. Image reproduced from Legacy Surveys / D. Lang (Perimeter Institute) under a CC-BY-4.0 licence. b, SALT spectra of eRO-QPE1 shown in black and blue with related 1σ errors as shaded regions. The cyan spectrum represents a re-normalized sky spectrum to guide the eye for the residual sky feature around 5,577 Å.
Extended Data Fig. 2
Extended Data Fig. 2. eRO-QPE2 position and identification.
As in Extended Data Fig. 1, for eRO-QPE2. Green pixels in a are artefacts or missing data in the optical image. Image in a reproduced from Legacy Surveys / D. Lang (Perimeter Institute) under a CC-BY-4.0 licence.
Extended Data Fig. 3
Extended Data Fig. 3. eRO-QPE1 spectral fit results.
XMM-Newton EPIC-pn light-curve (top panel) and time-resolved spectroscopy fit results for spectra extracted in the 500-s time bins (bottom panels) of the two XMM-Newton observations of eRO-QPE1 (left, XMM1; right, XMM2) using an accretion disk model (diskbb): in particular, the evolution of the peak accretion disk temperature (Tin, k = kB) and the normalization (norm), which is proportional to the inner radius once distance and inclination are known. The time evolution of the 0.5–2.0-keV flux (F0.5–2.0keV) and luminosity (L0.5–2.0keV) is also shown in the bottom panel. The quiescence level is fitted by combining the first part of both XMM-Newton observations. It is shown with a dashed line because, due to low counts, the fit is more uncertain (see Extended Data Fig. 5a). Median fit values and fluxes of the high and low eROSITA states are reported with orange and red arrows pointing left (upper limits (UL) are denoted with diagonal arrows). 1σ uncertainties on the fit results are shown with shaded regions around the median.
Extended Data Fig. 4
Extended Data Fig. 4. eRO-QPE2 spectral fit results.
As in Extended Data Fig. 3, for eRO-QPE2. Here the eROSITA upper limit (UL) of the low state is reported at 3σ.
Extended Data Fig. 5
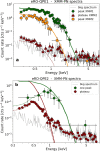
Extended Data Fig. 5. eRO-QPE1 and eRO-QPE2 spectra.
a, XMM-Newton EPIC-pn source plus background (bkg) spectra for eRO-QPE1. Red, orange and green data correspond to quiescence and to the peak of the second and first XMM-Newton observations, respectively, with error bars showing 1σ uncertainties. The related solid lines show the unabsorbed source model obtained with diskbb, just for visualization. The grey line represents the background spectrum alone. The plateau is shown with a dotted line because, due to low counts, the fit is more uncertain. b, As in a, for eRO-QPE2. Here green data represent one of the peaks and the additional dashed lines indicate the absorbed source model.
Extended Data Fig. 6
Extended Data Fig. 6. The properties of the host galaxies of the QPEs.
Stellar mass M⁎ and star-formation rate (SFR) for eRO-QPE1 (blue) and eRO-QPE2 (red), with related 1σ uncertainties; for eRO-QPE1, SFR is largely unconstrained (see Methods section ‘The host galaxies of the QPEs’). For a comparison, normal galaxies, TDEs and CLAGN, all below z < 0.1, are also shown.
Extended Data Fig. 7
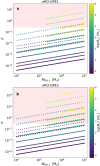
Extended Data Fig. 7. Constraints on a secondary orbiting body.
a, Allowed parameter space in terms of the derivative of the period P˙ and secondary mass M2 for a range of primary mass MBH,1 ≈ 104M–107M and zero (solid lines) or high orbital eccentricity (eO ≈ 0.9, dotted lines), in which we can reproduce the rest-frame period of eRO-QPE1. We have additionally imposed M2 ≤ MBH,1. We have drawn an approximate threshold at the minimum value of P˙ which we would have measured within the available observations, corresponding to a period decrease of one QPE cycle over the 15 observed by NICER (Fig. 1d). The excluded region is shaded in red. b, As in a, for eRO-QPE2, and adopting as tentative minimum P˙ a period decrease of one cycle over the nine observed with XMM-Newton (Fig. 2c).

References

    1. Miniutti G, et al. Nine-hour X-ray quasi-periodic eruptions from a low-mass black hole galactic nucleus. Nature. 2019;573:381–384. doi: 10.1038/s41586-019-1556-x. - DOI - PubMed
    1. Giustini M, Miniutti G, Saxton R. X-ray quasi-periodic eruptions from the galactic nucleus of RX J1301.9+2747. Astron. Astrophys. 2020;636:L2. doi: 10.1051/0004-6361/202037610. - DOI
    1. Miniutti G, et al. A high Eddington-ratio, true Seyfert 2 galaxy candidate: implications for broad-line region models. Mon. Not. R. Astron. Soc. 2013;433:1764–1777. doi: 10.1093/mnras/stt850. - DOI
    1. Sun L, Shu XW, Wang TRX. J1301.9+2747: a highly variable Seyfert galaxy with extremely soft X-ray emission. Astrophys. J. 2013;768:167. doi: 10.1088/0004-637X/768/2/167. - DOI
    1. Merloni A, Nayakshin S. On the limit-cycle instability in magnetized accretion discs. Mon. Not. R. Astron. Soc. 2006;372:728–734. doi: 10.1111/j.1365-2966.2006.10889.x. - DOI

Publication types

LinkOut - more resources