. 2021 Jun;594(7864):594-598.
doi: 10.1038/s41586-021-03507-1. Epub 2021 Apr 28.

Structural basis of GABAB receptor-Gi protein coupling

Affiliations

Structural basis of GABAB receptor-Gi protein coupling

Cangsong Shen et al. Nature. 2021 Jun.

Abstract

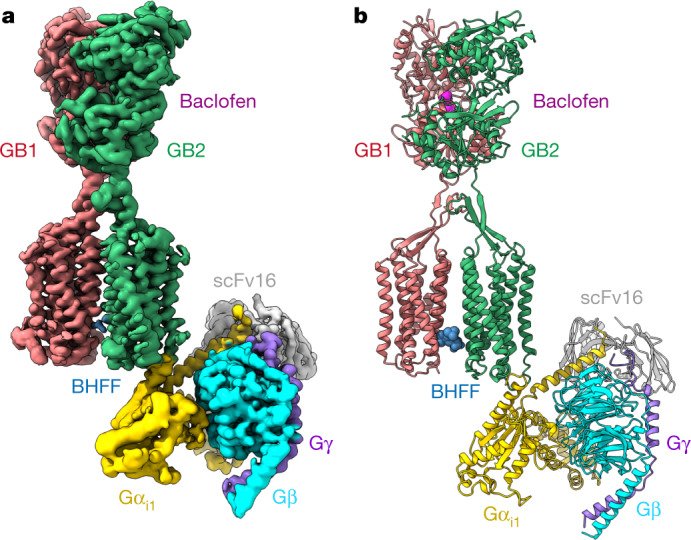
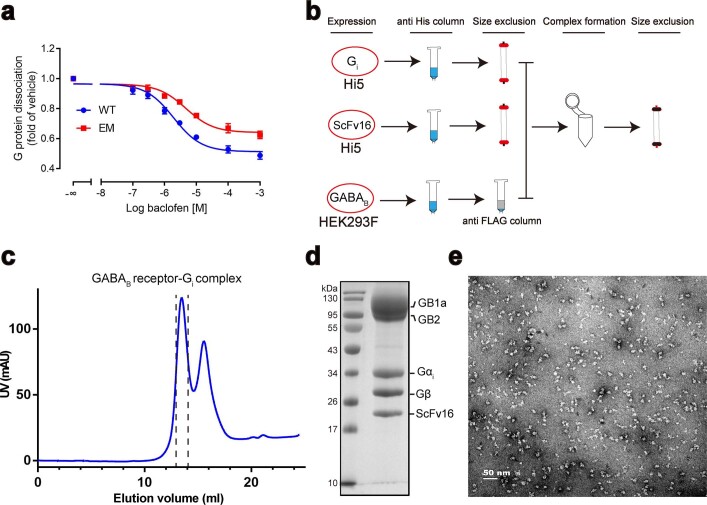
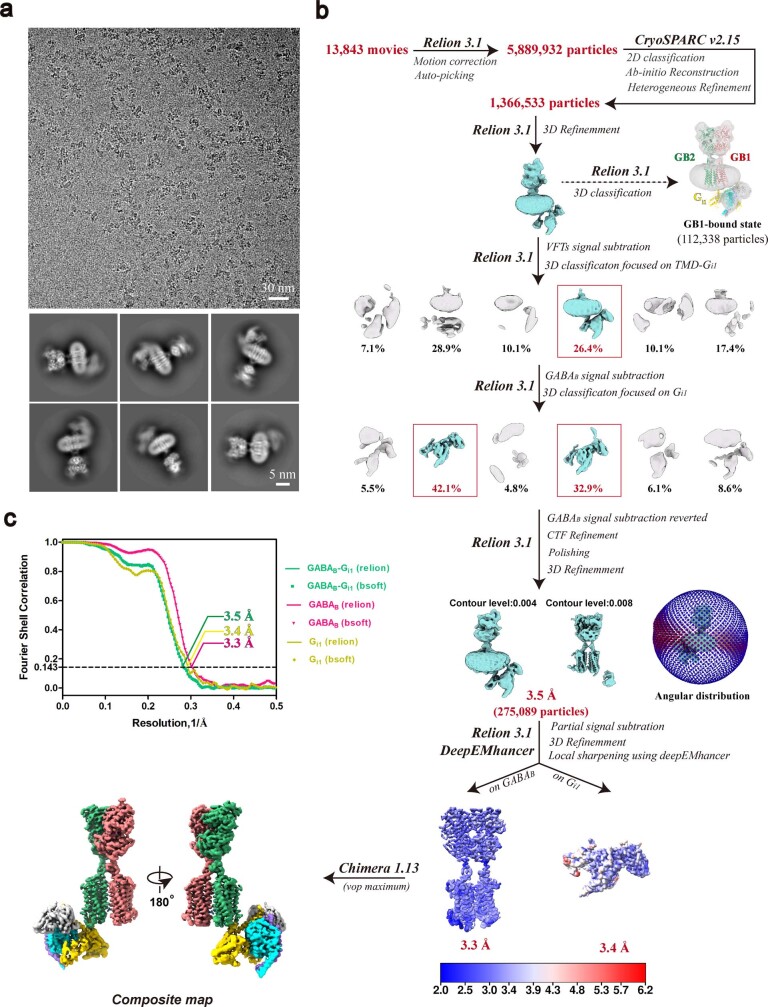
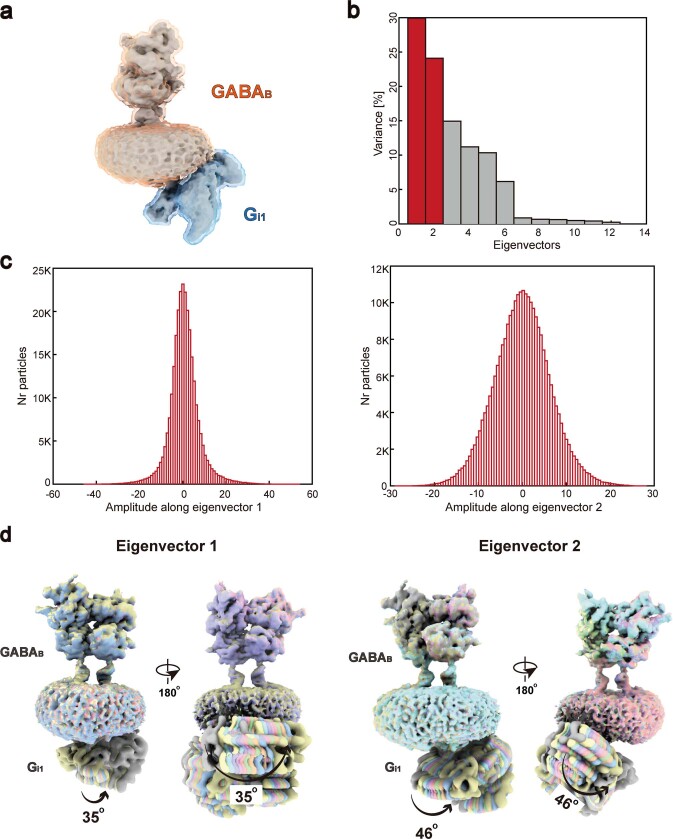
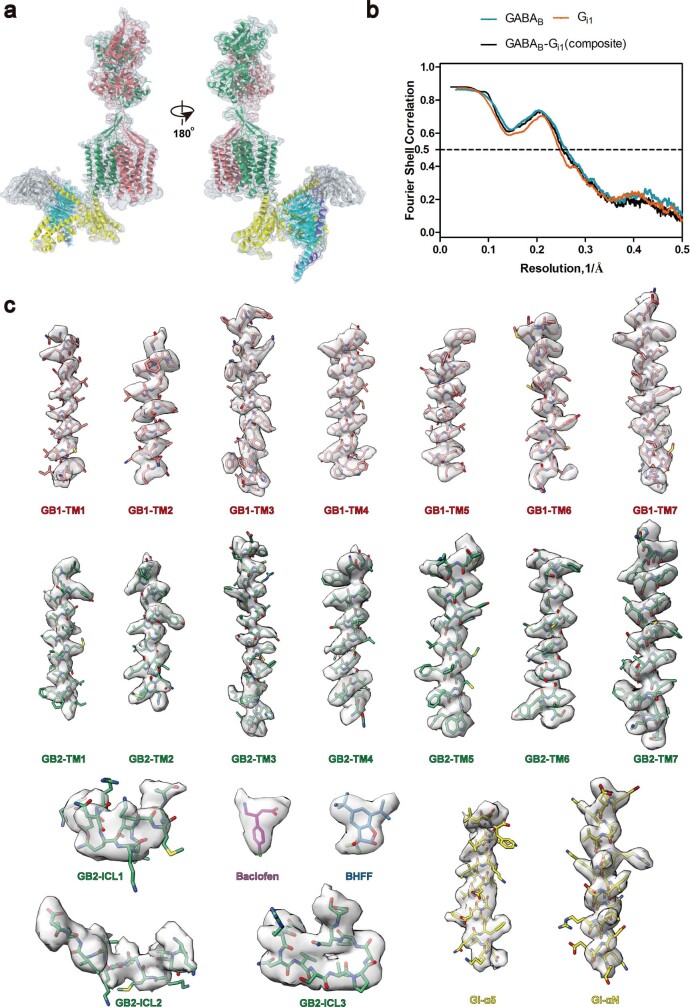
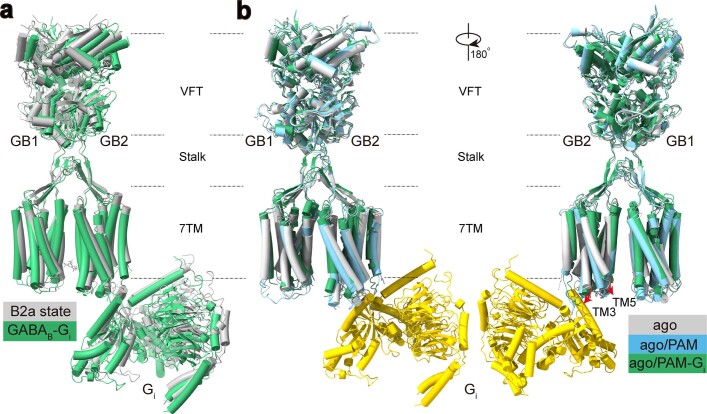
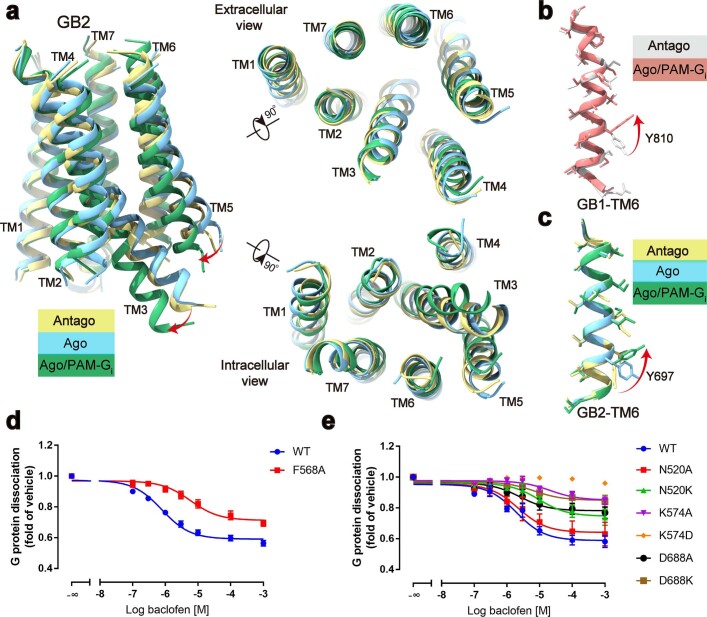
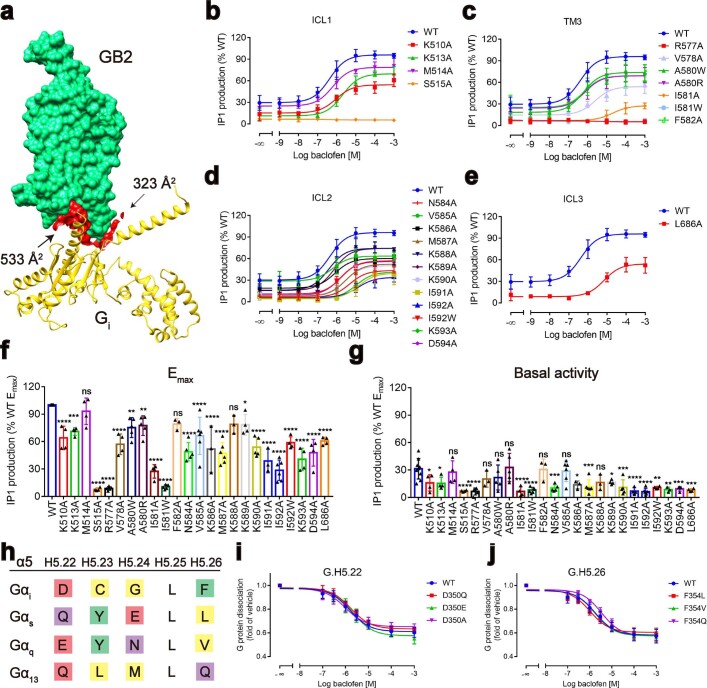
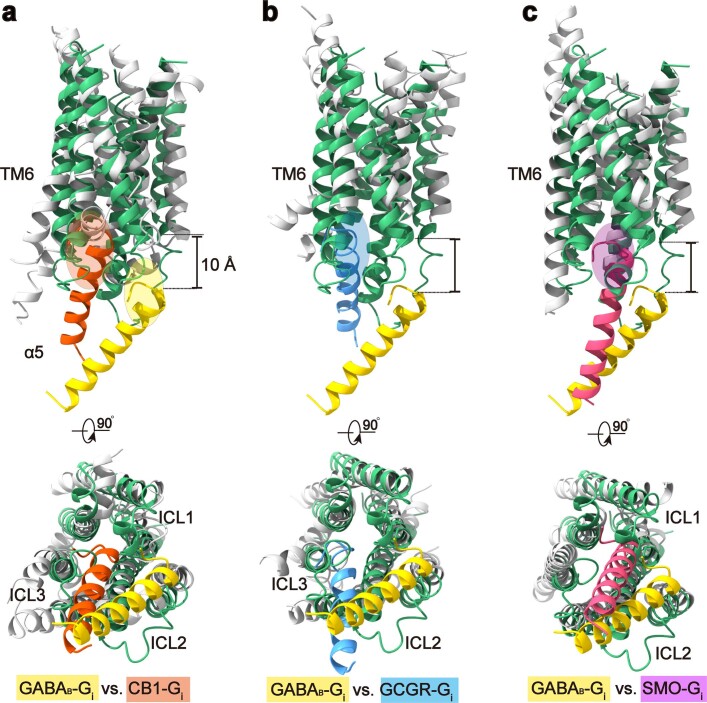
G-protein-coupled receptors (GPCRs) have central roles in intercellular communication1,2. Structural studies have revealed how GPCRs can activate G proteins. However, whether this mechanism is conserved among all classes of GPCR remains unknown. Here we report the structure of the class-C heterodimeric GABAB receptor, which is activated by the inhibitory transmitter GABA, in its active form complexed with Gi1 protein. We found that a single G protein interacts with the GB2 subunit of the GABAB receptor at a site that mainly involves intracellular loop 2 on the side of the transmembrane domain. This is in contrast to the G protein binding in a central cavity, as has been observed with other classes of GPCR. This binding mode results from the active form of the transmembrane domain of this GABAB receptor being different from that of other GPCRs, as it shows no outside movement of transmembrane helix 6. Our work also provides details of the inter- and intra-subunit changes that link agonist binding to G-protein activation in this heterodimeric complex.


Conflict of interest statement

The authors declare no competing interests.

Figures

Fig. 1
Fig. 1. Cryo-EM structure of GABAB–Gi complex.
a, b, Cryo-EM map (a) and model (b) of the baclofen- and BHFF-bound GABAB–Gi1 complex.
Fig. 2
Fig. 2. Asymmetric activation of GABAB.
a, Side, extracellular, and intracellular views of the superposed structures of the agonist-bound (PDB 6UO9) and the agonist- and PAM-Gi-bound (agonist/PAM-bound) GABAB, aligned by the TMD of GB1. b, Conformational changes of the TMD of GB2 between antagonist-bound (PDB 7C7S) and agonist- and PAM–Gi-bound structure. c, Magnified views of the critical residue F568, the bulky side chain of which undergoes a substantial rotation upon activation and causes the TM3 shifting. d, Baclofen-induced IP1 accumulation of wild-type (WT) and F568A-mutant GABAB using the chimeric Gα protein Gαqi9. Data are mean ± s.e.m. from six independent experiments, performed in technical triplicate. e, Magnified views of the ‘ionic lock’ located in the cytoplasmic TMD of GB2. f, Baclofen-induced IP1 accumulation of wild-type GABAB and several forms of GABAB with substitutions in the ionic lock region using Gαqi9. Data are mean ± s.e.m. from at least three independent experiments, performed in technical triplicate. Source data
Fig. 3
Fig. 3. GABAB–Gi coupling and G-protein selectivity.
a, The Gi1 binding pocket in GABAB, which is mainly formed by three intracellular loops of GB2. GB2, green; Gαi1, yellow. b, c, Detailed interactions of the ICL2 and TM3 of GB2 with Gαi (b), and of ICL1 and ICL3 with Gαi (c). d, Baclofen-induced IP1 accumulation using Gαqi9. Bars represent differences in calculated Emax and basal activity or potency (pEC50) for each mutant as a percentage of the maximum in wild type. Data are mean ± s.e.m. from at least three independent experiments, performed in technical triplicate and analysed using one-way analysis of variance with Dunnett’s multiple comparison test to determine significance (compared with wild type). ND, not determined; NS, not significant. e, The CG.H5.23 and GG.H5.24 residues in the C-terminal α5 helix of Gαi are involved in the selective coupling between GABAB and Gi protein. The α5-helix structures of Gs (PDB 5VAI), Gq (PDB 6WHA) and the GABAB-bound Gi were aligned. f, g, Effect of CG.H5.23 (f) and GG.H5.24 (g) mutations in Gαi on GABAB–Gi coupling using NanoBiT G-protein dissociation assay. Data are mean ± s.e.m. from at least three independent experiments. Source data
Fig. 4
Fig. 4. Distinct Gi binding model of GABAB.
a, b, Orientations of the α5 helix in Gi protein when coupling to GABAB, cannabinoid receptor 1 (CB1) (class A), glucagon receptor (GCGR) (class B) and  smoothened (SMO) (class F). Structures were aligned by the TMDs; only the TMD of GB2 is shown, for clarity. GABAB-bound, yellow; CB1-bound α5, PDB 6N4B; GCGR-bound α5, PDB 6LML; SMO-bound α5, PDB 6OT0. c, Schematics of the two types of pocket that are involved in G-protein recognition. GABAB, green; monomeric GPCR, blue; Gi, yellow. d, Superposition of GABAB-bound Gil with the GDP-bound Gil. GDP-bound Gil, PDB 1GP2. e, Structural comparison of the GABAB-bound Gil with CB1-, GCGR- and SMO-bound Gil. G proteins are coloured as in a, b.
Extended Data Fig. 1
Extended Data Fig. 1. Purification of the GABAB–Gi1 complex.
a Pharmacology of wild-type GABAB and the purification construct (EM) in a baclofen-mediated NanoBiT-G-protein dissociation assay. Data are mean ± s.e.m. from four independent experiments, performed in technical triplicate. b, Flow chart of the purification steps for the GABAB–Gi1 complex. GABAB was expressed in HEK293F cells. Heterotrimeric Gi1 and scFv16 were expressed in Hi5 cells. ce, Size-exclusion chromatography profile (c), SDS–PAGE gel (d) and the negative-staining electron microscopy analysis (e) of the purified GABAB–Gi1 complex. Source data
Extended Data Fig. 2
Extended Data Fig. 2. Cryo-EM data processing of the GABAB–Gi complex.
a, Representative cryo-EM micrograph (from 13,483 movies) and 2D class averages (from 16 classes) of the GABAB–Gi1 complex. b, Flow chart of cryo-EM data processing. c, Gold-standard Fourier shell correlation curves of the globally refined GABAB–Gi1 complex and the locally refined GABAB and Gi1.
Extended Data Fig. 3
Extended Data Fig. 3. Flexibility analysis of GABAB–Gi1 coupling.
a, Multibody refinement and principal component analysis of the relative orientations of GABAB and Gi1. The GABAB–Gi1 consensus map and the body masks of GABAB and Gi1 are shown. b, Contribution of individual eigenvectors to the total variance in rotation and translation between GABAB and Gi1. The first and second eigenvectors explain more than 50% of the variance observed and are highlighted in red. c, Histograms of the amplitudes along the first and second eigenvectors. d, Motion represented by the first and second eigenvectors.
Extended Data Fig. 4
Extended Data Fig. 4. Analysis of the quality of the cryo-EM map.
a, Global fitting of the GABAB–Gil structure into the composite cryo-EM density map. b, Fourier shell correlation curves of the model versus the map. c, Cryo-EM densities and the fitted atomic models are shown. GB1 in red; GB2 in green; Gαi1 in yellow; baclofen in magenta; BHFF in blue.
Extended Data Fig. 5
Extended Data Fig. 5. Structural comparisons of the determined GABAB–Gi complex with the previously reported low-resolution B2a state GABAB–Gi complex, the agonist-bound, and the agonist- and PAM-bound GABAB.
a, Structural comparison between the low-resolution GABAB–Gi complex in B2a state (grey) and this study determined GABAB-Gi structure (green). b, Structural comparisons of the Gi-bound GABAB (ago/PAM–Gi) (green) with the agonist-bound (ago) (PDB 6UO9) (grey) and agonist- and PAM-bound GABAB (ago/PAM) (PDB 6UO8) (blue).
Extended Data Fig. 6
Extended Data Fig. 6. Intra-subunit conformational changes of the TMD of GB2 upon activation.
a, Overlay of the structures of the TMD of GB2 in antagonist-bound (antago) (PDB 7C7S) (yellow), agonist-bound (ago) (PDB 6UO9) (sky blue), and agonist- and PAM–Gi-bound (ago/PAM-Gi) (green) states. b, c, Overlay of the different states of the TM6 of GB1 (antago, grey; ago/PAM–Gi, red) (b) and the TM6 of GB2 (antago, yellow; ago, blue; ago/PAM–Gi, green) (c). d, e, NanoBiT G-protein dissociation assay of GABAB with alterations of the residues that are involved in activation. Data are mean ± s.e.m. from at least three independent experiments, performed in technical triplicate. Source data
Extended Data Fig. 7
Extended Data Fig. 7. Gi activation and signalling assays.
a, Interface of GABAB and Gi1 protein. GB2, green; Gi1, yellow. The interaction interface between GB2 and Gi1 is in red. be, Agonist-induced IP1 accumulation assay of the wild-type and the Gi1-binding-pocket mutant GABAB. f, g, Emax and basal activity for each mutant relative to wild type, detected by IP1 accumulation assay and presented as dot plots. Data are mean ± s.e.m. from at least three independent experiments, performed in technical triplicate and analysed using one-way ANOVA with Dunnett’s multiple comparison test to determine significance (compared with wild type). h, Sequence alignment of the final five residues in the α5 helix among different Gα proteins. i, j, NanoBiT G-protein dissociation assay of the D350G.H5.22 (i) and F354G.H5.26 (j) mutant Gil. Data points in bg, i, j are mean ± s.e.m. from at least three independent experiments, performed in technical triplicate. Source data
Extended Data Fig. 8
Extended Data Fig. 8. Comparison of the Gi binding pocket among class-A, -B, -C and -F GPCRs.
ac, Parallel comparisons of the Gi binding pocket between the GABAB and class-A CB1 (a), class-B GCGR (b) and class-F SMO (c) receptors. Four structures were aligned by the class-A TMD as a reference, as in Fig. 2. A comparison of the indicated two receptors is shown. Colours for α5 are: GABAB-bound, yellow; CB1-bound (PDB 6N4B), orange–red; GCGR-bound (PDB 6LML), sky blue; and SMO-bound (PDB 6OT0), magenta.
Extended Data Fig. 9
Extended Data Fig. 9. Proposed model of GABAB activation.
ad, Schematic of the essential steps for GABAB activation. e, Comparison of the relative bending of GB2 subunit in the agonist- and PAM–Gi-bound (ago/PAM-Gi) (green), the agonist-bound (ago) (PDB 6UO9) (blue), and antagonist-bound (antago) (PDB 7C7S) (yellow) when aligned on the GB2 VFT. f, The transmembrane domain rearrangement of GABAB during activation. The antagonist-bound (antago) (PDB 7C7S) (yellow), agonist-bound (ago) (PDB 6UO9) (blue), and the agonist- and PAM–Gi-bound (ago/PAM–Gi) (green) structures of the TMD of GABAB were aligned by the TMB of GB1. g, PAM binding in agonist- and PAM–Gi-bound GABAB (ago/PAM–Gi).

References

    1. Hauser AS, Attwood MM, Rask-Andersen M, Schiöth HB, Gloriam DE. Trends in GPCR drug discovery: new agents, targets and indications. Nat. Rev. Drug Discov. 2017;16:829–842. - PMC - PubMed
    1. Gilman AG. G proteins: transducers of receptor-generated signals. Annu. Rev. Biochem. 1987;56:615–649. - PubMed
    1. Rasmussen SG, et al. Crystal structure of the β2 adrenergic receptor–Gs protein complex. Nature. 2011;477:549–555. - PMC - PubMed
    1. Kang Y, et al. Cryo-EM structure of human rhodopsin bound to an inhibitory G protein. Nature. 2018;558:553–558. - PMC - PubMed
    1. Qi X, et al. Cryo-EM structure of oxysterol-bound human Smoothened coupled to a heterotrimeric Gi. Nature. 2019;571:279–283. - PMC - PubMed

Publication types