. 2021 May;593(7858):255-260.
doi: 10.1038/s41586-021-03489-0. Epub 2021 Apr 28.

Meningeal lymphatics affect microglia responses and anti-Aβ immunotherapy

Affiliations

Meningeal lymphatics affect microglia responses and anti-Aβ immunotherapy

Sandro Da Mesquita et al. Nature. 2021 May.

Abstract

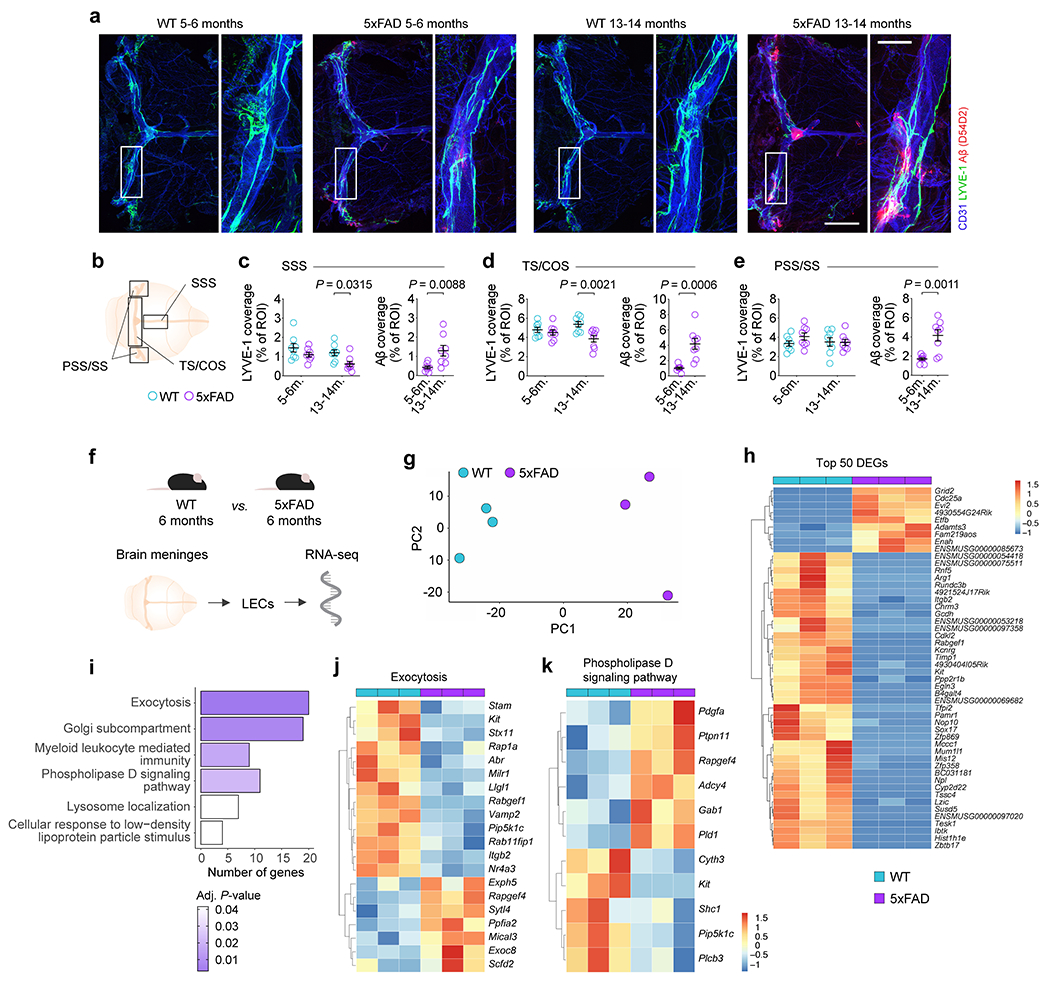
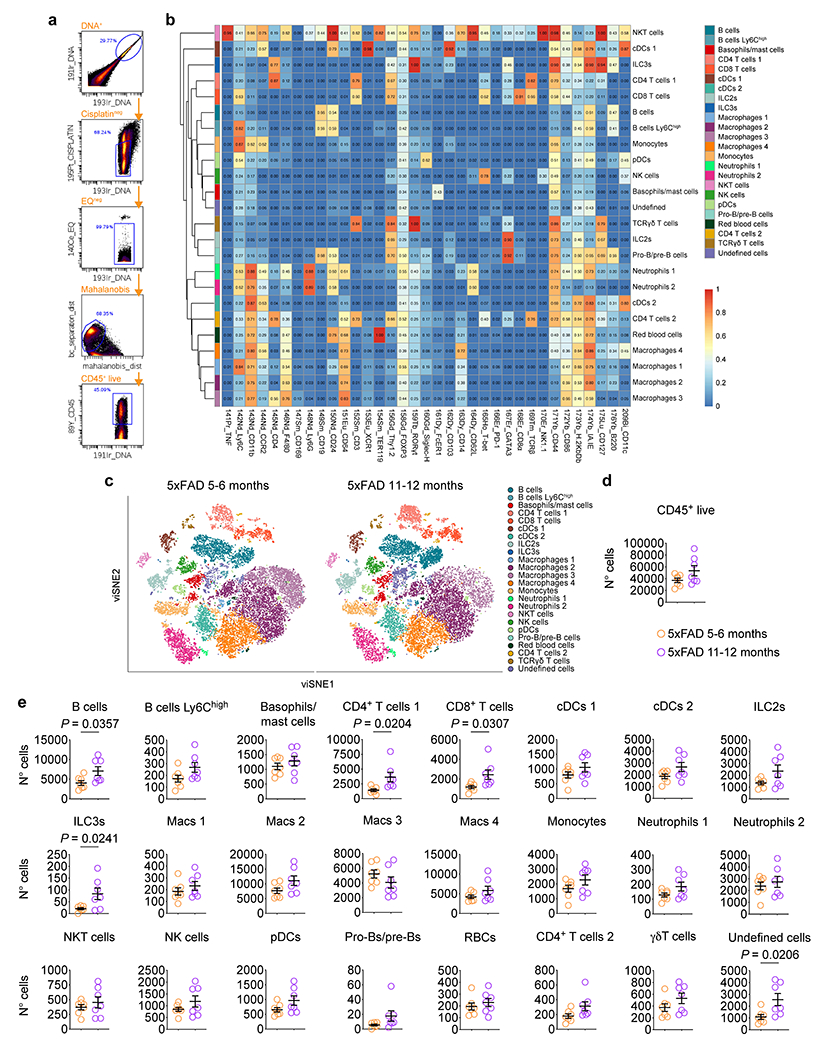
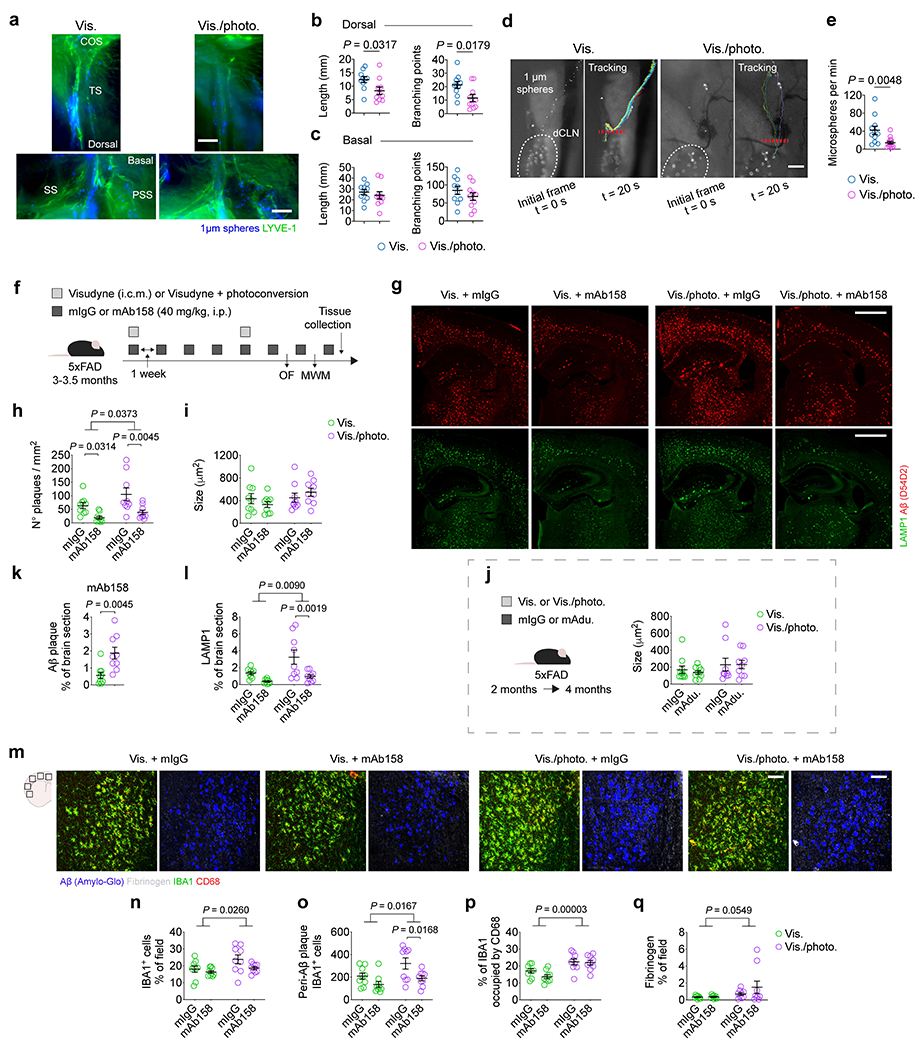
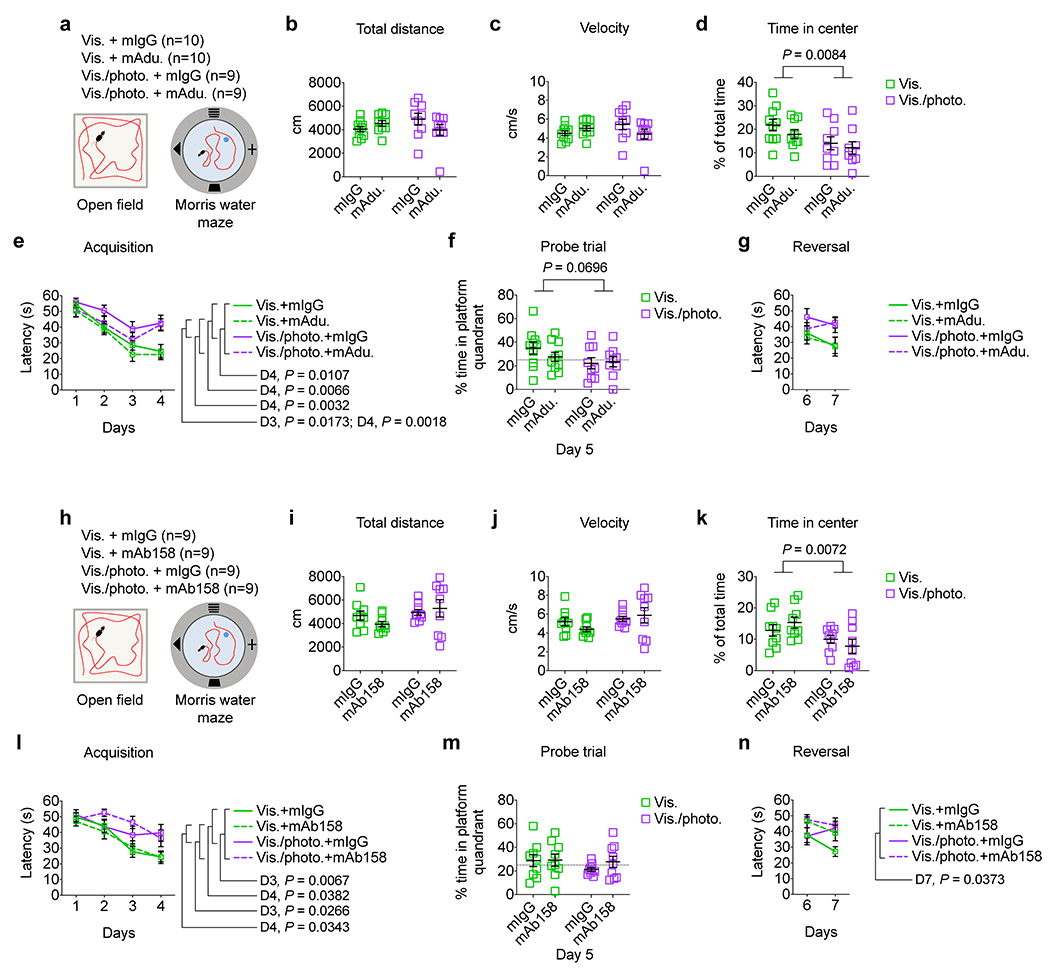
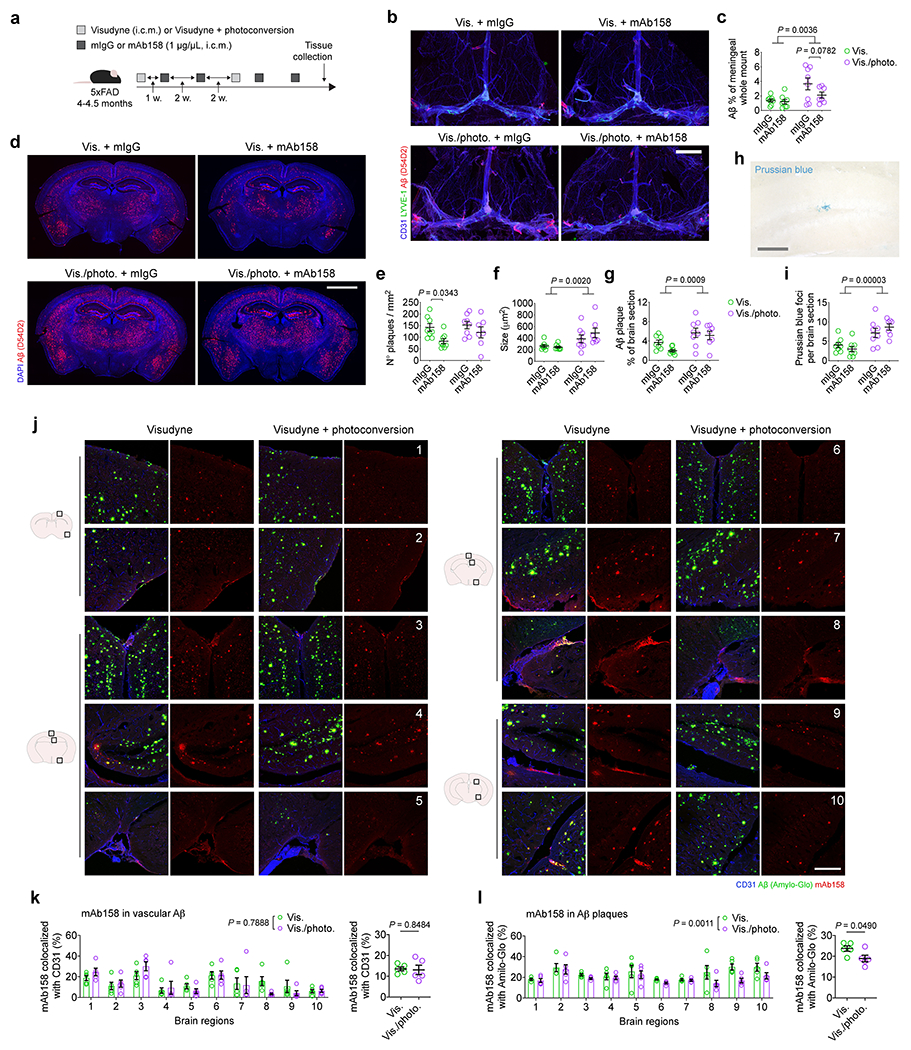
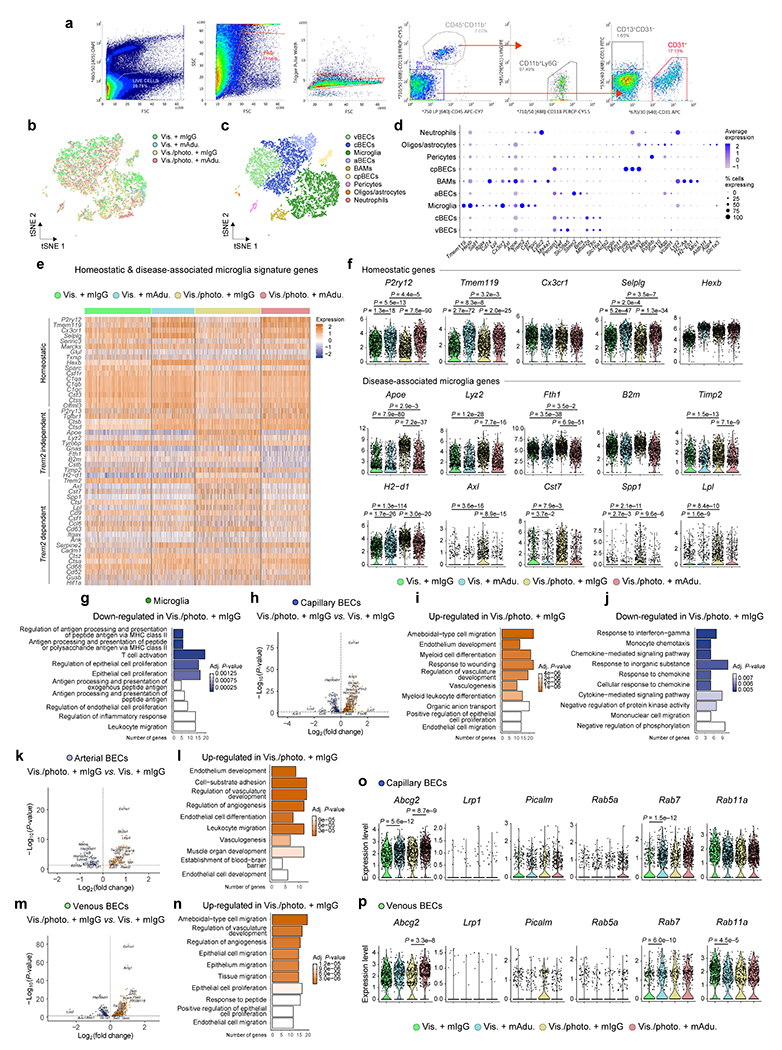
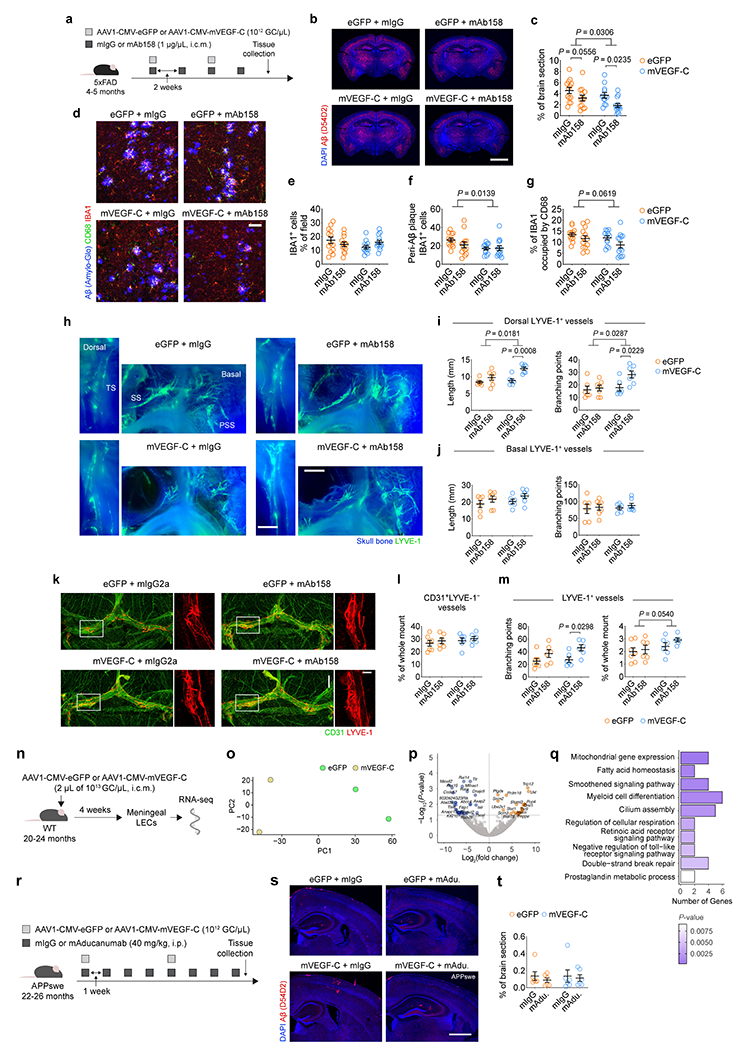
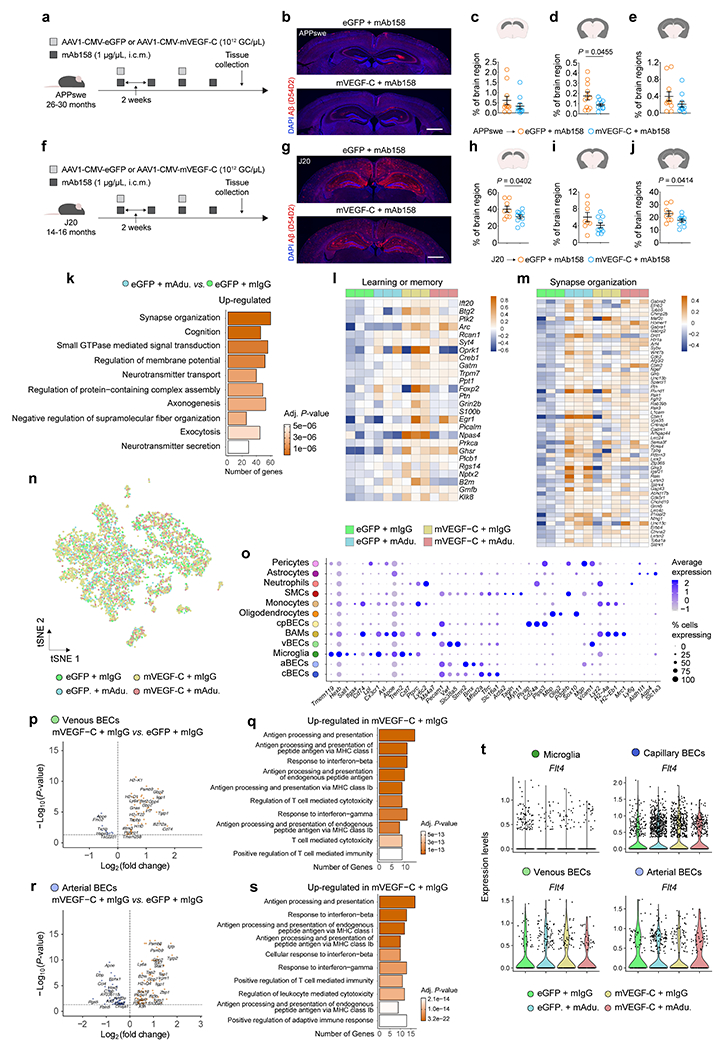
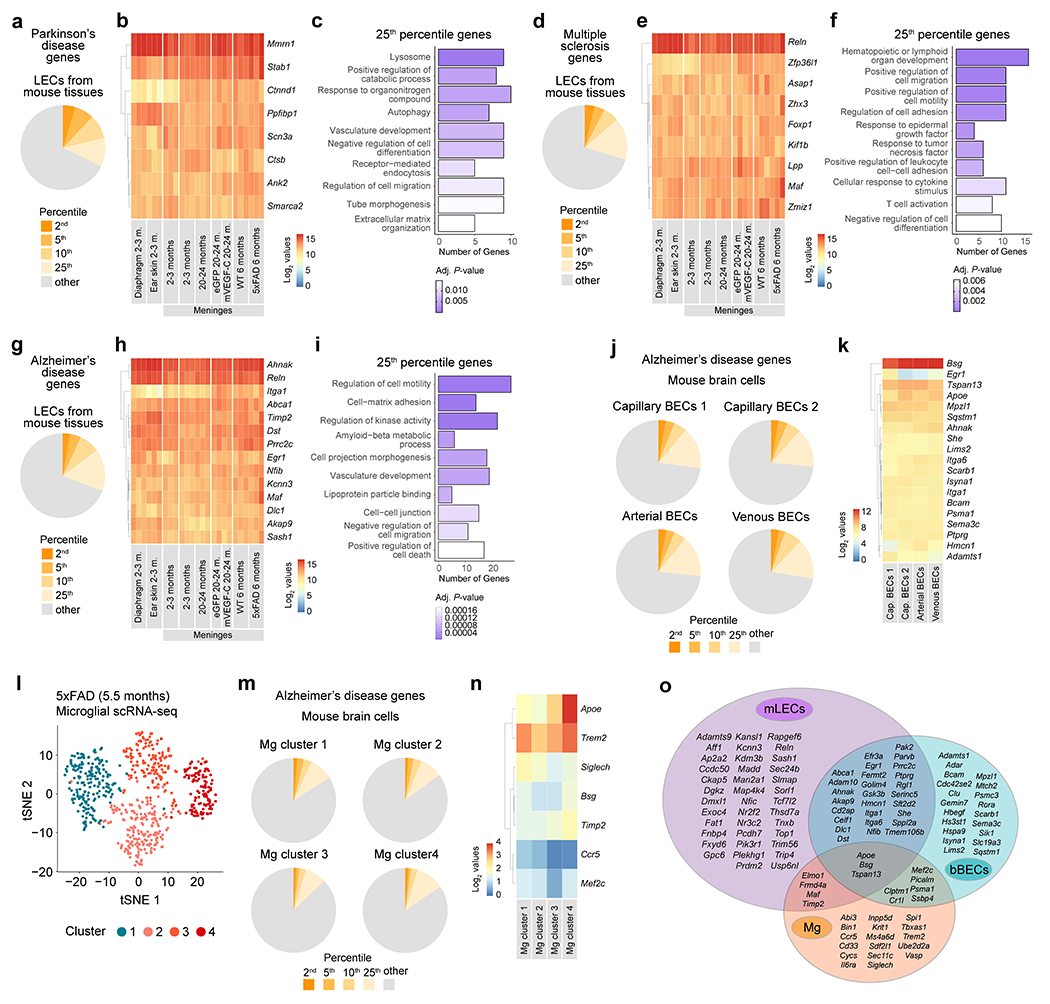
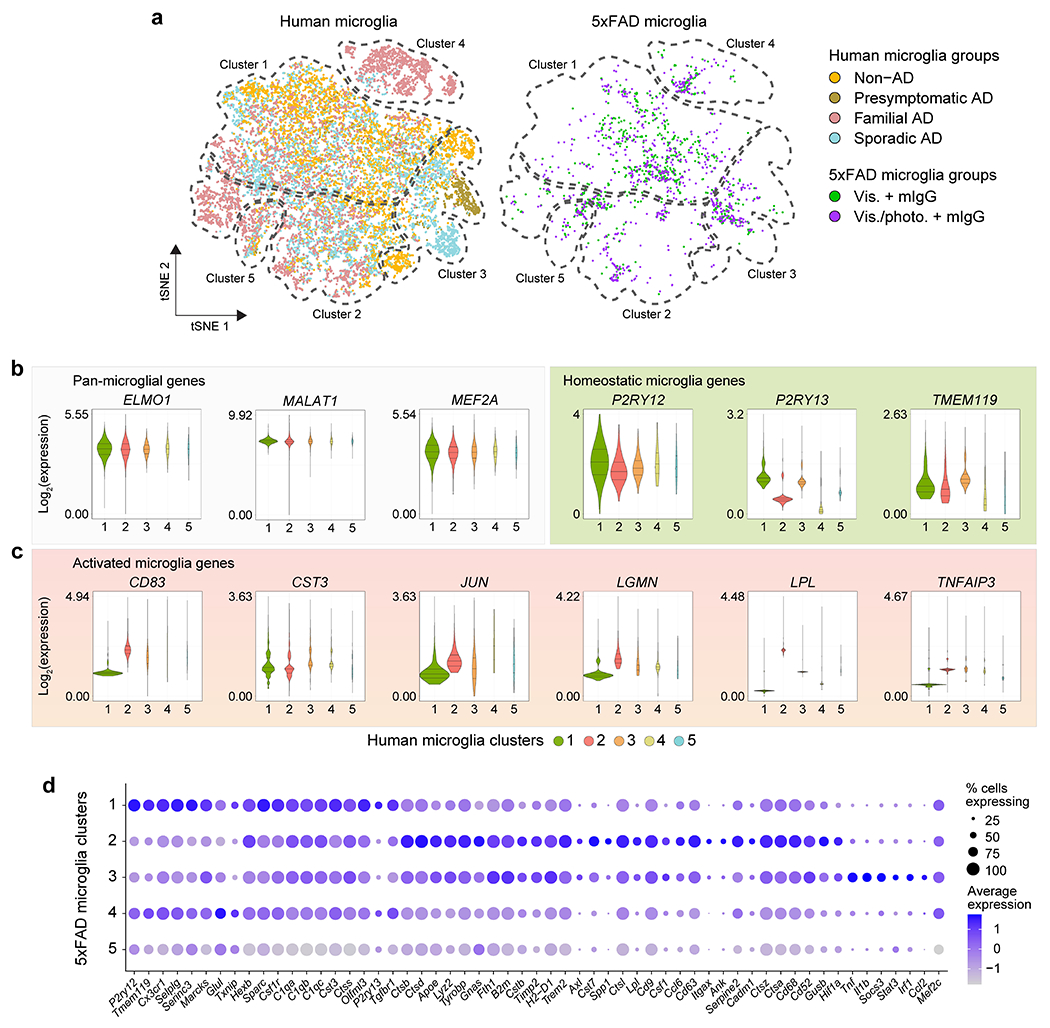
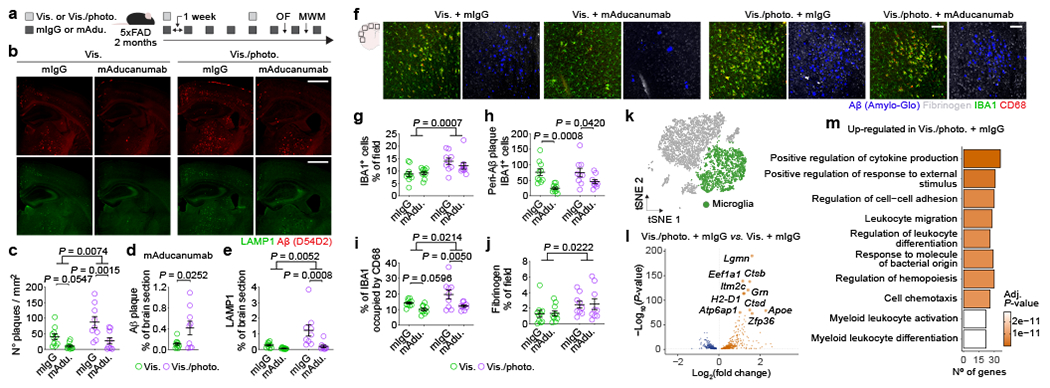
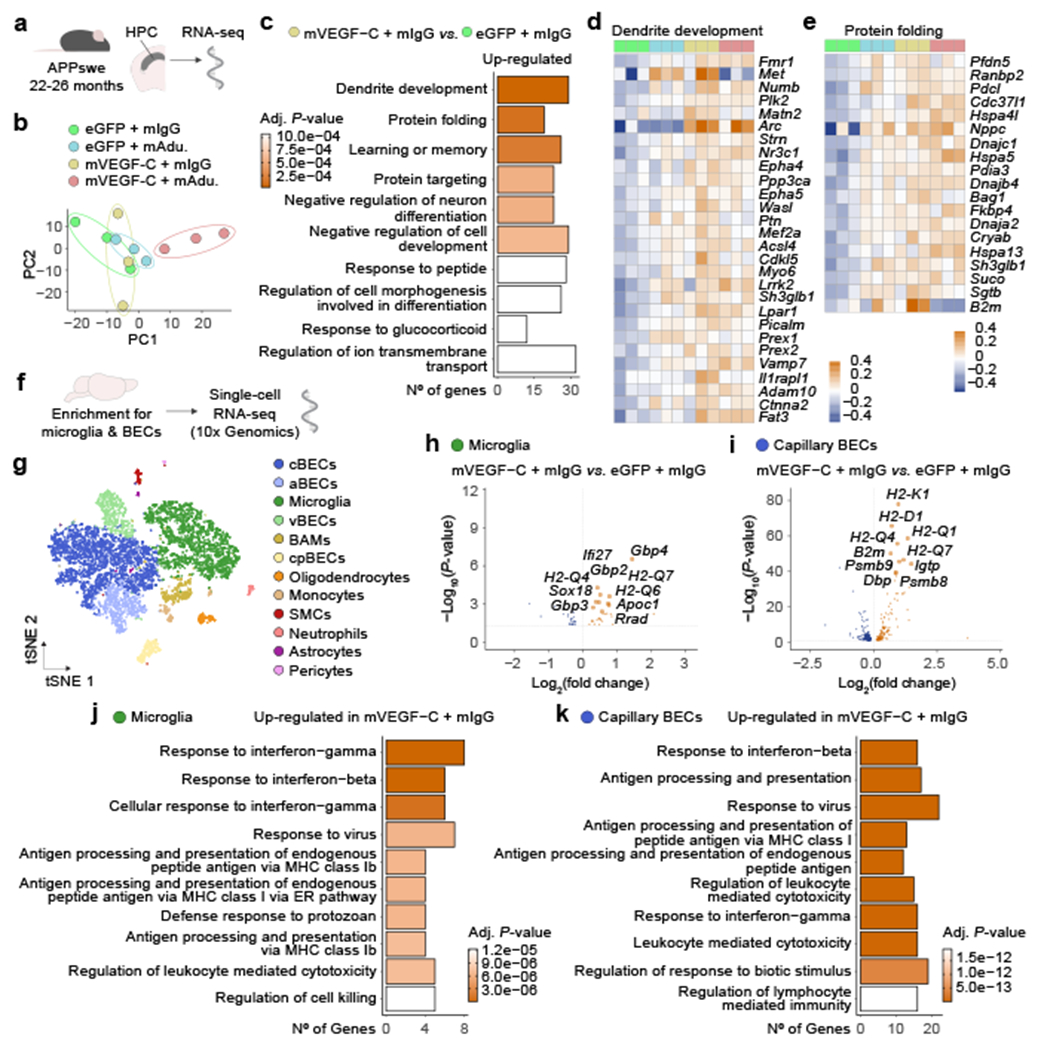
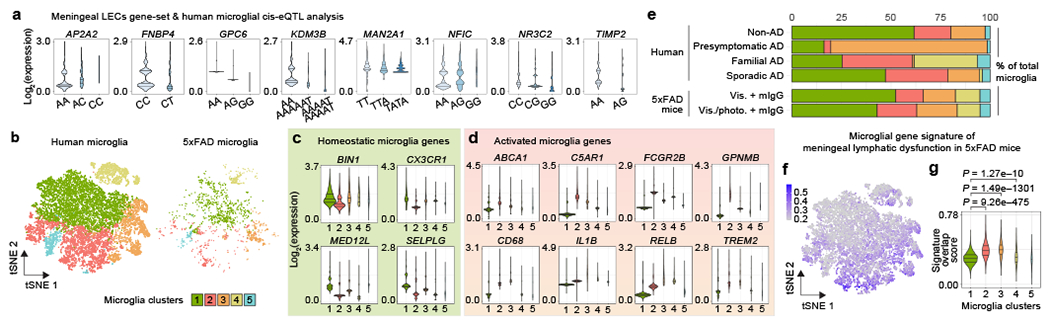
Alzheimer's disease (AD) is the most prevalent cause of dementia1. Although there is no effective treatment for AD, passive immunotherapy with monoclonal antibodies against amyloid beta (Aβ) is a promising therapeutic strategy2,3. Meningeal lymphatic drainage has an important role in the accumulation of Aβ in the brain4, but it is not known whether modulation of meningeal lymphatic function can influence the outcome of immunotherapy in AD. Here we show that ablation of meningeal lymphatic vessels in 5xFAD mice (a mouse model of amyloid deposition that expresses five mutations found in familial AD) worsened the outcome of mice treated with anti-Aβ passive immunotherapy by exacerbating the deposition of Aβ, microgliosis, neurovascular dysfunction, and behavioural deficits. By contrast, therapeutic delivery of vascular endothelial growth factor C improved clearance of Aβ by monoclonal antibodies. Notably, there was a substantial overlap between the gene signature of microglia from 5xFAD mice with impaired meningeal lymphatic function and the transcriptional profile of activated microglia from the brains of individuals with AD. Overall, our data demonstrate that impaired meningeal lymphatic drainage exacerbates the microglial inflammatory response in AD and that enhancement of meningeal lymphatic function combined with immunotherapies could lead to better clinical outcomes.


Figures

Extended Data Figure 1 |
Extended Data Figure 1 |. Morphological assessment and functional enrichment analysis of differentially expressed genes show accelerated meningeal lymphatic dysfunction in 5xFAD mice.
a, Representative images of meningeal whole mounts from 5xFAD mice at 5–6 and 13–14 months of age, stained for CD31 (blue), LYVE-1 (green) and Aβ (red, stained with the D54D2 antibody; scale bar, 2 mm; inset scale bar, 500 μm). b, Scheme depicting the compartmentalization of the meningeal whole mount for quantification of LYVE-1 and Aβ coverage. c-e, Graphs showing the coverage by LYVE-1+ vessels and Aβ as a percentage of the region of interest (% of ROI) at the c) superior sagittal sinus (SSS), d) transverse sinus and confluence of sinuses (TS/COS), and e) petrosquamosal and sigmoid sinuses (PSS/SS). Results in a-e are presented as mean ± s.e.m.; n = 8 per group; two-way ANOVA with Holm-Sidak’s multiple comparisons test (for LYVE-1+ vessels) and two-tailed unpaired Student’s T test (for Aβ coverage); data result from 2 independent experiments. f, Lymphatic endothelial cells (LECs) were isolated from the brain meninges of male 5xFAD mice and WT littermate controls at 6 months of age, total RNA was extracted and sequenced. g, Principal component analysis (PCA) plot showing segregation between WT (blue) and 5xFAD (purple) meningeal LEC transcriptomes. h, Heatmap of top 50 differentially expressed genes in 5xFAD meningeal LECs at 6 months of age. i, Gene-sets obtained by functional enrichment of differentially expressed genes in meningeal LECs from 5xFAD mice. j, k, Exocytosis (GO:0006887) and phospholipase D signaling pathway (KEGG:mmu04072) gene-sets obtained by functional enrichment analysis, with corresponding differentially expressed genes. Data in f-k consists of n = 3 per group; individual RNA samples result from LECs pooled from 10 meninges over 3 independent experiments; the Benjamini-Hochberg correction was used to adjust the associated P-values in i (adj. P-value < 0.05); functional enrichment of differential expressed genes in i was determined with Fisher’s exact test; color scale bar in h and k represents expression values for each sample as standard deviations from the mean across each gene.
Extended Data Figure 2 |
Extended Data Figure 2 |. Meningeal immune cell profiling by mass cytometry in 5xFAD mice at 5–6 and 11–12 months.
a, Meningeal single-cell suspensions were obtained from male 5xFAD mice at 5–6 months and 11–12 months and processed for mass cytometry. Representative mass cytometry dot plots depicting gating strategy used to select CD45+ live cells used in further high-dimensional analysis. b, Heatmaps of the median marker expression values for each immune cell cluster identified using Rphenograph. Median marker expression values are indicated by color intensity depicted in the scale bar. c, t-distributed stochastic neighbor embedding-based visualization (viSNE) plots showing unsupervised clustering of CD45+ live immune cells. d, Number of CD45+ live meningeal leukocytes at 5–6 (orange) and 11–12 (purple) months in 5xFAD mice. e, Numbers of different meningeal immune cells showing a statistically significant increase in B cells, CD4+ T cells 1, CD8+ T cells, type 3 innate lymphoid cells (ILC3s) and undefined cells in the meninges of 5xFAD mice at 11-12 months of age. Data in a-e are representative of a single experiment; results in d and e are presented as mean ± s.e.m.; n = 7 per group; two-tailed unpaired Student’s T test.
Extended Data Figure 3 |
Extended Data Figure 3 |. Compromising meningeal lymphatic function in 5xFAD mice limits brain Aβ clearance by mAb158 and modulates neuritic dystrophy, microglial activation and fibrinogen levels.
a-e, Adult 2-month-old male WT mice were injected with 5 μL of Visudyne (intra-cisterna magna, i.c.m.) followed by a transcranial photoconversion step (Vis./photo.) to ablate meningeal lymphatic vessels at the dorsal meninges. Control mice were injected with Visudyne without photoconversion (Vis.). One week later, each mouse was injected with 5 μL of a suspension of fluorescent microspheres (1 μm in diameter) into the CSF and 15 min later the lymphatic vessel afferent to the deep cervical lymph node (dCLN) was imaged by live in vivo fluorescence stereomicroscopy. a, Representative images of skull caps with attached meningeal layers showing microspheres (blue) and lymphatic vessels stained for LYVE-1 (in green) around the confluence of sinuses (COS) and transverse sinus (TS) at the dorsal meninges or around the sigmoid (SS) and petrosquamosal (PSS) sinuses at the basal meninges (scale bars, 500 μm). b, c, Graphs showing LYVE-1+ vessels’ total length (in mm) and number of branching points in lymphatics at the b) dorsal and c) basal meninges. Results in b and c are presented as mean ± s.e.m.; n = 10 per group; two-tailed unpaired Student’s T test; data are representative of 2 independent experiments. d, Representative frames showing microspheres flowing through the lymphatic vessel afferent to the dCLN, or cumulative sphere tracking (for 20 sec), in mice with intact or ablated meningeal lymphatic vessels. e, Graph with quantifications of microsphere flow (number of microspheres per minute) in mice from each group. Results in e are presented as mean ± s.e.m.; n = 11 in Vis. group and n = 14 in Vis./photo. group; two-tailed unpaired Student’s T test; data result from 2 independent experiments. f, Adult 3–3.5-month-old male 5xFAD mice were injected (i.c.m.) with Visudyne (5 μL) plus photoconversion (Vis./photo.) or Visudyne without photoconversion (Vis.). Upon recovery, mice received intraperitoneal (i.p.) injections of mAb158 (a murine antibody against Aβ protofibrils) or the control murine IgG (mIgG) antibodies, each at a dose of 40 mg/kg. Antibodies were injected weekly for a total of four weeks. Additional steps of meningeal lymphatic vessel ablation or control interventions were followed by four weekly injections with antibodies. Mice were tested in the open field and Morris water maze (see Extended Data Fig. 4). g, Representative images of brain sections from 5xFAD mice stained for Aβ (red, stained with the D54D2 antibody) and for LAMP1 (green; scale bars, 1 mm). h-l, Graphs showing h) number of Aβ plaques per mm2 of brain section, i) average size of Aβ plaques (μm2) in mAb158 cohort, j) average size of Aβ plaques (μm2) in mAducanumab cohort (related to Fig. 1a–e), k) coverage by Aβ plaques and l) coverage by LAMP1+ dystrophic neurites (as % of brain section) in each group. m, Representative images of the brain cortex stained for Aβ (blue, stained with Amilo-Glo), fibrinogen (grey), IBA1 (green) and CD68 (red; scale bar, 100 μm). n-q, Graphs showing the n) coverage by IBA1+ cells (% of field), o) number of peri-Aβ plaque IBA1+ cells, p) percentage of IBA1 occupied by CD68 and q) fibrinogen coverage (% of field) in each group. Data in f-q are representative of a single experiment; results in h-l and n-q are presented as mean ± s.e.m.; n = 9 in each group; in h, i, j, l and n-q, two-way ANOVA with Holm-Sidak’s multiple comparisons test; in k, two-tailed unpaired Student’s T test.
Extended Data Figure 4 |
Extended Data Figure 4 |. Meningeal lymphatic dysfunction leads to anxious-like behavior and worsened spatial learning and memory in 5xFAD mice.
a, Adult 5xFAD mice with intact or ablated meningeal lymphatics and treated with mAducanumab (mAdu.) or control mIgG antibodies (see Fig. 1 for experimental scheme and more results) were tested in the open field arena and in the Morris water maze. b-d, Graphs showing b) total distance (in centimeters), c) velocity (in centimeters per second) and d) percentage of time in the center of the open field arena (% of total time). e-g, Graphs showing e) latency to platform in acquisition (in seconds), f) percentage of time in the platform quadrant in the probe trial and g) latency to platform in reversal (in seconds). Data in a-g result from a single experiment; results in b-g are presented as mean ± s.e.m.; n = 10 in Vis. groups and n = 9 in Vis./photo. groups; two-way ANOVA with Holm-Sidak’s multiple comparisons test in b-d and f; repeated measures two-way ANOVA with Tukey’s multiple comparisons test in e and g; statistically significant differences between groups in days 3 and 4 of the Morris water maze test are indicated as D3 and D4, respectively. h, Adult 5xFAD mice with intact or ablated meningeal lymphatics and treated with mAb158 or control mIgG antibodies (see Extended Data Fig. 3f–q for experimental scheme and more results) were tested in the open field arena and in the Morris water maze. i-k, Graphs showing i) total distance (in centimeters), j) velocity (in centimeters per second) and k) percentage of time in the center of the open field arena (% of total time). l-n, Graphs showing l) latency to platform in acquisition (in seconds), m) percentage of time in the platform quadrant in the probe trial and n) latency to platform in reversal (in seconds). Data in h-n result from a single experiment; results in i-n are presented as mean ± s.e.m.; n = 9 in each group; two-way ANOVA with Holm-Sidak’s multiple comparisons test in i-k and m; repeated measures two-way ANOVA with Tukey’s multiple comparisons test in l and n; statistically significant differences between groups in days 3, 4 and 7 of the Morris water maze test are indicated as D3, D4 and D7, respectively.
Extended Data Figure 5 |
Extended Data Figure 5 |. Meningeal lymphatic vessel ablation precludes brain Aβ plaque clearance by mAb158 administered into the CSF.
a, Adult 4–4.5-month-old male 5xFAD mice were injected (i.c.m.) with Visudyne (5 μL) plus photoconversion (Vis./photo.) or Visudyne without photoconversion (Vis.). One week later, 5 μL of mAb158 antibodies or the same volume of the control murine IgG (mIgG) antibodies were directly injected into the CSF (i.c.m.), both at 1 μg/μL. Injections with antibodies were repeated two weeks later. Additional steps of meningeal lymphatic vessel ablation or control interventions were followed by two more i.c.m. injections with antibodies according to the scheme. b, Representative images of meningeal whole mounts stained for CD31 (blue), LYVE-1 (green) and Aβ (red, stained with the D54D2 antibody; scale bar, 2 mm). c, Graph showing the coverage by Aβ as a percentage of the meningeal whole mount. d, Representative images of brain sections from 5xFAD mice stained for Aβ (red, stained with the D54D2 antibody) and with DAPI (blue; scale bar, 2 mm). e-g, Graphs showing e) number of Aβ plaques per mm2 of brain section, f) average size of Aβ plaques (μm2) and g) total coverage of Aβ plaques (% of brain section) in each group. h, Representative inset showing an example of a Prussian blue focus in a brain tissue section of a 5xFAD mouse (scale bar, 100 μm). i, Graph showing the quantifications of Prussian blue foci per brain section in each group. Data in a-i are representative of 2 independent experiments; results in c, e-g and i are presented as mean ± s.e.m.; n = 8 in Vis. plus mIgG, Vis. plus mAb158 and Vis./photo. plus mIgG, n = 7 in Vis./photo. plus mAb158; two-way ANOVA with Holm-Sidak’s multiple comparisons test. j, 5xFAD mice (5 months old) with intact or ablated meningeal lymphatic vasculature were injected (i.c.m.) with 5 μL of mAb158 (at 1 μg/μL). One hour later, mice were transcardially perfused and the brains were collected for assessment of mAb158 linked to Aβ in blood vasculature or Aβ plaques. Images of ten different regions of the brain of 5xFAD mice from each group showing blood vessels stained for CD31 (blue), Aβ plaques (green, stained with Amylo-Glo) and mAb158 (red; scale bar, 200 μm). k, Graphs with colocalization between mAb158 and CD31 (% of total CD31 coverage) in each brain region (1 to 10) or presented as the average of all regions. l, Graphs with colocalization between mAb158 and Amilo-Glo (% of total Amilo-Glo-stained Aβ plaques) in each brain region (1 to 10) or presented as the average of all regions. Data in j-l result from a single experiment; results in k and l are presented as mean ± s.e.m.; n = 5 per group; two-way ANOVA with Holm-Sidak’s multiple comparisons test (for comparisons between groups in each brain region) and two-tailed unpaired Student’s T test (for comparisons between the two groups).
Extended Data Figure 6 |
Extended Data Figure 6 |. Effects of meningeal lymphatic vessel ablation and mAducanumab immunotherapy on the microglial and blood endothelial cell transcriptomes in 5xFAD mice.
a, Representative flow cytometry dot plots showing gating strategy used to sort (and enrich for) live (DAPI) singlets that were CD45+CD11b+Ly6G (macrophages/microglia), CD45CD11bCD31+ (blood endothelial cells) and CD45CD11bCD13+CD31 (mural cells). b, c, Representations of the t-distributed stochastic neighbor embedding (tSNE) plots highlighting the brain cells identified by single-cell RNA-seq discriminated by b) group or c) type. d, Dot plot depicting the average scaled expression levels of specific genes (in the x axis) used to identify the brain cell populations, as well as the percentage of cells expressing those genes within each population; choroid plexus blood endothelial cells (cpBECs), border-associated macrophages (BAMs), arterial BECs (aBECs), capillary BECs (cBECs), venous BECs (vBECs). e, Heatmap showing expression levels of genes involved in the transition from homeostatic to Trem2-independent and Trem2-dependent disease-associated microglia phenotypes in the different groups. f, Violin plots showing the expression levels of the homeostatic P2ry12, Tmem119, Cx3cr1, Selplg and Hexb genes, and disease-associated microglia Apoe, Lyz2, Fth1, B2m, Timp2, H2-d1, Axl, Cst7, Spp1 and Lpl genes in each group. g, Top ten Gene Ontology terms obtained after analyzing significantly down-regulated genes in microglia from the Vis./photo. plus mIgG group, when compared to the Vis. plus mIgG group. h, Volcano plot with significantly down-regulated (in blue) and up-regulated (in orange) genes after comparing the transcriptomes of cBECs from the Vis./photo. plus mIgG and the Vis. plus mIgG groups. i, j, Top ten Gene Ontology terms obtained after analyzing significantly i) up-regulated or j) down-regulated genes in cBECs from the Vis./photo. plus mIgG group, when compared to the Vis. plus mIgG group. k-n, Volcano plots, with significantly down-regulated (in blue) and up-regulated (in orange) genes, and top ten Gene Ontology terms (using up-regulated genes) obtained after comparing the transcriptomes of aBECs (k and l) and vBECs (m and n) from the Vis./photo. plus mIgG and the Vis. plus mIgG groups. o, p, Violin plots showing the expression levels of Abcg2, Lrp1, Picalm, Rab5a, Rab7 and Rab11a in o) cBECs and p) vBECs from each group. Data in a-p resulted from a single experiment where the transcriptomes of 7,286 cells (isolated from brain hemispheres of 3 mice per group) were analyzed, including 2,625 microglia, 1,958 cBECs, 545 aBECs and 1,412 vBECs; scale bar in e represents scaled expression at the single-cell level; differentially expressed genes plotted in h, k and m were determined using a F-test with adjusted degrees of freedom based on weights calculated per gene with a zero-inflation model and Benjamini-Hochberg adjusted P-values; Gene Ontology analyses used over-representation test and scale bars in g, i, j, l and n represent Benjamini-Hochberg adjusted P-values for each pathway; gene expression comparison in f, o and p was done using Wilcoxon Rank-Sum test with Bonferroni’s adjusted P-values reported.
Extended Data Figure 7 |
Extended Data Figure 7 |. Improved brain Aβ plaque clearance by delivery of mVEGF-C and mAb158 into the CSF is correlated with lymphatic vessel expansion at the dorsal meninges and transcriptional reprogramming of meningeal LECs.
a, Adult 4–5-month-old male 5xFAD mice were injected with 5 μL (i.c.m.) of AAV1 expressing enhanced green fluorescent protein (eGFP) or murine VEGF-C (mVEGF-C), under the cytomegalovirus (CMV) promoter (each at 1012 GC/μL), in combination with either mAb158 antibodies or the respective mIgG control (each at 1 μg/μL) antibodies. Antibody injections (5 μL at 1 μg/μL, i.c.m.) were repeated two weeks later. The same regimen of the aforementioned i.c.m. injections was repeated as indicated in the scheme and tissue was collected two weeks after the last injection. b, Representative images of brain sections stained for Aβ (red, stained with the D54D2 antibody) and with DAPI (blue; scale bar, 2 mm). c, Graph showing coverage of Aβ as percentage of brain section in each group. d, Representative images from the brain cortex stained for Aβ (blue, stained with the Amilo-Glo), CD68 (green) and IBA1 (red; scale bar, 50 μm). e-g, Graphs showing the e) coverage by IBA1+ cells (% of field), f) number of peri-Aβ plaque IBA1+ cells and g) percentage of IBA1 occupied by CD68 in each group. Results in c and e-g are presented as mean ± s.e.m.; n = 12 in mVEGF-C plus mIgG and n = 13 in eGFP plus mIgG, eGFP plus mAb158 and mVEGF-C plus mAb158; two-way ANOVA with Holm-Sidak’s multiple comparisons test; data in a-g result from 2 independent experiments. h, Representative fluorescence stereomicroscopy images of skull caps (skull bone signal in blue) and attached meningeal lymphatic vessels stained for LYVE-1 (in green) around the transverse sinus (TS) at the dorsal meninges or around the sigmoid (SS) and petrosquamosal (PSS) sinuses at the basal meninges (scale bars, 500 μm). i, j, Graphs showing LYVE-1+ vessels’ total length (in mm) and number of branching points in lymphatics at the i) dorsal and j) basal meninges. Results in h-j are presented as mean ± s.e.m.; n = 6 in mIgG groups and n = 7 in mAb158 groups; two-way ANOVA with Holm-Sidak’s multiple comparisons test; data in h-j are representative of 2 independent experiments. k, Representative images of meningeal whole mounts stained for CD31 (green) and LYVE-1 (red; scale bar, 1 mm; inset scale bar, 300 μm). l, m, Graphs showing the l) coverage by CD31+LYVE-1 vessels (% of meningeal whole mount) and the m) number of branching points and coverage by LYVE-1+ vessels (% of meningeal whole mount). Results in l and m are presented as mean ± s.e.m.; n = 7 in eGFP plus mIgG and n = 6 in eGFP plus mAb158, mVEGF-C plus mIgG and mVEGF-C plus mAb158; two-way ANOVA with Holm-Sidak’s multiple comparisons test; data in k-m are representative of 2 independent experiments. n, Aged WT mice (20–24 months of age) were injected with 2 μL (i.c.m.) of AAV1 expressing eGFP or mVEGF-C, under the CMV promoter (each at 1013 GC/μL). One month later, mice were transcardially perfused, skull caps were collected, meninges harvested and LECs were sorted by FACS for bulk RNA-seq. o, PCA plot showing segregation between eGFP (orange) and mVEGF-C (blue) meningeal LEC transcriptomes. p, Volcano plot showing the significantly down-regulated (in blue) and up-regulated (in orange) genes between meningeal LECs from the mVEGF-C and eGFP groups. q, Ten Gene Ontology terms (selected from the 30 most altered) obtained after analysis of the differentially expressed genes between meningeal LECs from the mVEGF-C and eGFP groups. Data in n-q consists of n = 2 per group; individual RNA samples result from LECs pooled from 10 meninges over 2 independent experiments; differentially expressed genes (P < 0.05) plotted in c were determined using a F-test with adjusted degrees of freedom based on weights calculated per gene with a zero-inflation model; Gene Ontology analysis in q used over-representation test and the scale bar represents the P-value for each pathway. r, Aged APPswe (22–26 months of age) were treated with viral vectors expressing eGFP or mVEGF-C (via i.c.m. injections) and with mIgG or mAdu. antibodies (via i.p. injections, according to the regimen in the scheme; related to Fig. 2). s, Representative images of brain sections stained for Aβ (red, stained with the D54D2 antibody) and with DAPI (blue; scale bar, 1 mm). t, Graph showing coverage of Aβ (as percentage of the brain sections) in each group. Results in t are presented as mean ± s.e.m.; n = 6 per group; two-way ANOVA with Holm-Sidak’s multiple comparisons test; data in r-t resulted from a single experiment.
Extended Data Figure 8 |
Extended Data Figure 8 |. Therapeutic effects of mVEGF-C on the clearance of Aβ by antibodies in old APPswe mice and the gene expression profile of brain cells.
a, Aged APPswe mice (26–30 months old) were injected with 5 μL (i.c.m.) of AAV1 expressing eGFP or mVEGF-C (each at 1012 GC/μL) in combination with mAb158 (at 1 μg/μL) as indicated in the scheme. b, Representative images of brain sections from APPswe mice stained for Aβ (red, stained with the D54D2 antibody) and with DAPI (blue; scale bar, 1 mm). c-e, Graphs showing coverage of Aβ (% of brain region) in the c) hippocampus, d) cortex/striatum/amygdala and e) combined regions. Results in c-e are presented as mean ± s.e.m.; n = 11 per group; two-tailed unpaired Student’s T test; data in a-e result from a single experiment. f, Aged J20 mice (14–16 months old) were injected with 5 μL (i.c.m.) of AAV1 expressing eGFP or mVEGF-C (each at 1012 GC/μL) in combination with mAb158 (at 1 μg/μL) as indicated in the scheme. g, Representative images of brain sections from J20 mice stained for Aβ (red, stained with the D54D2 antibody) and with DAPI (blue; scale bar, 1 mm). h-j, Graphs showing coverage of Aβ (% of brain region) in the h) hippocampus, i) cortex/striatum/amygdala and j) combined regions. Results in h-j are presented as mean ± s.e.m.; n = 8 in eGFP plus mAb158 and n = 10 in mVEGF-C plus mAb158; two-tailed unpaired Student’s T test; data in f-j result from a single experiment. k, Top ten Gene Ontology terms obtained after analyzing significantly up-regulated genes in hippocampi (n = 3 per group) from the eGFP plus mAdu. group when compared to the eGFP plus mIgG group (related to Fig. 2a–c). l, m, Heatmaps depicting the expression profile of genes comprised in the l) learning and memory (GO:0007611) and m) synapse organization (GO:0050808) Gene Ontology pathways (related to Fig. 2d, e). Data in k-m is from a single experiment; Gene Ontology analyses used over-representation test and scale bar in k represents Benjamini-Hochberg adjusted P-values; heatmaps in l and m depict counts-per-million normalized expression minus per-gene mean expression. n, Representation of the tSNE plot highlighting sequenced brain cells by group. o, Dot plot depicting the average scaled expression levels of specific genes (in the x axis) used to identify the brain cell populations, as well as the percentage of gene-expressing cells within each population; smooth muscle cells (SMCs) choroid plexus blood endothelial cells (cpBECs), border-associated macrophages (BAMs), venous BECs (vBECs), arterial BECs (aBECs) and capillary BECs (cBECs). p-s, Volcano plots, with significantly down-regulated (in blue) and up-regulated (in orange) genes, and Gene Ontology terms (obtained using up-regulated genes; selected from top 20 terms) obtained after comparing the transcriptomes of vBECs (p and q) and aBECs (r and s) from the mVEGF-C plus mIgG group and the eGFP plus mIgG group. t, Violin plots showing the expression levels of the Flt4 gene in microglia, capillary, venous and arterial BECs in each group. Data in n-t are related to Fig. 2f–k and resulted from a single experiment where the transcriptomes of 7,739 cells (isolated from brain hemispheres of 3 mice per group) were analyzed, including 2,345 microglia, 2,934 cBECs, 602 vBECs and 766 aBECs; differentially expressed genes plotted in p and r were determined using an F-test with adjusted degrees of freedom based on weights calculated per gene with a zero-inflation model and Benjamini-Hochberg adjusted P-values; Gene Ontology analyses used over-representation test and scale bars in q and s represent Benjamini-Hochberg adjusted P-values for each pathway; gene expression comparison in t was done using Wilcoxon Rank-Sum test with Bonferroni’s P-value adjustment.
Extended Data Figure 9 |
Extended Data Figure 9 |. Expression profile of genes associated with Parkinson’s disease, multiple sclerosis and AD in meningeal LECs, brain blood endothelial cells and microglia from different mouse models.
a, Pie chart showing the proportion of Parkison’s disease-associated genes, for which the average expression across all RNA-seq datasets of lymphatic endothelial cells (LECs) was in the top 2nd, 5th, 10th, or 25th percentile out of all genes. b, Heatmap showing the log2-normalized expression values (depicted in the color scale bar) for Parkinson’s disease-associated genes whose average expression values fall within the top 2nd percentile of all genes expressed across all LECs’ RNA-seq datasets. c, Gene-sets obtained by functional enrichment of 25th percentile Parkinson’s disease-associated genes expressed across all LECs’ RNA-seq datasets. d, Pie chart showing the proportion of multiple sclerosis-associated genes, for which the average expression across all LECs’ RNA-seq datasets was in the top 2nd, 5th, 10th, or 25th percentile out of all genes. e, Heatmap showing the log2-normalized expression values (depicted in the color scale bar) for multiple sclerosis-associated genes whose average expression values fall within the top 2nd percentile of all genes expressed across all LECs’ RNA-seq datasets. f, Gene-sets obtained by functional enrichment of 25th percentile multiple sclerosis-associated genes expressed across all LECs’ RNA-seq datasets. g, Pie chart showing the proportion of AD-associated genes, for which the average expression across all LECs’ RNA-seq datasets was in the top 2nd, 5th, 10th, or 25th percentile out of all genes. h, Heatmap showing the log2-normalized expression values (depicted in the color scale bar) for AD-associated genes whose average expression values fall within the top 2nd percentile of all genes expressed across all LECs’ RNA-seq datasets. i, Gene-sets obtained by functional enrichment of 25th percentile AD-associated genes expressed across the different LECs’ RNA-seq datasets. Data in a-i consists of n = 2 or 3 per group; individual RNA samples result from LECs pooled from 10 mice; genes used in a-i resulted from RNA-seq datasets obtained from LECs isolated from diaphragm, ear skin and meninges at 2–3 months (m.), from meninges at 2–3 or 20–24 months, from meninges at 20–24 months after injections with AAV1-CMV-eGFP (eGFP) or AAV1-CMV-mVEGF-C-WPRE (mVEGF-C, one month after i.c.m. injection − see methods for details) and from meninges of 6-month-old WT or 5xFAD mice (see Extended Data Fig. 1f–k for related data); in c, f and i the Benjamini-Hochberg correction was used to adjust the associated P-values (adj. P-values < 0.05) and the functional enrichment of differential expressed genes was determined with Fisher’s exact test. j, Pie charts showing the proportion of AD-associated genes, for which the average expression was in the top 2nd, 5th, 10th, or 25th percentile out of all genes in each cluster of brain blood endothelial cells (BECs): capillary BECs 1, capillary BECs 2, arterial BECs and venous BECs. k, Heatmap showing the expression values for AD-associated genes whose average expression values fall within the top 2nd percentile of all genes expressed in each cluster of BECs. l, The transcriptome of myeloid cells (live CD45+Ly6GCD11b+ cells) sorted from the brain cortex of 5.5-month-old 5xFAD mice was analyzed by single-cell RNA-seq (scRNA-seq, see methods for more details). The graph shows the unsupervised clustering and tSNE representation of four distinct clusters of microglia (Mg). m, Pie charts showing the proportion of AD-associated genes, for which the average expression was in the top 2nd, 5th, 10th, or 25th percentile out of all genes in each Mg cluster. n, Heatmap showing the expression values for AD-associated genes whose average expression values fall within the top 2nd percentile of all genes expressed in each Mg cluster. o, Venn diagram showing the overlap between AD-associated genes in the top 10th percentile for meningeal LECs (mLECs), brain BECs (bBECs) and Mg. Data in j and k resulted from the analysis of a scRNA-seq dataset published by Vanlandewijck et al; data in l-n resulted from the scRNA-seq analysis of 651 microglia; in k and n, scale bars represent log2-normalized expression values.
Extended Data Figure 10 |
Extended Data Figure 10 |. Integrative analyses of gene expression profiles of microglia from the brain of 5xFAD mice with intact or ablated meningeal lymphatics and from the human brain.
a, Representation of the tSNE plots showing the segregation of microglia from human donors or 5xFAD mice by groups (dashed line represents the approximate boundaries between microglial clusters) upon cross-species RNA-seq data integration and analysis (see also Fig. 3b). b, c, Violin plots with expression levels of the b) pan-microglial genes ELMO1, MALAT1 and MEF2A, homeostatic genes P2RY12, P2RY13 and TMEM119, and c) activation genes CD83, CST3, JUN, LGMN, LPL and TNFAIP3 in the different human microglial clusters. d, Dot plot depicting the average scaled expression levels of specific genes (in the x axis), as well as the percentage of gene-expressing 5xFAD microglia within each cluster. Data in a-d are related to Fig. 3b–g and were obtained from the integrated analysis of a total of 5,462 non-AD, 618 presymptomatic AD, 4,548 familial AD and 6,461 sporadic AD microglia (single-nucleus RNA-seq data) from human brain parietal lobes, and from a total of 781 and 770 microglia (scRNA-seq data) from the brains of 5xFAD mice of the Vis. plus mIgG and the Vis./photo. plus mIgG groups, respectively.
Figure 1 |
Figure 1 |. Compromised meningeal lymphatic function in 5xFAD mice limits brain Aβ clearance by chimeric murine Aducanumab and modulates the microglial and neurovascular responses.
a, Experimental scheme involving 2-month-old male 5xFAD mice (behavior testing in Extended Data Fig. 4); intra-cisterna magna (i.c.m.), intraperitoneal (i.p.), Visudyne plus photoconversion (Vis./photo.) or without photoconversion (Vis.). b, Representative images of brain stained for Aβ (red, with D54D2 antibody) and LAMP1 (green; scale bars, 1 mm). c-e, Graphs showing c) number of Aβ plaques per mm2, d) Aβ coverage and e) LAMP1 coverage. f, Representative images of brain stained for Aβ (blue, with Amilo-Glo), fibrinogen (grey), IBA1 (green) and CD68 (red; scale bars, 100 μm). g-j, Graphs showing g) IBA1 coverage, h) peri-Aβ IBA1+ cells, i) percentage of IBA1 occupied by CD68 and j) fibrinogen coverage. Results in c-e and g-j are presented as mean ± s.e.m.; n = 10 in Vis. groups and n = 9 in Vis./photo. groups; in c, e and g-j, two-way ANOVA with Holm-Sidak’s multiple comparisons test; in d, two-tailed unpaired Student’s T test; data in a-j is representative of one experiment; see Extended Data Fig. 3f–q for similar data using chimeric mAb158. k, Transcriptomes of enriched brain cells analyzed by single-cell RNA-seq. t-Distributed stochastic neighbor embedding (tSNE) plot highlighting microglia (in green). l, Volcano plot with significantly down-regulated and up-regulated genes in microglia from Vis./photo. plus mIgG versus Vis. plus mIgG. m, Top ten up-regulated GO terms. Data in k-m resulted from a single experiment (see also Extended Data Fig. 6); differentially expressed genes plotted in l were determined using a F-test with adjusted degrees of freedom based on weights calculated per gene with a zero-inflation model and Benjamini-Hochberg adjusted P-values; Gene Ontology analyses used over-representation test and scale bars in m represent Benjamini-Hochberg adjusted P-values for each pathway.
Figure 2 |
Figure 2 |. Combining mVEGF-C with immunotherapy reprograms the hippocampal transcriptional profile and shapes the microglial and neurovascular responses in aged APPswe mice.
a, Aged male APPswe mice (22–26 months old) were treated with AAV1 expressing enhanced green fluorescent protein (eGFP) or murine VEGF-C (mVEGF-C), combined with mIgG or mAducanumab (regimen in Extended Data Fig. 7r). The right hippocampus was dissected (3 mice per group) and total RNA was isolated, purified and sequenced. b, Principal component analysis (PCA) plot. c, Top ten up-regulated GO terms for highlighted group comparison. d, e, Heatmaps depicting the d) dendrite development (GO:0016358) and e) protein folding (GO:0006457) gene pathways. Data in a-e result from a single experiment; PCA in b computed with singular value decomposition; Gene Ontology analyses used over-representation test and scale bar in c represents Benjamini-Hochberg adjusted P-values for each pathway; heatmaps in d and e depict counts-per-million normalized expression minus per-gene mean expression. f, Transcriptomes of enriched brain cells analyzed by single-cell RNA-seq. g, tSNE representation highlighting identified brain cell clusters. h, i, Volcano plots with significantly down-regulated and up-regulated genes in h) microglia or i) capillary BECs from Vis./photo. plus mIgG versus Vis. plus mIgG. j, k, Ten up-regulated Gene Ontology terms (selected from top 20 terms) in j) microglia or k) capillary BECs. Data in f-k resulted from a single experiment (see also Extended Data Fig. 8n–t); differentially expressed genes plotted in h and i were determined using a F-test with adjusted degrees of freedom based on weights calculated per gene with a zero-inflation model and Benjamini-Hochberg adjusted P-values; Gene Ontology analyses used over-representation test and scale bars in j and k represent Benjamini-Hochberg adjusted P-values for each pathway.
Figure 3 |
Figure 3 |. Gene-set analysis uncovers a link between impaired meningeal lymphatic vasculature and microglial activation in Alzheimer’s disease.
a, Single nucleotide polymorphisms in the 1 Mb region of genes highly expressed in meningeal LECs are in cis-expression quantitative expression loci (cis-eQTL) in microglia from the parietal cortex of human brains (non-AD and sporadic AD cases only). Violin plots with the distribution of gene expression and the first, median and third quantiles depicted for each genotype. b, tSNE plots showing the segregation of microglia from human donors or 5xFAD mice into 5 distinct clusters upon cross-species RNA-seq data integration and analysis (see also Extended Data Fig. 10). c, d, Violin plots with expression levels of c) homeostatic genes and d) activation genes in the different human microglia clusters. e, Graph showing the cluster proportions in the human non-AD, presymptomatic AD, familial AD, sporadic AD microglia groups, and in the 5xFAD mouse Vis. plus mIgG and Vis./photo. plus mIgG microglia groups. Statistically significant differences were observed between the Vis. plus mIgG and Vis./photo. plus mIgG groups regarding the proportions of microglia clusters 1 (P = 0.00026), 2 (P = 0.00191) and 3 (P = 0.03535). f, tSNE representation of the scaled average expression (range in scale bar) of the module of 54 human gene orthologs of the 5xFAD microglial gene signature of meningeal lymphatic dysfunction, subtracted by an aggregated expression of randomly chosen control feature gene-sets. g, Violin plot showing each microglia cluster’s signature score obtained by partial residuals from linear mixed models. Data in b-g were obtained from the integrated analysis of a total of 5,462 non-AD, 618 presymptomatic AD, 4,548 familial AD and 6,461 sporadic AD microglia (single-nucleus RNA-seq data) from human brain parietal lobes, and from a total of 781 and 770 microglia (single-cell RNA-seq data) from the brains of 5xFAD mice of the Vis. plus mIgG and the Vis./photo. plus mIgG groups, respectively; results involving human microglia were corrected for age of death, sex and disease status; statistically significant differences were calculated by two-proportion Z-test in e and by linear mixed models in g (individual comparisons between the score in cluster 1 and the other scores).

Similar articles

Cited by

References

    1. Jack CR Jr. et al. NIA-AA Research Framework: Toward a biological definition of Alzheimer’s disease. Alzheimers Dement 14, 535–562, doi:10.1016/j.jalz.2018.02.018 (2018). - DOI - PMC - PubMed
    1. Mawuenyega KG et al. Decreased clearance of CNS beta-amyloid in Alzheimer’s disease. Science 330, 1774, doi:10.1126/science.1197623 (2010). - DOI - PMC - PubMed
    1. Tarasoff-Conway JM et al. Clearance systems in the brain--implications for Alzheimer diseaser. Nat Rev Neurol 12, 248, doi:10.1038/nrneurol.2016.36 (2016). - DOI - PubMed
    1. Sweeney MD, Sagare AP & Zlokovic BV Blood-brain barrier breakdown in Alzheimer disease and other neurodegenerative disorders. Nat Rev Neurol 14, 133–150, doi:10.1038/nrneurol.2017.188 (2018). - DOI - PMC - PubMed
    1. Da Mesquita S et al. Functional aspects of meningeal lymphatics in ageing and Alzheimer’s disease. Nature 560, 185–191, doi:10.1038/s41586-018-0368-8 (2018). - DOI - PMC - PubMed

Publication types

MeSH terms

Substances