. 2021 Apr 12:12:586788.
doi: 10.3389/fphar.2021.586788. eCollection 2021.

Xiaoyaosan Alleviates Hippocampal Glutamate-Induced Toxicity in the CUMS Rats via NR2B and PI3K/Akt Signaling Pathway

Affiliations

Xiaoyaosan Alleviates Hippocampal Glutamate-Induced Toxicity in the CUMS Rats via NR2B and PI3K/Akt Signaling Pathway

Xue-Ming Zhou et al. Front Pharmacol. .

Erratum in

Abstract

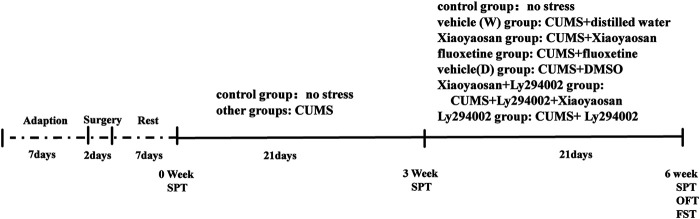
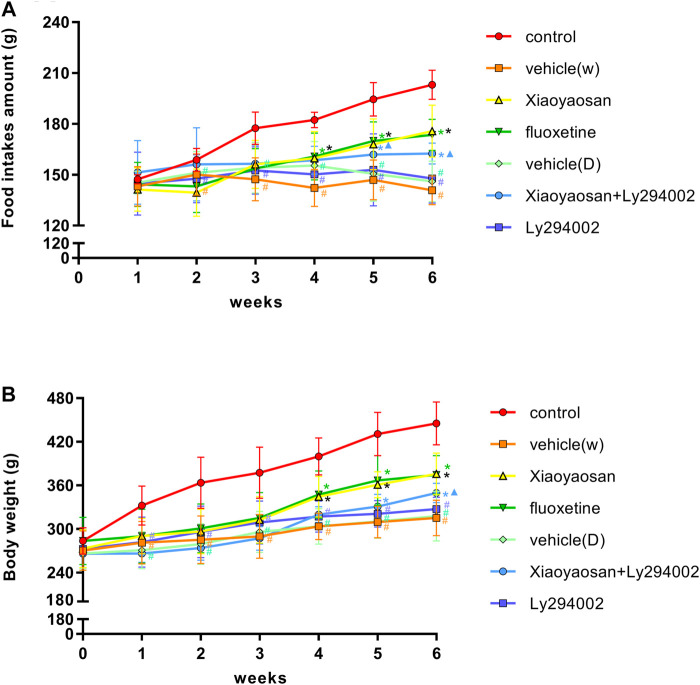
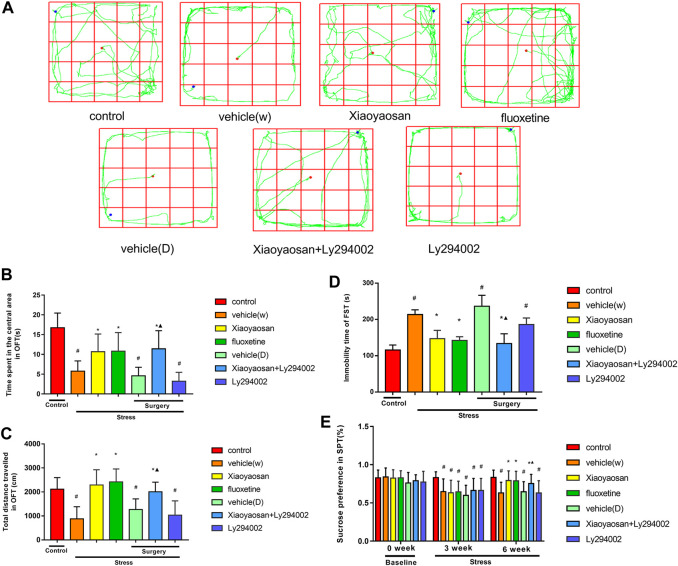
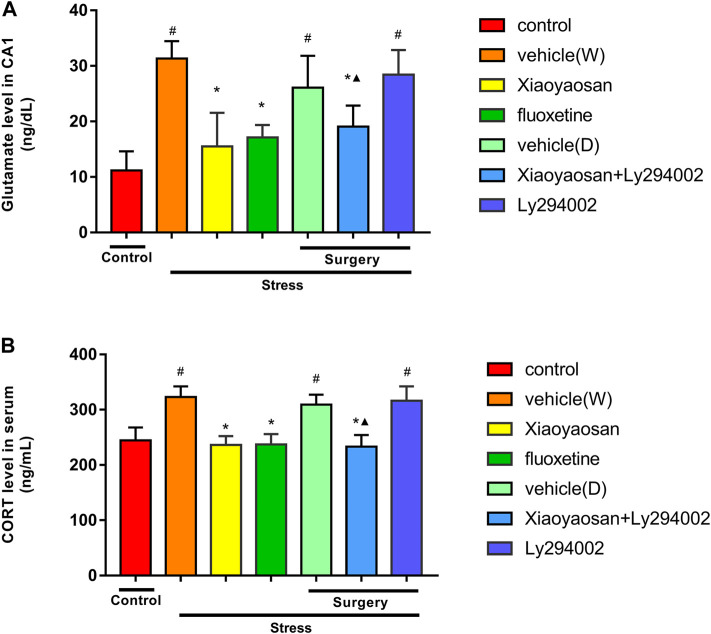
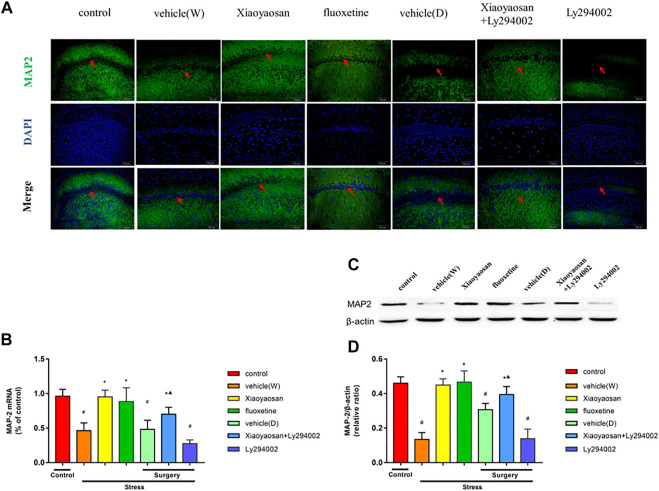
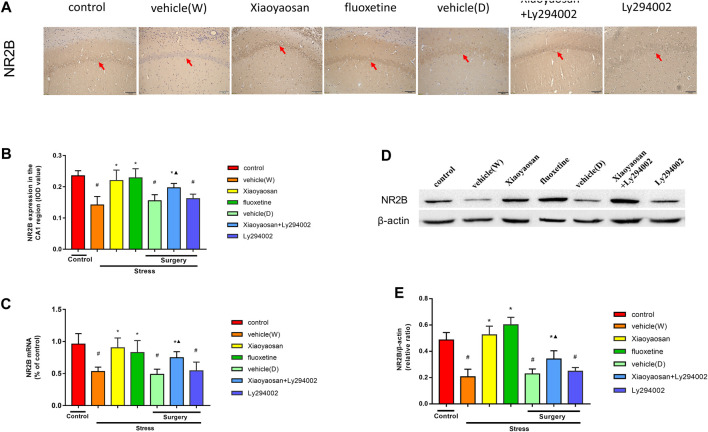
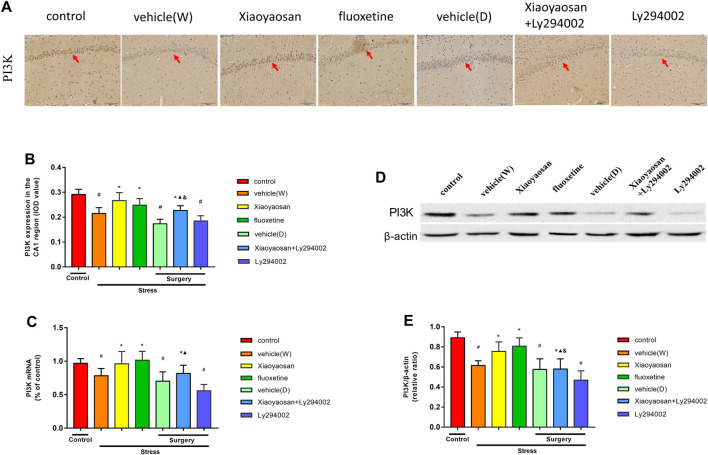
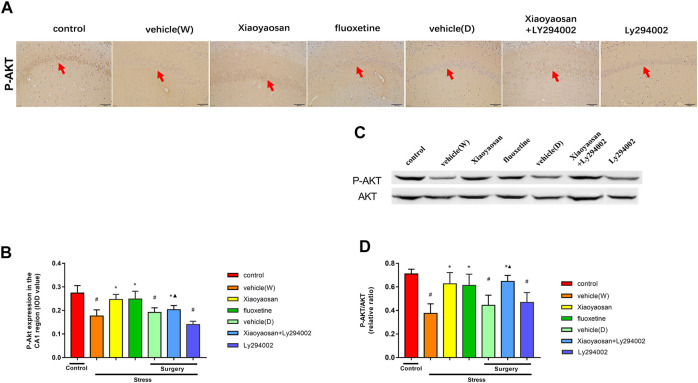
Purpose: It is revealed that Xiaoyaosan could reduce glutamate level in the hippocampus of depressed rats, whose metabolism leads to the pathophysiology of depression. However, the underlying mechanism remains unclear. This study aims to explore the effect of Xiaoyaosan on glutamate metabolism, and how to regulate the excitatory injury caused by glutamate. Methods: Rats were induced by chronic unpredictable mild stress, then divided into control, vehicle (distilled water), Xiaoyaosan, fluoxetine, vehicle (DMSO), Xiaoyaosan + Ly294002 and Ly294002 groups. Ly294002 was microinjected into the lateral ventricular catheterization at 5 mM. Xiaoyaosan (2.224 g/kg) and fluoxetine (2.0 mg/kg) were orally administered for three weeks. The open field test (OFT), forced swimming test (FST), and sucrose preference test (SPT) were used to assess depressive behavior. The glutamate and corticosterone (CORT) levels were detected by ELISA. Western blot, immunochemistry or immunofluorescence were used to detect the expressions of NR2B, MAP2, PI3K and P-AKT/Akt in the hippocampal CA1 region. The mRNA level of MAP2, NR2B and PI3K were detected by RT-qPCR. Results: Compared to the rats in control group, body weight and food intake of CUMS rats was decreased. CUMS rats also showed depression-like behavior as well as down regulate the NR2B and PI3K/Akt signaling pathway. Xiaoyaosan treatments could increase food intake and body weight as well as improved time spent in the central area, total distance traveled in the OFT. Xiaoyaosan could also decrease the immobility time as well as increase the sucrose preference in SPT. Moreover, xiaoyaosan decreased the level of glutamate in the hippocampal CA1 region and serum CORT in CUMS rats. Furthermore, xiaoyaosan improved the expression of MAP2 as well as increased the expression of NR2B, PI3K and the P-AKT/AKT ratio in the hippocampal CA1 region in the CUMS rats. Conclusion: Xiaoyaosan treatment can exert the antidepressant effect by rescuing hippocampal neurons loss induced by the glutamate-mediated excitotoxicity in CUMS rats. The underlying pathway maybe through NR2B and PI3K/Akt signaling pathways. These results may suggest the potential of Xiaoyaosan in preventing the development of depression.

Keywords: NR2B, PI3K/Akt pathway; depression; glutamate; hippocampal CA1 region; xiaoyaosan.


Conflict of interest statement

The authors declare that the research was conducted in the absence of any commercial or financial relationships that could be construed as potential conflicts of interest.

Figures

FIGURE 1
FIGURE 1
Timeline of the experiment. Before the experiment, the animals were allowed a 7-days adaptation period. The rats in the surgery groups underwent lateral ventricular catheterization and were allowed to recover for one week. Except for the control group, the rats in the other groups were subjected to CUMS for 6 weeks and treated with different drugs from the fourth week to the sixth week. The body weights and food intake levels were monitored weekly. A SPT was performed on day 0 (baseline SP test), day 21 and day 41. The OFT and FST were performed in week 6. Then, the rats were sacrificed for further detection.
FIGURE 2
FIGURE 2
Changes in the body weight and food intake of the CUMS rats. (A) Changes in food intake from week one1 to week 6. (B) Changes in body weight from week 0 to week 6. The data are expressed as the mean ± SD. #p < 0.05 compared to the control group; *p < 0.05 compared to the vehicle (W) group; ▲p < 0.05 compared to the Ly294002 group, n = =18.
FIGURE 3
FIGURE 3
Xiaoyaosan ameliorates CUMS rat depression-like behaviors (A) Movement trajectory of each group of rats (B) Time spent in the central area in the OFT by the rats in each group (C) Total distance traveled within 5 min in the OFT by the rats in each group (D) Immobility time in the FST of the rats in each group (E) Sucrose preference in the SPT of the rats in each group in weeks 0, three and 6. All data are expressed as the mean ± SD. #p < 0.05 compared to the control group; *p < 0.05 compared to the vehicle (W) group; ▲p < 0.05 compared to the Ly294002 group, n = 18.
FIGURE 4
FIGURE 4
Levels of glutamate in the hippocampal CA1 area (A) and CORT in the serum (B) in the treatment and control groups of rats. The data are expressed as the mean ± SD. #p < 0.05 compared to the control group; *p < 0.05 compared to the vehicle (W) group; ▲p < 0.05 compared to the Ly294002 group, n = 6.
FIGURE 5
FIGURE 5
Xiaoyaosan elevates the expression of MAP2 in the hippocampal CA1 region of CUMS rats (A, original magnifification, ×200) Xiaoyaosan and Xiaoyaosan + Ly294002 promoted MAP2 expression in the CUMS rats. The green color represents MAP2 staining, and the blue color represents nuclear staining (C) Representative images and western blot analysis (D) of western blot assay showing the relative expression of MAP2 (B) Level of MAP2 mRNA in the hippocampal CA1 area of the rats in the treatment and control groups. All data are expressed as the mean ± SD. # p < 0.05 compared to the control group; * p < 0.05 compared to the vehicle (W) group; p < 0.05 compared to the Ly294002 group, n = 6.
FIGURE 6
FIGURE 6
Xiaoyaosan elevates the expression of NR2B in the hippocampal CA1 region of CUMS rats (A) Representative micrographs of immunohistochemical staining (sections were counterstained with hematoxylin; original magnification, ×200) and (B) quantitative analysis showing the expression of NR2B in the hippocampal CA1 region (C) NR2B mRNA level in the hippocampal CA1 region (D) Representative images and western blot analysis (E) of western blot assay showing the relative expression of NR2B in the hippocampal CA1 region. All data are expressed as the mean ± SD. #p < 0.05 compared to the control group; *p < 0.05, compared to the vehicle (W) group; ▲p < 0.05 compared to the Ly294002 group, n = 6.
FIGURE 7
FIGURE 7
Xiaoyaosan elevates the expression of PI3K in the hippocampal CA1 region of CUMS rats (A) Representative micrographs of immunohistochemical staining (sections were counterstained with hematoxylin; original magnification, ×200) and (B) quantitative analysis showing the expression of PI3K in the hippocampal CA1 region (C) Level of PI3K mRNA in the hippocampal CA1 region (D) Representative images and western blot analysis (E) of western blot assay showing the relative expression of PI3K in the hippocampal CA1 region. All data are expressed as the mean ± SD. #p < 0.05 compared to the control group; *p < 0.05, compared to the vehicle (W) group; ▲p < 0.05 compared to the Ly294002 group; & p < 0.05 compared to the Xiaoyaosan group, n = 6.
FIGURE 8
FIGURE 8
Xiaoyaosan elevates the expression of P-AKT/AKT in the hippocampal CA1 region of CUMS rats P-AKT/AKT in the hippocampal CA1 region of CUMS rats (A) Representative micrographs of immunohistochemical staining (sections were counterstained with hematoxylin; original magnifification, ×200) and (B) quantitative analysis showing the expression of P-AKT in the hippocampal CA1 region (C). Representative images and western blot analysis (D) of western blot assay showing the relative expression ratio of P-AKT/AKT in the hippocampal CA1 region. All data are expressed as the mean ± SD. # p < 0.05 compared to the control group; * p < 0.05, compared to the vehicle (W) group; p < 0.05 compared to the Ly294002 group, n = 6.

References

    1. Abdel-Rahman A., Abou-Donia S., El-Masry E., Shetty A., Abou-Donia M. (2004). Stress and combined exposure to low doses of pyridostigmine bromide, DEET, and permethrin produce neurochemical and neuropathological alterations in cerebral cortex, hippocampus, and cerebellum. J. Toxicol. Environ. Health Part A 67, 163–192. 10.1080/15287390490264802 - DOI - PubMed
    1. Autry A. E., Adachi M., Nosyreva E., Na E. S., Los M. F., Cheng P. F., et al. (2011). NMDA receptor blockade at rest triggers rapid behavioural antidepressant responses. Nature 475, 91–95. 10.1038/nature10130 - DOI - PMC - PubMed
    1. Bartsch T., Döhring J., Rohr A., Jansen O., Deuschl G. (2011). CA1 neurons in the human hippocampus are critical for autobiographical memory, mental time travel, and autonoetic consciousness. Proc. Natl. Acad. Sci. U. S. A. 108, 17562–17567. 10.1073/pnas.1110266108 - DOI - PMC - PubMed
    1. Belovicova K., Bogi E., Csatlosova K., Dubovicky M. (2017). Animal tests for anxiety-like and depression-like behavior in rats. Interdiscip. Toxicol. 10, 40–43. 10.1515/intox-2017-0006 - DOI - PMC - PubMed
    1. Bersani G., Liberati D., Rasa A., Polli E., Ciuffa M., Limpido L., et al. (2010). Premorbid sleep, appetite, energy, and cognitive circadian profile in patients with depressive disorders. Eur. Psychiatry 25, 461–464. 10.1016/j.eurpsy.2010.01.002 - DOI - PubMed

LinkOut - more resources