

Prognostic Modeling of Patients Undergoing Surgery Alone for Esophageal Squamous Cell Carcinoma: A Histopathological and Computed Tomography Based Quantitative Analysis
- PMID: 33912439
- PMCID: PMC8072145
- DOI: 10.3389/fonc.2021.565755
Prognostic Modeling of Patients Undergoing Surgery Alone for Esophageal Squamous Cell Carcinoma: A Histopathological and Computed Tomography Based Quantitative Analysis
Abstract
Objective: To evaluate the effectiveness of a novel computerized quantitative analysis based on histopathological and computed tomography (CT) images for predicting the postoperative prognosis of esophageal squamous cell carcinoma (ESCC) patients.
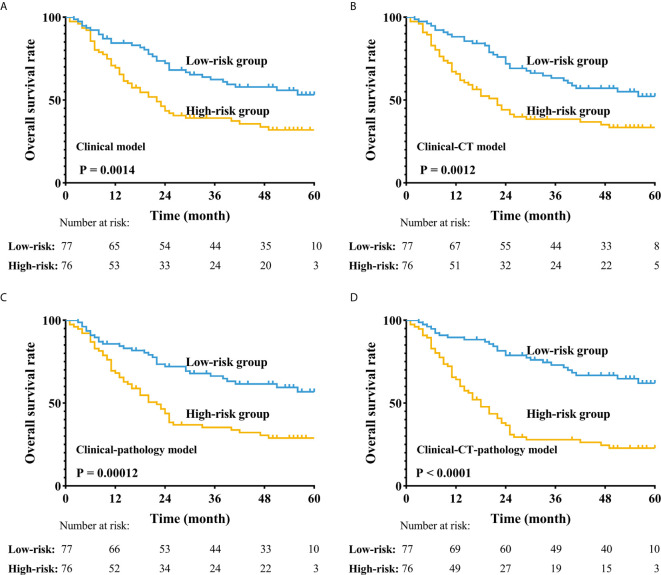
Methods: We retrospectively reviewed the medical records of 153 ESCC patients who underwent esophagectomy alone and quantitatively analyzed digital histological specimens and diagnostic CT images. We cut pathological images (6000 × 6000) into 50 × 50 patches; each patient had 14,400 patches. Cluster analysis was used to process these patches. We used the pathological clusters to all patches ratio (PCPR) of each case for pathological features and we obtained 20 PCPR quantitative features. Totally, 125 computerized quantitative (20 PCPR and 105 CT) features were extracted. We used a recursive feature elimination approach to select features. A Cox hazard model with L1 penalization was used for prognostic indexing. We compared the following prognostic models: Model A: clinical features; Model B: quantitative CT and clinical features; Model C: quantitative histopathological and clinical features; and Model D: combined information of clinical, CT, and histopathology. Indices of concordance (C-index) and leave-one-out cross-validation (LOOCV) were used to assess prognostic model accuracy.
Results: Five PCPR and eight CT features were treated as significant indicators in ESCC prognosis. C-indices adjusted for LOOCV were comparable among four models, 0.596 (Model A) vs. 0.658 (Model B) vs. 0.651 (Model C), and improved to 0.711with Model D combining information of clinical, CT, and histopathology (all p<0.05). Using Model D, we stratified patients into low- and high-risk groups. The 3-year overall survival rates of low- and high-risk patients were 38.0% and 25.0%, respectively (p<0.001).
Conclusion: Quantitative prognostic modeling using a combination of clinical data, histopathological, and CT images can stratify ESCC patients with surgery alone into high-risk and low-risk groups.
Keywords: esophageal cancer; medical images; prognosis; quantitative analysis; survival model.
Copyright © 2021 Wu, Wang, Huang, Liu, Huang, Zeng, Cui, Lu, Lin, Long, Zhang, Wei, Lu and Ma.
Conflict of interest statement
The authors declare that the research was conducted in the absence of any commercial or financial relationships that could be construed as a potential conflict of interest.
Figures


References
LinkOut - more resources
Full Text Sources
Other Literature Sources