. 2021 Feb 3;6(4):1066-1080.
doi: 10.1016/j.ekir.2021.01.025. eCollection 2021 Apr.

The Role of Glomerular Epithelial Injury in Kidney Function Decline in Patients With Diabetic Kidney Disease in the TRIDENT Cohort

Affiliations

The Role of Glomerular Epithelial Injury in Kidney Function Decline in Patients With Diabetic Kidney Disease in the TRIDENT Cohort

Matthew B Palmer et al. Kidney Int Rep. .

Abstract

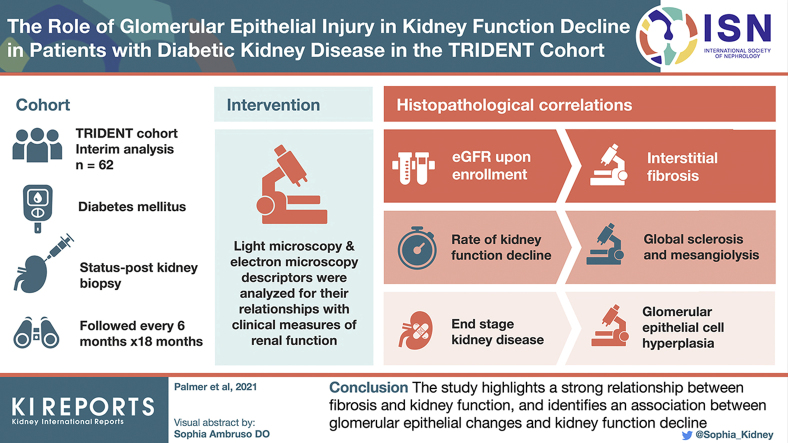
Introduction: Although diabetic kidney disease (DKD) is responsible for more than half of all chronic and end-stage kidney disease (ESKD), the association of light (LM) and electron microscopic (EM) structural changes with clinical parameters and prognosis in DKD is incompletely understood.

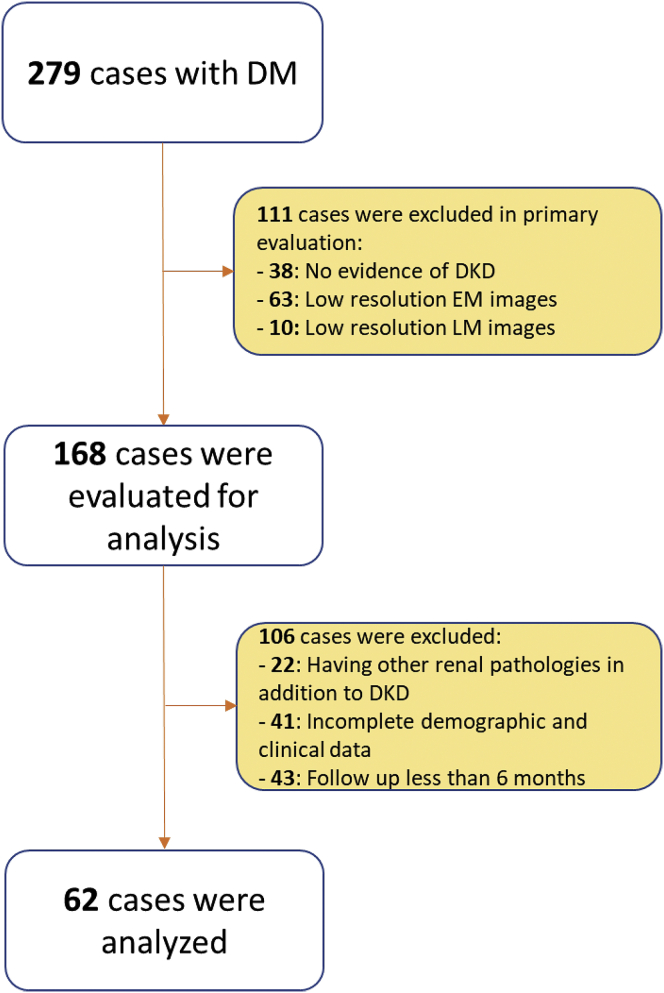
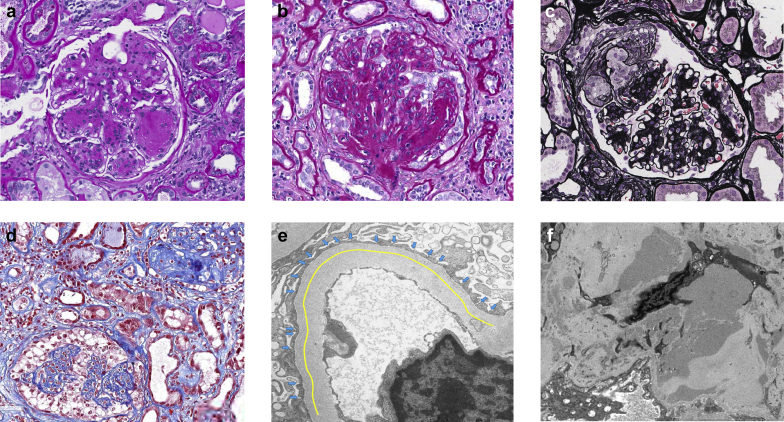
Methods: This is an interim analysis of 62 patients diagnosed with biopsy-confirmed DKD from the multicenter TRIDENT (Transformative Research in Diabetic Nephropathy) study. Twelve LM and 8 EM descriptors, representing changes in glomeruli, tubulointerstitium, and vasculature were analyzed for their relationship with clinical measures of renal function. Patients were followed every 6 months.

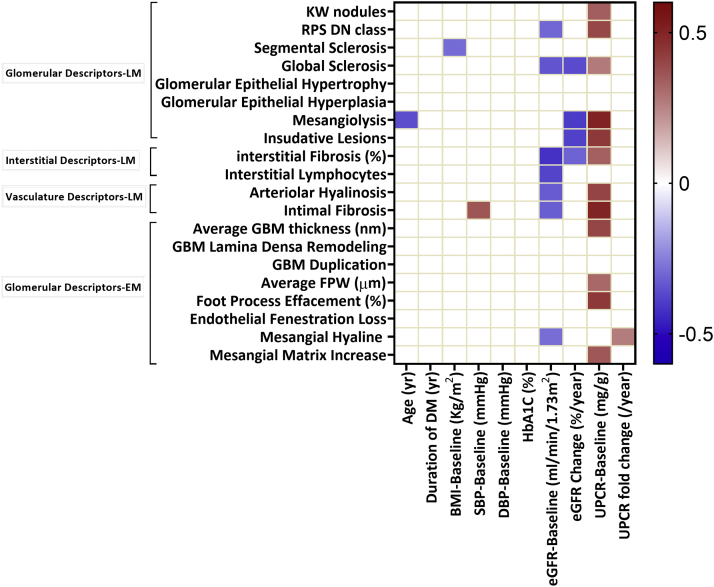
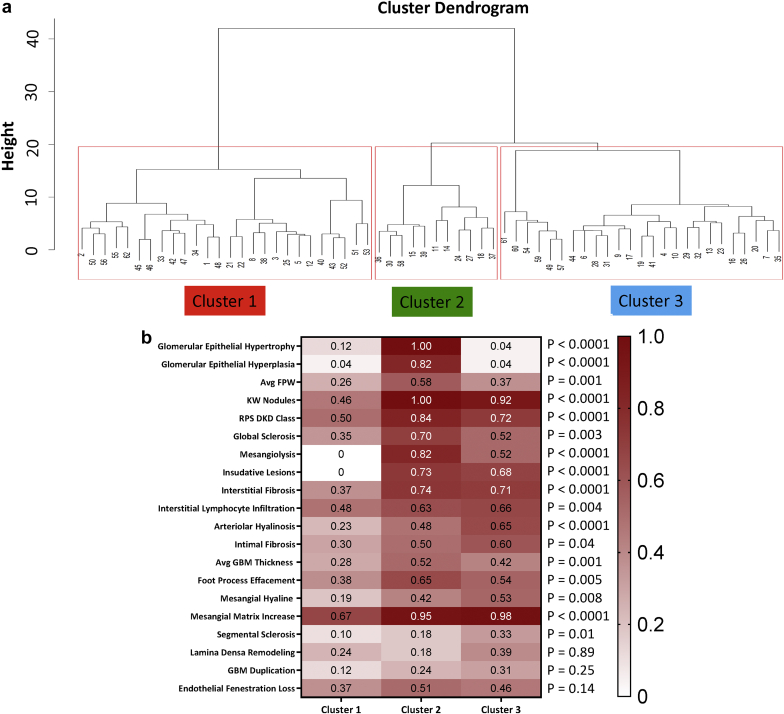
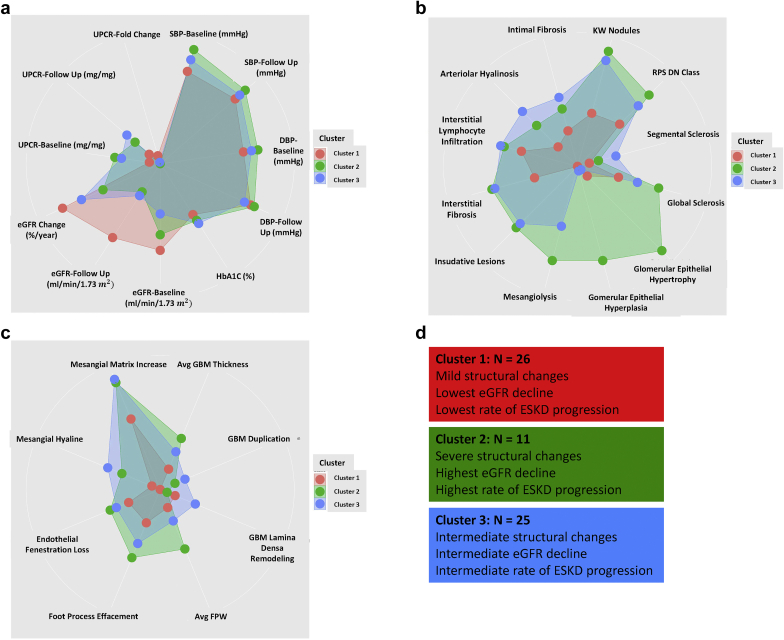
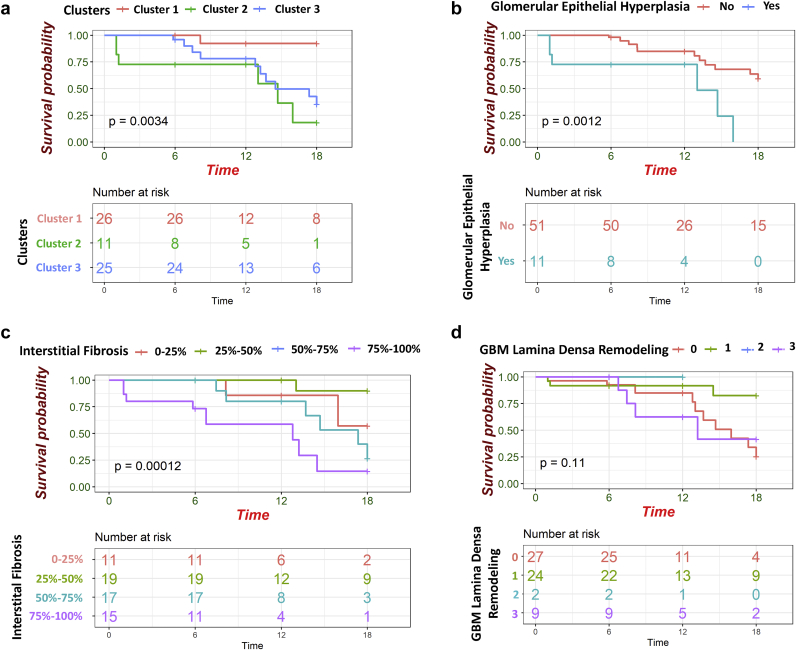
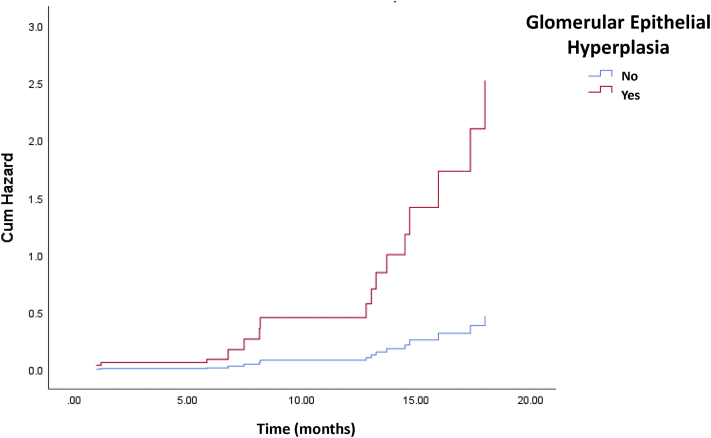
Results: Multivariable linear regression analysis revealed that estimated glomerular filtration rate (eGFR) upon enrollment correlated the best with interstitial fibrosis. On the other hand, the rate of kidney function decline (eGFR slope) correlated the most with glomerular lesions including global glomerulosclerosis and mesangiolysis. Unbiased clustering analysis based on histopathologic data identified 3 subgroups. The first cluster, encompassing subjects with the mildest histologic lesions, had the most preserved kidney function. The second and third clusters had similar degrees of kidney dysfunction and structural damage, but differed in the degree of glomerular epithelial cell and podocyte injury (podocytopathy DKD subtype). Cox proportional hazard analysis showed that subjects in cluster 2 had the highest risk to reach ESKD (hazard ratio: 17.89; 95% confidence interval: 2.13-149.79). Glomerular epithelial hyperplasia and interstitial fibrosis were significant predictors of ESKD in the multivariate model.

Conclusion: The study highlights the association between fibrosis and kidney function and identifies the role of glomerular epithelial changes and kidney function decline.

Keywords: diabetic kidney disease; end-stage kidney disease; glomerular epithelial injury; kidney function; pathological descriptors.


Figures

None
Graphical abstract
Figure 1
Figure 1
Patients’ selection for the analysis. DKD, diabetic kidney disease; DM, diabetes mellitus; EM, electron microscopy; LM, light microscopy.
Figure 2
Figure 2
Illustrations of some LM and EM lesions scored in the study. (a) Kimmelstiel-Wilson nodules defined as nodular mesangial sclerosis with hypocellular center (periodic acid-Schiff [PAS], original magnification ×400). (b) Glomerular epithelial hypertrophy and hyperplasia with enlarged epithelial cells forming at least 2 layers (PAS, original magnification ×400). These podocyte changes may be present in the form of podocytopathic lesions such as (c) tip lesions or (d) collapsing lesions (Jones silver, original magnification ×400, and trichrome, original magnification ×200, respectively). (e) Mean foot process width was measured by dividing the length of a segment of filtering capillary wall (yellow line) by the number of podocyte filtration slits (blue arrows) (electron micrograph, original magnification ×12,000). (f) Mesangial hyaline defined as deposits of fine, uniform, moderately electron-dense material lacking sharp edges (electron micrograph, original magnification ×6000). EM, electron microscopy; LM, light microscopy.
Figure 3
Figure 3
Correlation analysis between LM and EM descriptors and demographic and clinical parameters. Only significant correlations are shown. The color represents the strength and direction of the correlation. BMI, body mass index; DBP, diastolic blood pressure; eGFR, estimated glomerular filtration rate; EM, electron microscopy; FPW, foot process width; GBM, glomerular basement membrane; HbA1C, hemoglobin A1C; KW, Kimmelstiel-Wilson Nodule; LM, light microscopy; RPS DN class, Renal Pathology Society diabetic nephropathy class; SBP, systolic blood pressure; UPCR, urine protein to creatinine ratio.
Figure 4
Figure 4
Histopathology-based clustering. (a) Hierarchical clustering dendrogram defines 3 distinct subgroups. (b) Heat map of scaled mean descriptors in the 3 clusters. The color indicates the scale value. Data are shown in the order of differences between clusters. Avg FPW, average foot process width; Avg GBM, average glomerular basement membrane; KW, Kimmelstiel-Wilson nodule; RPS DN class, Renal Pathology Society diabetic nephropathy class. The P values obtained from 1-way analysis of variance test between groups.
Figure 5
Figure 5
Radar plots of clinical, LM, and EM characteristics in different clusters. Data are shown after scaling and each dot represents one characteristic and the lengths of the spokes show the scaled magnitude of the feature. Data are arranged based on discriminative features. Each cluster is represented by a specific color (red, cluster 1; green, cluster 2; and blue, cluster 3). (a) Clinical features. (b) Light microscopic descriptors. (c) Electron microscopic descriptors. (d) Summary of differences between clusters. Avg FPW, average foot process width; Avg GBM, average glomerular basement membrane; DBP, diastolic blood pressure; eGFR, estimated glomerular filtration rate; EM, electron microscopy; HbA1c, hemoglobin A1C; KW nodules, Kimmelstiel-Wilson nodules; LM, light microscopy; RPS DN class, Renal Pathology Society diabetic nephropathy class; SBP, systolic blood pressure; UPCR, urine protein to creatinine ratio.
Figure 6
Figure 6
The Kaplan-Meier plots of parameters reach to significant threshold in Cox proportional hazard analysis. (a) Patients in cluster 2 with severe pathological changes had the lowest renal survival rate. (b) patients with glomerular epithelial hyperplasia had lower renal survival rate. (c) Higher degree of interstitial fibrosis causes lower renal survival probability. (d) Kaplan-Meier plot of glomerular basement membrane (GBM) Lamina Densa remodeling in renal survival probability. To compare the renal survival probability between sub groups Log-rank test was used. Time was considered as months from renal biopsy.
Figure 7
Figure 7
Cox hazard ratio plot of glomerular epithelial hyperplasia in prediction of end-stage kidney disease (ESKD). The data obtained from multivariate Cox proportional hazard ratio analysis. X-axis shows the time and y-axis represents the cumulative hazard ratio. The status of glomerular epithelial hyperplasia is shown by different colors (No glomerular epithelial hyperplasia: blue; having glomerular epithelial hyperplasia: red).

References

    1. Wen C.P., Chang C.H., Tsai M.K. Diabetes with early kidney involvement may shorten life expectancy by 16 years. Kidney Int. 2017;92:388–396. - PubMed
    1. Fan W. Epidemiology in diabetes mellitus and cardiovascular disease. Cardiovasc Endocrinol. 2017;6:8. - PMC - PubMed
    1. Ameh O.I., Okpechi I.G., Agyemang C. Global, regional, and ethnic differences in diabetic nephropathy. In: Roelofs J.J., Vogy L., editors. Diabetic Nephropathy. Springer; Cham, Switzerland: 2019. pp. 33–44.
    1. Brosius F.C., 3rd, Alpers C.E., Bottinger E.P. Mouse models of diabetic nephropathy. J Am Soc Nephrol. 2009;20:2503–2512. - PMC - PubMed
    1. Igo R.P., Jr., Iyengar S.K., Nicholas S.B. Genomewide linkage scan for diabetic renal failure and albuminuria: the FIND study. Am J Nephrol. 2011;33:381–389. - PMC - PubMed