. 2021 Apr 26;5(5):e564.
doi: 10.1097/HS9.0000000000000564. eCollection 2021 May.

Ibrutinib Has Time-dependent On- and Off-target Effects on Plasma Biomarkers and Immune Cells in Chronic Lymphocytic Leukemia

Affiliations

Ibrutinib Has Time-dependent On- and Off-target Effects on Plasma Biomarkers and Immune Cells in Chronic Lymphocytic Leukemia

Tom A Mulder et al. Hemasphere. .

Abstract

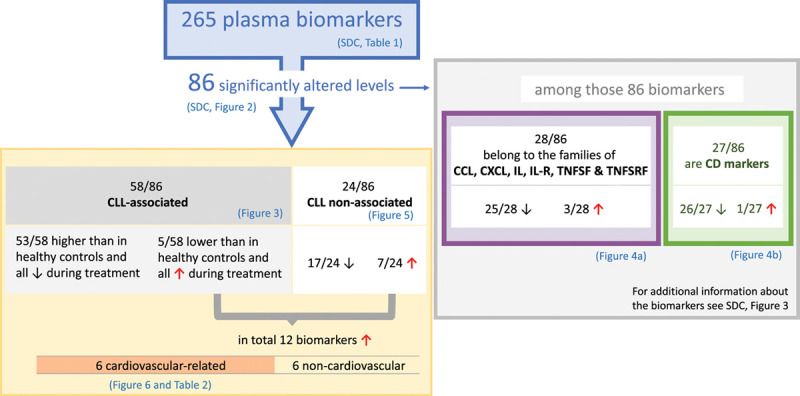
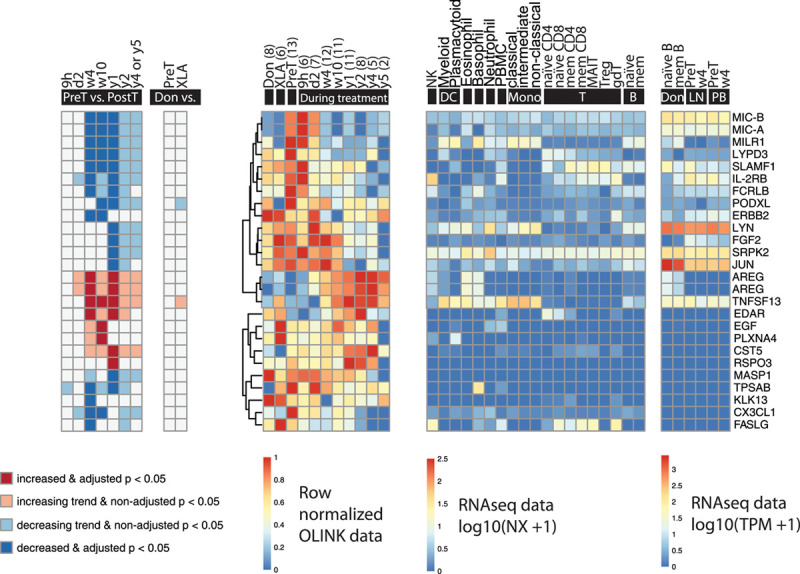
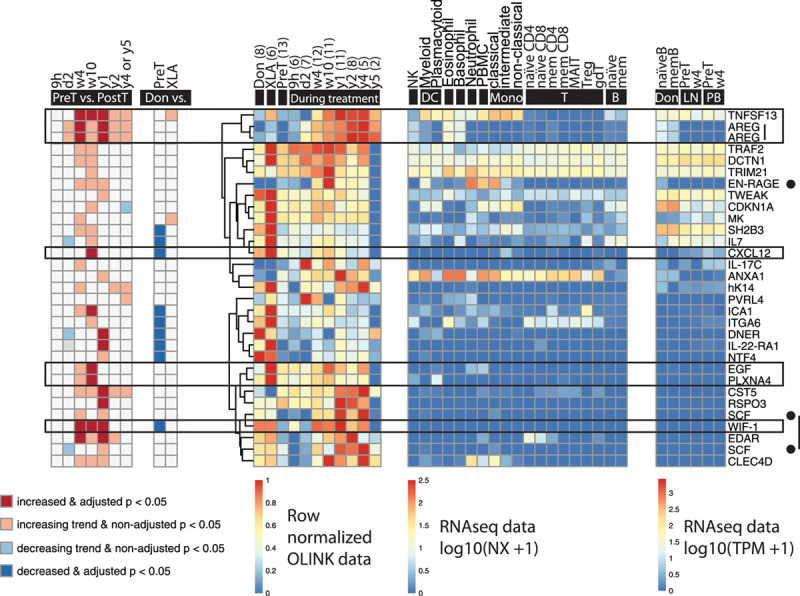
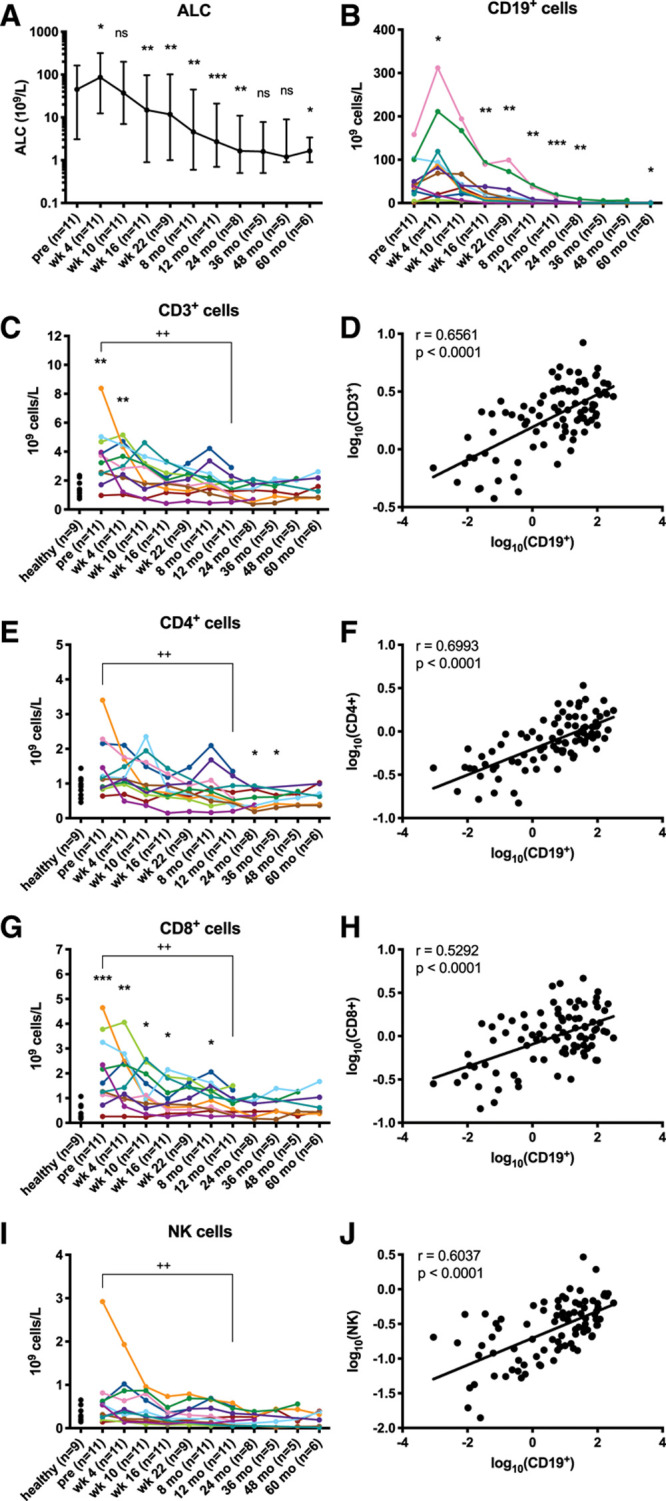
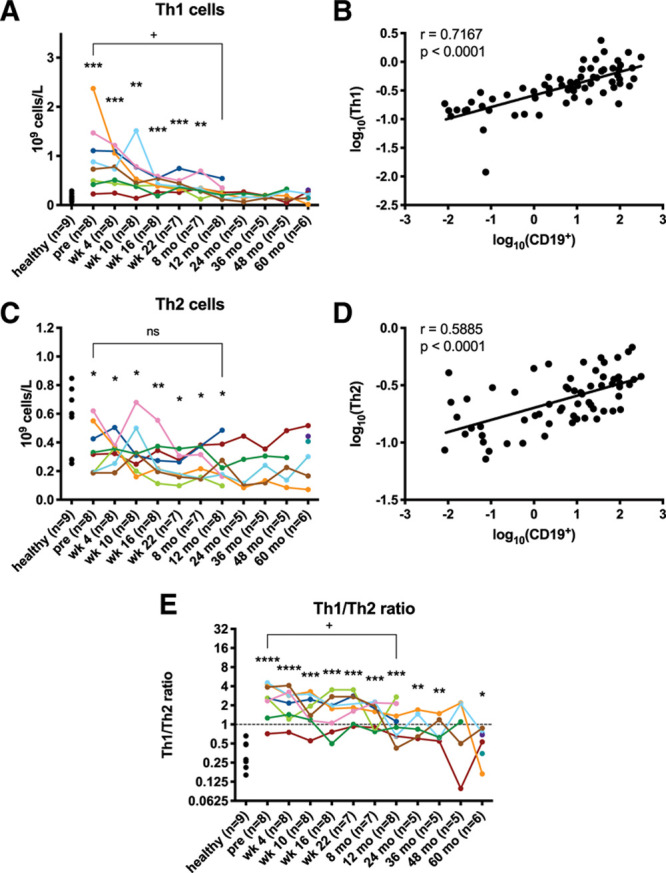
Ibrutinib is a covalently binding inhibitor of the B-cell receptor signaling-mediator Bruton's tyrosine kinase (BTK) with great efficacy in chronic lymphocytic leukemia (CLL). Common side effects like atrial fibrillation (AF), bleeding and infections might be caused by ibrutinib's inhibition of other kinases in non-B cells. Five-year follow-up of plasma biomarkers by proximity extension assay and immune cell numbers by flow cytometry during ibrutinib treatment revealed that 86 of the 265 investigated plasma biomarkers significantly changed during treatment, 74 of which decreased. Among the 12 markers that increased, 6 are associated with cardiovascular diseases and therefore potentially involved in ibrutinib-induced AF. Comparison between healthy donors and X-linked agammaglobulinemia (XLA) patients, who have nonfunctional BTK and essentially lack B cells, showed indicative changes in 53 of the 265 biomarkers while none differed significantly. Hence, neither B cells nor BTK-dependent pathways in other cells seem to influence the levels of the studied plasma biomarkers in healthy donors. Regarding immune cells, the absolute number of T cells, including subsets, decreased, paralleling the decreasing tumor burden. T helper 1 (Th1) cell numbers dropped strongly, while Th2 cells remained relatively stable, causing Th2-skewing. Thus, long-term ibrutinib treatment has a profound impact on the plasma proteome and immune cells in patients with CLL.


Figures

Figure 1.
Figure 1.
Treatment outcome and occurrence of infections and AF. Patients 01 and 07 already had AF before starting ibrutinib, while patients 06 and 10 developed AF after 3 and 55 mo of treatment, respectively. Colored dots indicate the timing and reason for discontinuation of follow-up. AF = atrial fibrillation; Allo-HCT = allogeneic hematopoietic cell transplantation; CR = complete response; G-CSF = granulocyte colony stimulating factor; PR = partial response.
Figure 2.
Figure 2.
Schematic representation of the analysis 265 biomarkers in plasma from patients with CLL before and after treatment with ibrutinib. Biomarkers were subdivided into CLL-associated and CLL nonassociated (left) and were further assembled into CD markers and other families of proteins (right). Only 12/86 markers increased, 8 of which were cardiovascular-related, and indicative of “off-target” effects. Among the 86 biomarkers, 4 do not belong to either the CLL-associated, or CLL nonassociated biomarkers, IFNLR1, IL-12B, TXLNA, and SEZ6L, but are indicatively downregulated. Among the 2 categories CD-marker and other protein families (right) some of these biomarkers belong to both groups. CLL = chronic lymphocytic leukemia.
Figure 3.
Figure 3.
Significantly changed CLL-associated molecules during ibrutinib treatment (n = 58). Biomarkers that were different between healthy donors and patients with CLL at baseline were regarded as CLL-associated. (Left to right) The first heat-map shows significance and increase or decrease of the biomarkers at different time points during treatment compared to pretreatment; the second shows the comparison between healthy donors (6 males and 3 females, median age 65 y, range 45–79; Don), patients with CLL before the start of ibrutinib treatment (PreT) and patients with XLA (XLA); the third shows the row-normalized Olink data; the fourth shows mRNA expression in different cell types, from healthy individuals for comparison (data from Uhlen et al); the fifth shows the mRNA expression in healthy donor and CLL B cells before and after 4 weeks of ibrutinib treatment in lymph nodes (LN) and peripheral blood (PB) (data from Palma et al). All RNA sequencing data has been published previously., IL10 and TGF-alpha are depicted twice because 2 different Olink probes were used to assess them. The number of data points (n) is indicated per time point. B = B cells; CLL = chronic lymphocytic leukemia; DC = dendritic cells; gdT = gamma delta T cells; MAIT = mucosal-associated invariant T cells; mem = memory; Mono = monocytes; NK = natural killer cells; T = T cells; Treg = regulatory T cells.
Figure 4.
Figure 4.
Timeline of plasma biomarkers that change during ibrutinib treatment. (A) Timeline for CCL proteins, CXCL proteins, ILs, IL-Rs, TNFSF, and TNFRSF members. (B) Timeline for CD molecules. Plasma biomarkers expressed by B cells are listed in green. Statistically significant changes in the plasma levels between the respective time points and pretreatment are depicted as a dark blue (decrease) or dark red (increase) bar with a thick arrow. Trends are depicted as a light blue (decreasing tendency) or light red (increasing tendency) bar with a thin arrow. CCL = chemokine ligand; CXCL12 = C-X-C motif chemokine ligand 12.
Figure 5.
Figure 5.
Significantly changed CLL nonassociated molecules during ibrutinib treatment (n = 24). Biomarkers that were not significantly different nor showed trends between healthy donors and patients at baseline were regarded as CLL nonassociated. (Left to right) The first heat-map shows significance and increase or decrease of the biomarkers at different time points during treatment compared to pretreatment; the second shows the comparison between healthy donors (6 males and 3 females, median age 65 y, range 45–79; Don), patients with CLL before the start of ibrutinib treatment (PreT) and patients with XLA (XLA); the third shows the row-normalized Olink data; the fourth shows mRNA expression in different cell types (data from Uhlen et al); the fifth shows the mRNA expression in healthy donor and CLL B cells before and after 4 wks of ibrutinib treatment in lymph nodes (LN) and peripheral blood (PB) (data from Palma et al). All RNA sequencing data has been published previously., MIC-A and MIC-B were assessed using the same Olink probe and therefore counted as one unique protein. AREG is depicted twice because 2 different Olink probes were used to assess it. The number of data points (n) is indicated per time point. B = B cells; CLL = chronic lymphocytic leukemia; DC = dendritic cells; gdT = gamma delta T cells; MAIT = mucosal-associated invariant T cells; mem = memory; Mono = monocytes; NK = natural killer cells; T = T cells; Treg = regulatory T cells.
Figure 6.
Figure 6.
Plasma biomarkers that increase during ibrutinib treatment (n = 29). Boxed biomarkers (n = 6) indicate those implicated in cardiovascular diseases. Biomarkers indicated by a black dot (n = 2) have also been related to cardiovascular diseases, but only show a trend toward increase. (Left to right) The first heat-map shows significance and increase or decrease of the biomarkers at different time points during treatment compared to pretreatment; the second shows the comparison between healthy donors (6 males and 3 females, median age 65 y, range 45–79; Don), patients with CLL before the start of ibrutinib treatment (PreT) and patients with XLA (XLA); the third shows the row-normalized Olink data; the fourth shows mRNA expression in different cell types (data from Uhlen et al); the fifth shows the mRNA expression in healthy donor and CLL B cells before and after 4 weeks of ibrutinib treatment in lymph nodes (LN) and peripheral blood (PB) (data from Palma et al). All RNA sequencing data have been published previously., AREG and SCF are depicted twice because two different Olink probes were used to assess them. The number of data points (n) is indicated per time point. B = B cells; CLL = chronic lymphocytic leukemia; DC = dendritic cells; gdT = gamma delta T cells; MAIT = mucosal-associated invariant T cells; mem = memory; Mono = monocytes; NK = natural killer cells; T = T cells; Treg = regulatory T cells.
Figure 7.
Figure 7.
Lymphocytes and subsets decrease along with a reduction in tumor burden. (A) ALC is depicted as median and range on a log10 scale and (B) absolute numbers of CD19+ cells are depicted on a linear scale. Stars indicate a statistically significant difference between pre-treatment and the respective time point as analyzed by Wilcoxon signed-rank tests. (C, E, G, and I) Absolute numbers of cells are depicted per patient. Plus signs indicate a statistically significant difference between pretreatment and the respective time point as analyzed by Wilcoxon signed-rank tests. Stars indicate a statistically significant difference between healthy donors (6 males and 3 females, median age 65 y, range 45–79) and the respective time point as analyzed by Mann-Whitney U tests. (D, F, H, and J) Log10-transformed absolute cell numbers from all individual patient time points are depicted and lines indicate the linear regression of the X and Y variables. r indicates the Pearson correlation coefficient. *P < 0.05, **/++P < 0.005, ***P < 0.0005. ALC = absolute lymphocyte count; ns = not significant; pre = pretreatment.
Figure 8.
Figure 8.
Th1 cell numbers decrease, causing Th2-skewing. (A, C, and E) Absolute numbers of cells are depicted per patient. Plus signs indicate a statistically significant difference between pretreatment and the respective time point as analyzed by Wilcoxon signed-rank tests. Stars indicate a statistically significant difference between healthy donors (6 males and 3 females, median age 65 y, range 45–79) and the respective time point as analyzed by Mann-Whitney U tests. (B and D) Log10-transformed absolute cell numbers from all individual patient time points are depicted and lines indicate the linear regression of the X and Y variables. r indicates the Pearson correlation coefficient. */+P < 0.05, **P < 0.005, ***P < 0.0005, ****P < 0.0001.

Similar articles

Cited by

References

    1. Riches JC, Davies JK, McClanahan F, et al. . T cells from CLL patients exhibit features of T-cell exhaustion but retain capacity for cytokine production. Blood. 2013; 121:1612–1621 - PMC - PubMed
    1. Honigberg LA, Smith AM, Sirisawad M, et al. . The Bruton tyrosine kinase inhibitor PCI-32765 blocks B-cell activation and is efficacious in models of autoimmune disease and B-cell malignancy. Proc Natl Acad Sci U S A. 2010; 107:13075–13080 - PMC - PubMed
    1. Ortolano S, Hwang IY, Han SB, et al. . Roles for phosphoinositide 3-kinases, Bruton’s tyrosine kinase, and Jun kinases in B lymphocyte chemotaxis and homing. Eur J Immunol. 2006; 36:1285–1295 - PubMed
    1. de Gorter DJ, Beuling EA, Kersseboom R, et al. . Bruton’s tyrosine kinase and phospholipase Cgamma2 mediate chemokine-controlled B cell migration and homing. Immunity. 2007; 26:93–104 - PubMed
    1. Herman SE, Mustafa RZ, Jones J, et al. . Treatment with ibrutinib inhibits BTK- and VLA-4-dependent adhesion of chronic lymphocytic leukemia cells in vivo. Clin Cancer Res. 2015; 21:4642–4651 - PMC - PubMed

LinkOut - more resources