. 2021 Apr 15;148(8):dev197558.
doi: 10.1242/dev.197558. Epub 2021 Apr 16.

PRSS50 is a testis protease responsible for proper sperm tail formation and function

Affiliations

PRSS50 is a testis protease responsible for proper sperm tail formation and function

Jason M Scovell et al. Development. .

Abstract

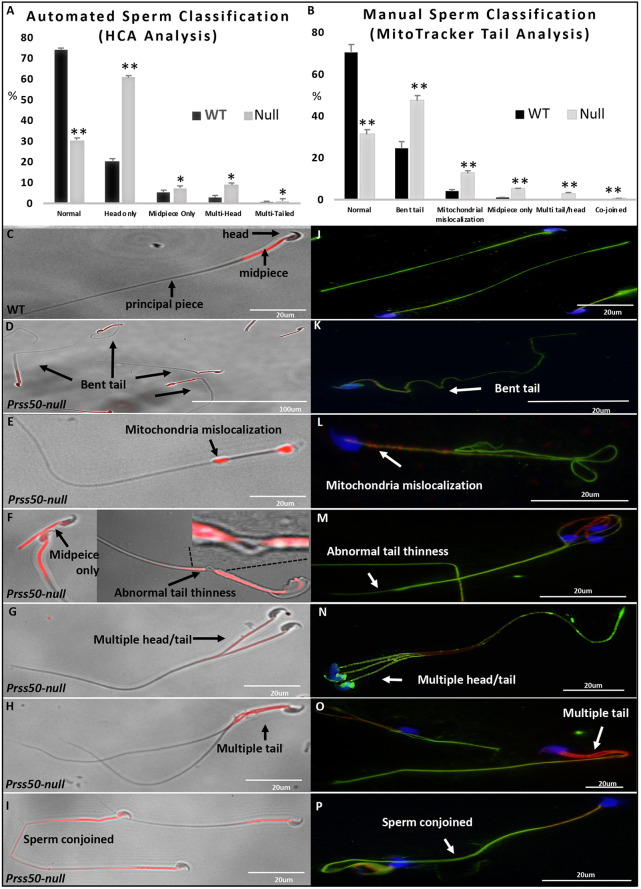
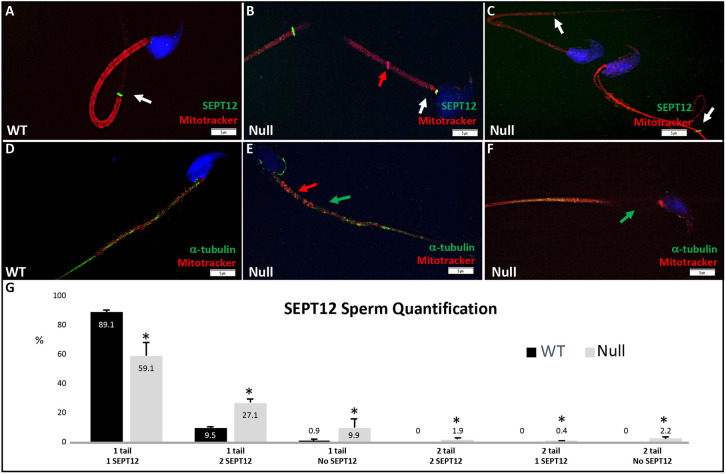
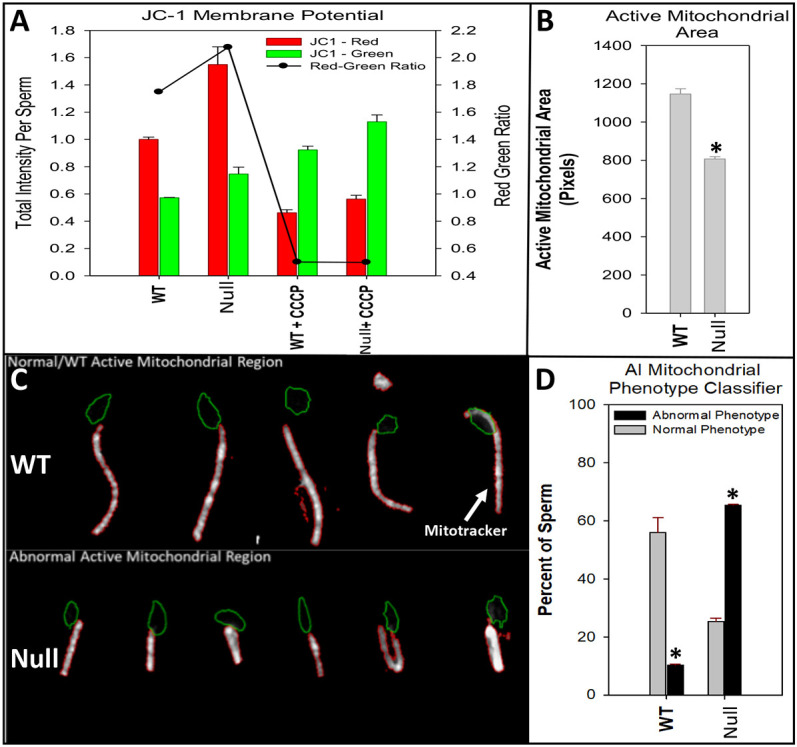
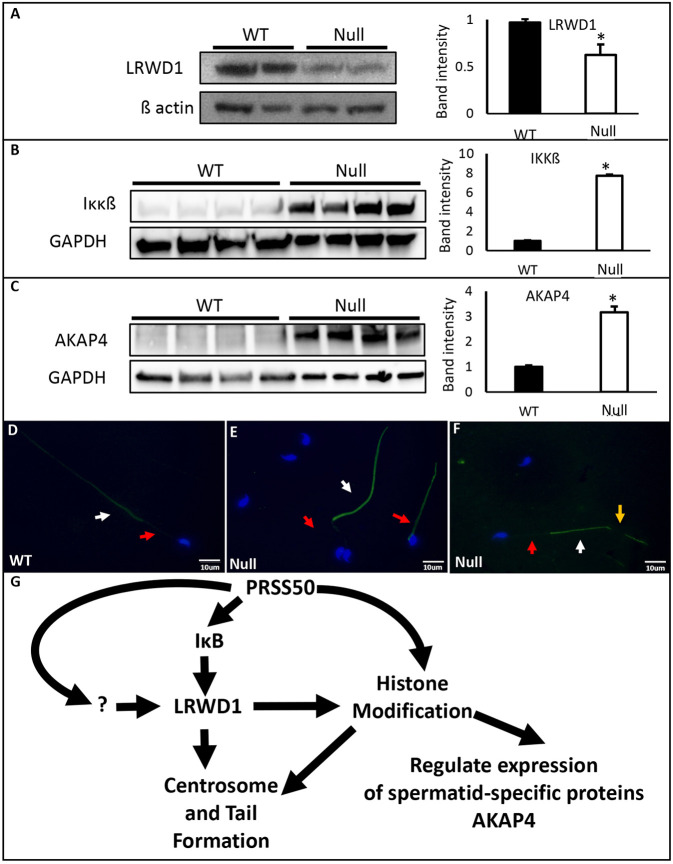
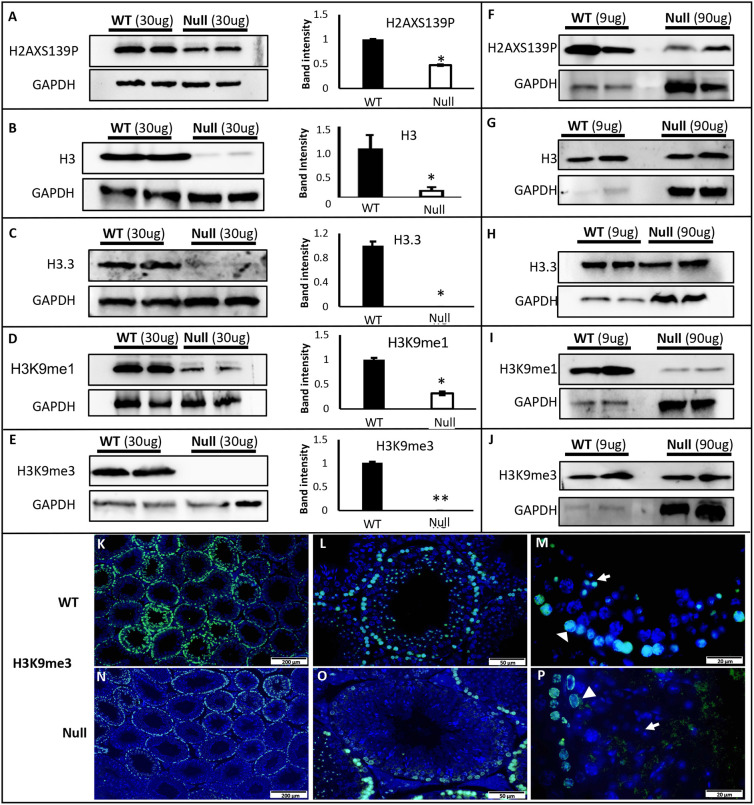
Multiple morphological abnormalities of the sperm flagella (MMAF) are a major cause of asthenoteratozoospermia. We have identified protease serine 50 (PRSS50) as having a crucial role in sperm development, because Prss50-null mice presented with impaired fertility and sperm tail abnormalities. PRSS50 could also be involved in centrosome function because these mice showed a threefold increase in acephalic sperm (head-tail junction defect), sperm with multiple heads (spermatid division defect) and sperm with multiple tails, including novel two conjoined sperm (complete or partial parts of several flagellum on the same plasma membrane). Our data support that, in the testis, as in tumorigenesis, PRSS50 activates NFκB target genes, such as the centromere protein leucine-rich repeats and WD repeat domain-containing protein 1 (LRWD1), which is required for heterochromatin maintenance. Prss50-null testes have increased IκκB, and reduced LRWD1 and histone expression. Low levels of de-repressed histone markers, such as H3K9me3, in the Prss50-null mouse testis may cause increases in post-meiosis proteins, such as AKAP4, affecting sperm formation. We provide important insights into the complex mechanisms of sperm development, the importance of testis proteases in fertility and a novel mechanism for MMAF.

Keywords: AKAP4; Centrosome; H3K9me3; Infertility; IκB; LRWD1; MMAF; Midpiece; Mitochondria; NFκB; PRSS50; SEPT12; Sperm tail.


Conflict of interest statement

Competing interests The authors declare no competing or financial interests.

Figures

Fig. 1.
Fig. 1.
PRSS50 is expressed in spermatocytes and sperm. (A-I) Light microscopy images of WT mouse and human testes and epididymis stained with a PRSS50 antibody (DAB; brown staining). (A) PRSS50 is not present in mouse embryonic testis at embryonic day (E)17. (B) PRSS50 is not present in mouse P1. (C) PRSS50 expression starts at P7 in leptotene spermatocytes (green arrow). (D,E) PRSS50 is homogenously expressed in spermatocytes in prepubertal mice at P14 (D) and P21 (E). (F) PRSS50 is expressed mainly in the membrane and cytoplasm of spermatocytes in testes of adult mice (green arrow); weak expression is observed in the membrane of spermatids (black arrow) and no expression is observed in spermatogonia (red arrow) or somatic cells of the testis. (G) Epididymal sperm of mice express PRSS50. (H) PRSS50 is expressed in spermatocytes in human testes. (I) Prss50-null mice generated using CRISPR/Cas9 technology lacked PRSS50 expression in spermatocytes. (J,K) Sperm expressing PRSS50 (in green) in the midpiece in both WT mouse (J) and human (K). Sperm heads are stained with DAPI. Midpieces in mouse sperm are stained with MitoTracker Deep Red.
Fig. 2.
Fig. 2.
Prss50-null mice have impaired fertility. (A) Comparison of the total number of litters per month produced by equal numbers of WT and Prss50-null mice in a 6-month mating period; P<0.01. (B) Comparison of the total number of pups produced per month by equal numbers of WT and Prss50-null mice in a 6-month mating period; P<0.001. n=10; however, eight mice per group are represented in the graphs because two Prss50-null mice were infertile.
Fig. 3.
Fig. 3.
Prss50-null mice have abnormalities in seminiferous tubules and epididymis. (A) WT mice showing normal germ cell layer distribution, with the least mature cells near the basal layer and the most mature cells near the lumen of the STs. (B-G) Testes of Prss50-null mice showing different ST abnormalities. (B) Testes of Prss50-null mice showing a mix of normal STs and other STs depleted of some or all layers of germ cells (asterisks). (C) Prss50-null mice have SCO STs (asterisk), symplasts (arrowheads), vacuoles and residual bodies (rhomboids). (D-F) STs with residual bodies and multinucleated cells (black arrows), and spermatocytes with abnormalities in the paired homologous chromosomes (red arrows). Rhomboids show residual bodies. (G) STs with elongated spermatids at different stages and possible double-headed sperm (green arrow). (H) Prss50-null mice have residual bodies (rhomboid) in the epididymis. Testis and epididymis 5 μm paraffin sections were stained with PAS. Scale bars: 200 µm in A,B; 50 µm in C,F,H; 20 µm in D,E,G.
Fig. 4.
Fig. 4.
Prss50-null mouse testes and epididymis have ultrastructural abnormalities. (A-T) TEM images of mouse testes (A-D,L) and epididymis (E-K,M-T). (A) WT mouse showing two spermatids in the cap phase of acrosomal biogenesis with well-delineated cell membranes. (B-D) Prss50-null mice showing two spermatids in the cap phase with different degrees of membrane separation between cells (red double-headed arrows). (E) WT mouse showing different segments of sperm flagellum and cross-section of the midpiece, revealing the regular arrangement of mitochondria, outer dense fibers and microtubules with a ‘9+2’ arrangement and one axoneme per plasma membrane. (F) Cross-section of Prss50-null mouse midpiece showing a microtubule ‘9+2’ arrangement but swollen and disorganized mitochondria (green arrow), and abnormal tail organization (blue arrow). (G,H) Prss50-null mouse showing numerous axonemes (purple arrows) in the same plasma membrane and sperm head often associated with a mass of cytoplasm where components of flagellum were found but could not be assembled correctly at the tail (pink arrows). Red arrow in G shows abnormal head-neck connection. (H) Prss50-null sperm with two heads and two axonemes in the same plasma membrane. Red arrow shows abnormal head-neck connection and blue arrows show abnormal cross section of sperm flagellum. (I,M) Elongated spermatid in WT mice showing a proximal centriole (C) well attached to the nuclear membrane and a distal centriole and annuli (A) on each side of the beginning of the tail. (J,N-P,S,T) In most of the Prss50-null sperm, the centriole does not appear to be properly attached to the nuclear member or is attached offsite (red double-headed arrows), the axonemes have abnormalities and there are abundant vesicles. Red arrows in P,S,T show abnormal head-neck connection. Pink arrow in T shows excess of residual cytoplasm with accumulation of many organelles including mislocalized mitochondria. (K) Prss50-null mice with additional centrioles. (L) Prss50-null sperm with acrosomal granules (AG) not properly attached to the nuclear membrane. (P) Prss50-null sperm with a short tail (red arrow). (Q) WT sperm with the centriole (C) attached to the head and a single tail surrounded by dense mitochondria. (R) Prss50-null sperm with one head and two tails (T1 and T2) running in parallel in the same plasma membrane and two sets of annuli (A1 and A2). Scale bars: 6 µm in R; 4 µm in L; 2 µm in A-D,S,T; 1 µm in G,H,K,N,P,Q; 800 nm in F; 600 nm in E; 500 nm in I,J,M,O.
Fig. 5.
Fig. 5.
Prss50-null mice have significant sperm abnormalities. (A) Sperm from WT and Prss50-null mice labeled with DAPI (head), MitoTracker Deep Red (midpiece) and α-tubulin (tail) were subjected to HCA analysis. Sperm were classified as normal (one head attached to one tail and no apparent defect in midpiece); head only (head without tail attached); midpiece only (sperm that have an identified head, a MitoTracker Deep Red-positive midpiece, but no or a minimal α-tubulin-stained tail extending beyond the midpiece); multi-head (sperm with multiple heads attached); and multi-tailed (more than two tails attached to a head). In total, 10,000 sperm from each sample (n=5) were classified using a rule-based scheme. Graphs show the percentage of total sperm. Data are mean±s.e.m. *P<0.01; **P<0.001. (B) Manual sperm classification of sperm in which the head and midpiece (labeled with MitoTracker Deep Red) were attached. In total, 200 sperm per sample (n=20) were counted on bright-field under a 40× objective. Graphs show the percentage of total sperm. Data are mean±s.d. Sperm were classified and examples of each classification are indicated as: (C) normal sperm with one head attached to a single tail (tail midpiece labeled red followed by unlabeled principal piece); (D) bent-tail sperm, in which the tail forms an angle; (E) mitochondria-mislocalization sperm in which MitoTracker Deep Red is either observed in multiple areas of the tail or is absent; (F) midpiece-only sperm, in which only the midpiece is observed but not the principal piece, probably because of a decrease in midpiece thickness and number of mitochondria, which could cause sperm tail breaks; (G) multiple tails/heads: a sperm sharing multiple midpieces and heads; (H) sperm with a single head and multiple tails; (I) conjoined sperm – with two sperm heads conjoined by a single tail. (J-P) Sperm labeled with DAPI (head), α-tubulin (tail) and MitoTracker Deep Red (midpiece). (J) WT sperm with normal tail morphology. (K-P) Prss50-null sperm with different tail anomalies. Scale bars: 100 µm in D; 20 µm in J-P.
Fig. 6.
Fig. 6.
Prss50-null sperm have annulus and tail abnormalities. (A) WT sperm express SEPT12 (green, white arrow) in the annulus at the distal end of the midpiece; mitochondria in the midpiece are labeled with MitoTracker Deep Red and the head is labeled with DAPI (blue). (B,C) Prss50-null sperm have normal SEPT12 localization (white arrows). Red arrow indicates abnormal mitochondria accumulation. (D) WT sperm express α-tubulin (green) along the tail. (E,F) Prss50-null sperm have a disrupted α-tubulin pattern, especially in the midpiece (red), indicated by green arrows. Red arrows indicate abnormal mitochondria accumulation. (G) Prss50-null mice have a significant decrease in sperm number, with a single SEPT12 signal in the annulus at the end of the midpiece and a significant increase in sperm either lacking SEPT12 signal or having an extra SEPT12 signal. Graphs show the percentage of total sperm. Data are mean±s.d.*P<0.01.
Fig. 7.
Fig. 7.
Sperm from Prss50-null mice have a smaller total active mitochondrial area per sperm compared with WT sperm. HCA was used to quantify effects of PRSS50 deficiency on membrane potential of active mitochondria labeled using JC-1, a green-red dye sensitive to mitochondrial membrane potential. HCA combines the use of automated microscopy and image analysis algorithms to image, segment and measure thousands of individual sperm per sample. (A) There was an increase in total JC-1 (red signal) per sperm (1.56±0.12 versus 1.0±0.01; P<0.01) from Prss50-null mice compared with wild type. This increased signal was not associated with a significant difference in the red-to-green ratio (2.0 versus 1.7) and was sensitive to the mitochondrial poison CCCP. (B) Sperm from Prss50-null mice had a smaller total active mitochondrial area per sperm (806±12 versus 1146±27 pixels; P<0.01). (C) Manual inspection of the images demonstrated two predominant mitochondrial morphology patterns (white areas indicate mitochondria) that differed between WT and Prss50-null sperm. (D) To determine the frequency of each pattern in the sperm samples, a cross-validated random forest artificial intelligence model was trained with 200 examples of each pattern. After two rounds of training, the model achieved a ROC AUC greater than 0.9, indicating a high degree of accuracy. When the model was applied to the sperm samples, Prss50-null mice had a significantly higher frequency of the truncated ‘abnormal’ phenotype than did WT mice (65.3±0.3 versus 10.2±0.4; P<0.001; data are average±s.e.).
Fig. 8.
Fig. 8.
Prss50-null mice have decreased testicular LRWD1 and increased IκκB and spermatid-specific proteins, such as AKAP4. (A) Western blot indicating a 40% downregulation in testicular LRWD1 levels in Prss50-null mice versus WT mice. Western blots indicating that (B) testicular IκκB was upregulated eightfold and (C) testicular AKAP4 was upregulated fourfold in Prss50-null mice. Graphs in A-C show band intensities. Data are average±s.d. *P>0.01. (D) AKAP4 expression (green) in WT sperm only in the principal piece (white arrow); the midpiece (red arrow) lacked AKAP4 expression; head was stained with DAPI. (E) AKAP4 expression (green) only in the principal piece (white arrow) of a Prss50-null sperm with two heads and in the principal piece (green) and midpiece (green; red arrow) of a single-headed Prss50-null sperm. (F) Discontinuous AKAP4 expression in the principal piece (yellow arrow) of a Prss50-null sperm. Red and white arrows indicate midpiece and principal piece, respectively. (G) Proposed model indicating the mechanism by which PRSS50 acts in the testis through multiple pathways, including degradation of the IκB pathway to regulate the expression of NFκB target genes, such as LRWD1. LRWD1 plays an important role in centrosome and tail formation as well as histone post-translational modifications, which are important for the temporal-spatial activation of spermatid-specific proteins, such as AKAP4. ‘?’ indicates a possible but unidentified protein.
Fig. 9.
Fig. 9.
Prss50-null mice have decreased total histone protein expression and post-translational modification. (A-E) Western blots for different histones and their post-translation modification(s) normalized to GAPDH and quantified using ImageJ. Graphs show western blot band intensities. Data are average±s.d. *P>0.01; **P>0.001. (A) H2AXS139P was 50% downregulated. (B) Total H3 (H3.1, H3.2, H3.3 and CENP-A) was 75% downregulated. (C) Testis-specific H3.3 was 90% downregulated. (D) H3K9me1 was 60% downregulated. (E) H3K9me3 was 100% downregulated. (F-J) Ten times more testis-null protein (90 µg) was added than to wild type (9 µg) to demonstrate that the histone proteins were produced but in reduced levels. (K-M) WT mice express H3K9me3 (green) in the nucleus (DAPI-blue) of spermatocytes (arrowhead) and spermatids (white arrow). (N-P) Prss50-null mice have decreased levels of H3K9me3, especially in the spermatids (white arrow), and abnormal localization in spermatocytes (arrowhead). Scale bars: 200 µm in K,N; 50 µm in L,O; 20 µm in M,P.

Similar articles

Cited by

References

    1. Adams, S. R., Maezawa, S., Alavattam, K. G., Abe, H., Sakashita, A., Shroder, M., Broering, T. J., Sroga Rios, J., Thomas, M. A., Lin, X.et al. (2018). RNF8 and SCML2 cooperate to regulate ubiquitination and H3K27 acetylation for escape gene activation on the sex chromosomes. PLoS Genet. 14, e1007233. 10.1371/journal.pgen.1007233 - DOI - PMC - PubMed
    1. Baccetti, B., Burrini, A. G., Collodel, G., Magnano, A. R., Piomboni, P., Renieri, T. and Sensini, C. (1989). Morphogenesis of the decapitated and decaudated sperm defect in two brothers. Gamete Res. 23, 181-188. 10.1002/mrd.1120230205 - DOI - PubMed
    1. Baccetti, B., Collodel, G., Estenoz, M., Manca, D., Moretti, E. and Piomboni, P. (2005). Gene deletions in an infertile man with sperm fibrous sheath dysplasia. Hum. Reprod. 20, 2790-2794. 10.1093/humrep/dei126 - DOI - PubMed
    1. Barrera, J. A., Kao, L.-R., Hammer, R. E., Seemann, J., Fuchs, J. L. and Megraw, T. L. (2010). CDK5RAP2 regulates centriole engagement and cohesion in mice. Dev. Cell 18, 913-926. 10.1016/j.devcel.2010.05.017 - DOI - PMC - PubMed
    1. Bartke, T., Vermeulen, M., Xhemalce, B., Robson, S. C., Mann, M. and Kouzarides, T. (2010). Nucleosome-interacting proteins regulated by DNA and histone methylation. Cell 143, 470-484. 10.1016/j.cell.2010.10.012 - DOI - PMC - PubMed

Publication types