. 2021 Apr 29:10:e62857.
doi: 10.7554/eLife.62857.

TAZ-CAMTA1 and YAP-TFE3 alter the TAZ/YAP transcriptome by recruiting the ATAC histone acetyltransferase complex

Affiliations

TAZ-CAMTA1 and YAP-TFE3 alter the TAZ/YAP transcriptome by recruiting the ATAC histone acetyltransferase complex

Nicole Merritt et al. Elife. .

Abstract

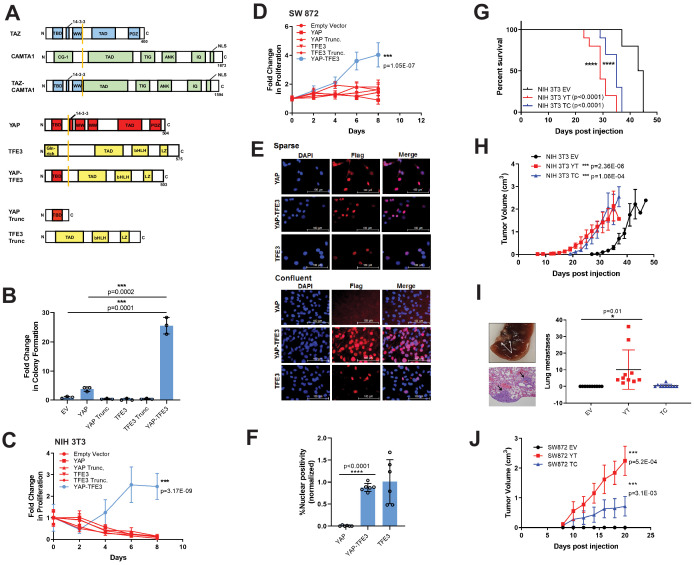
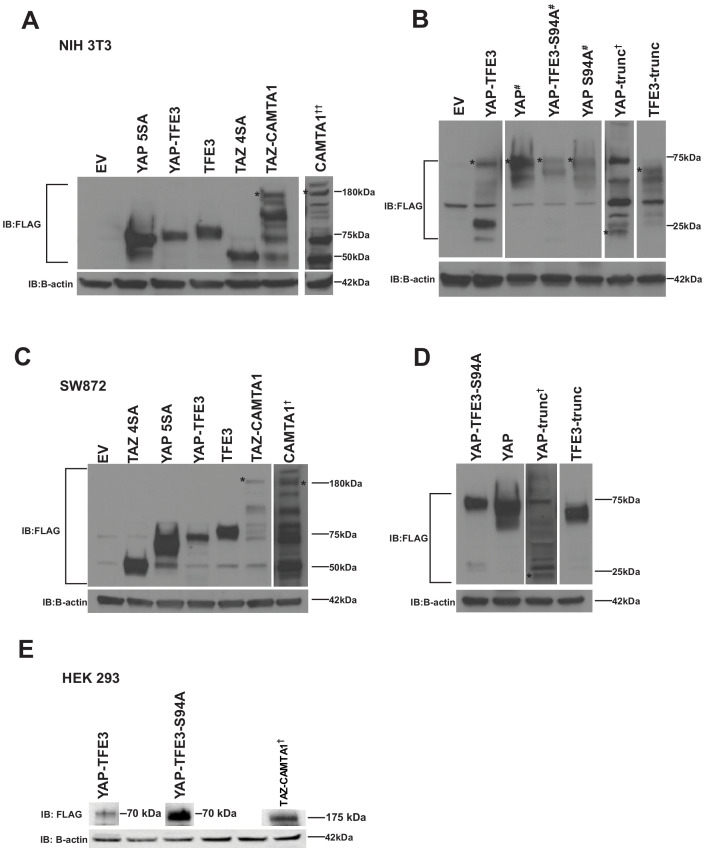
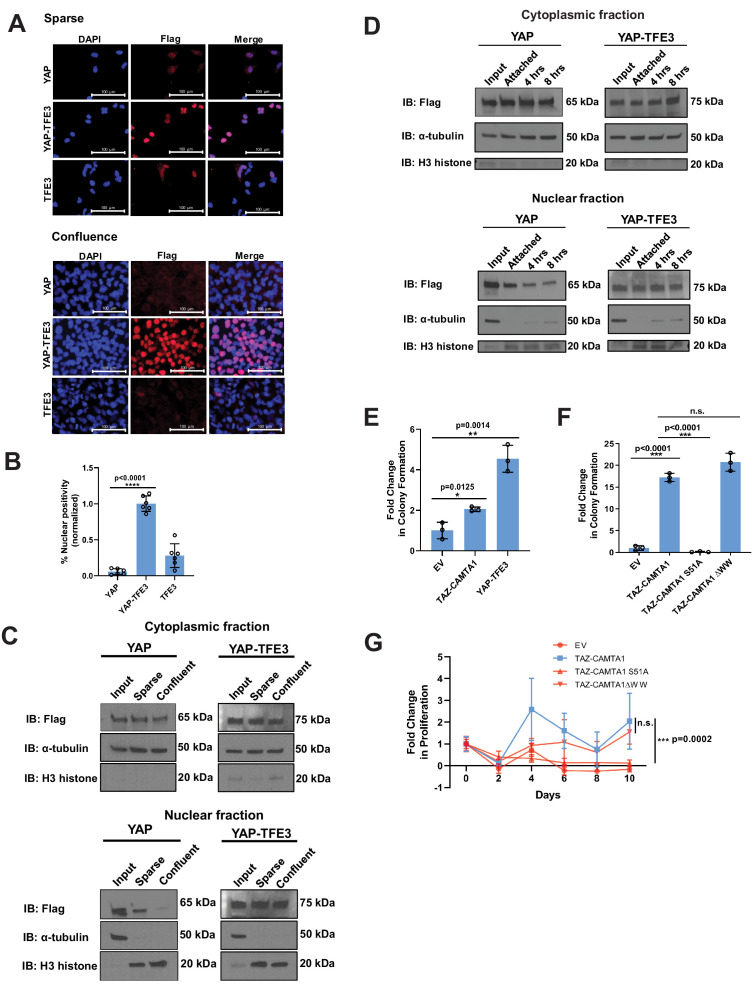
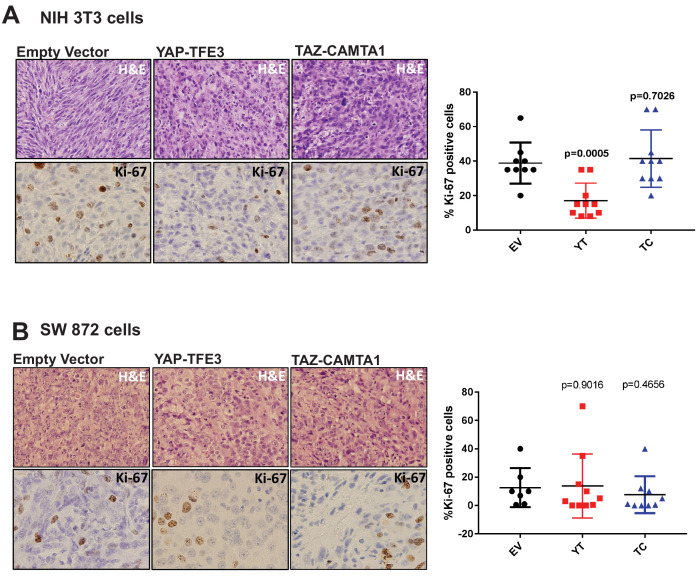
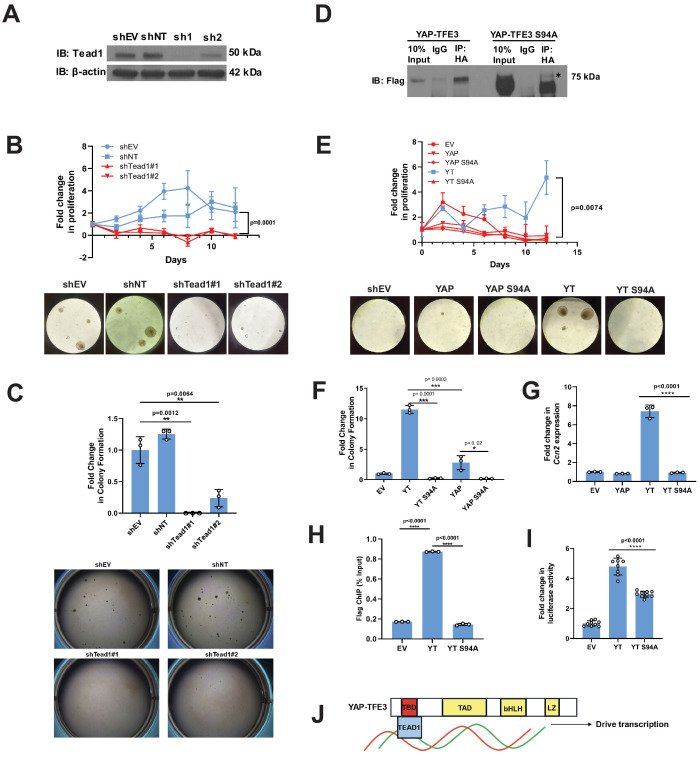
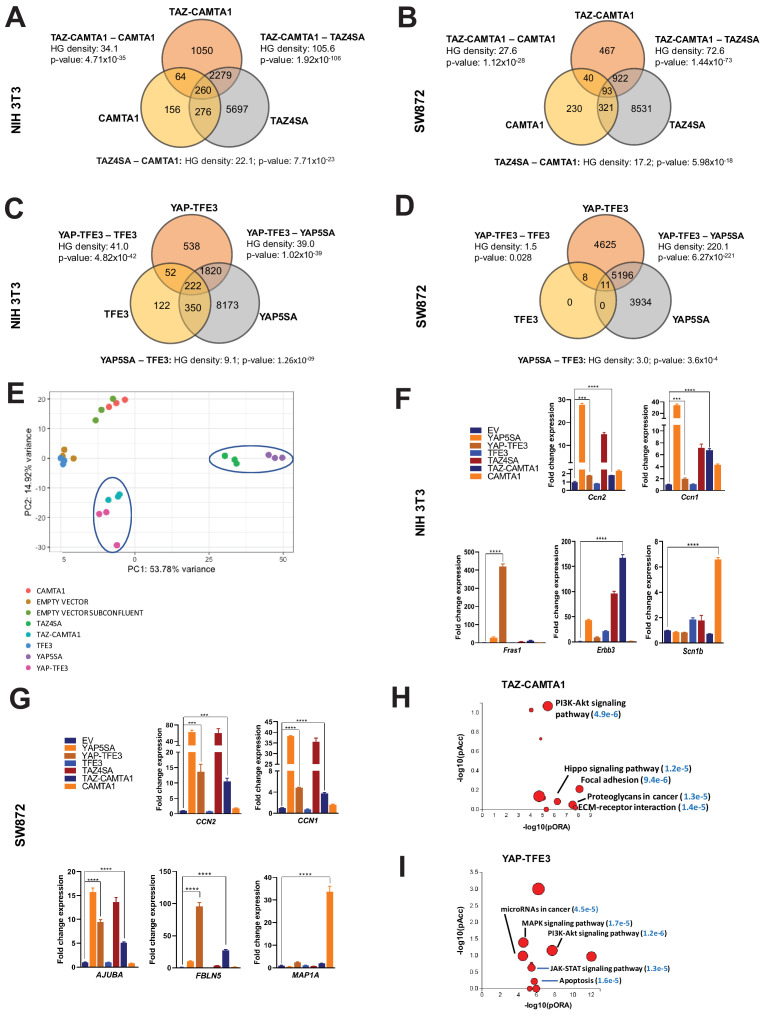
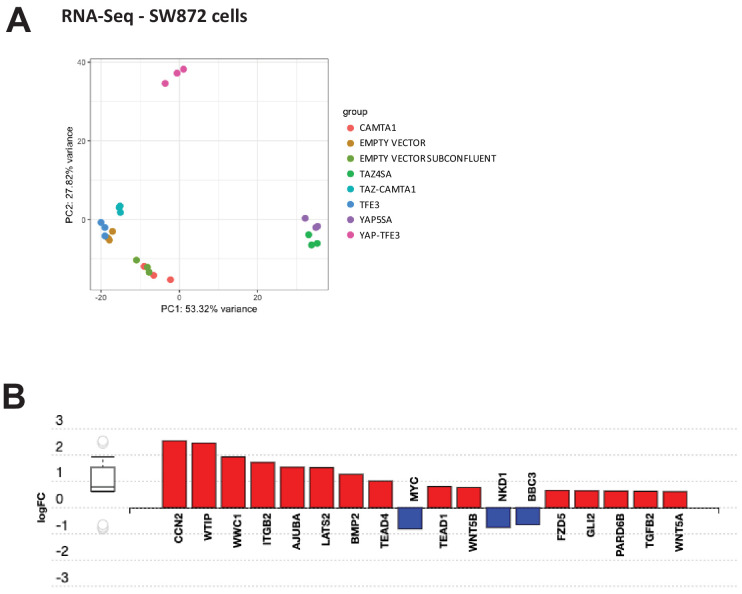
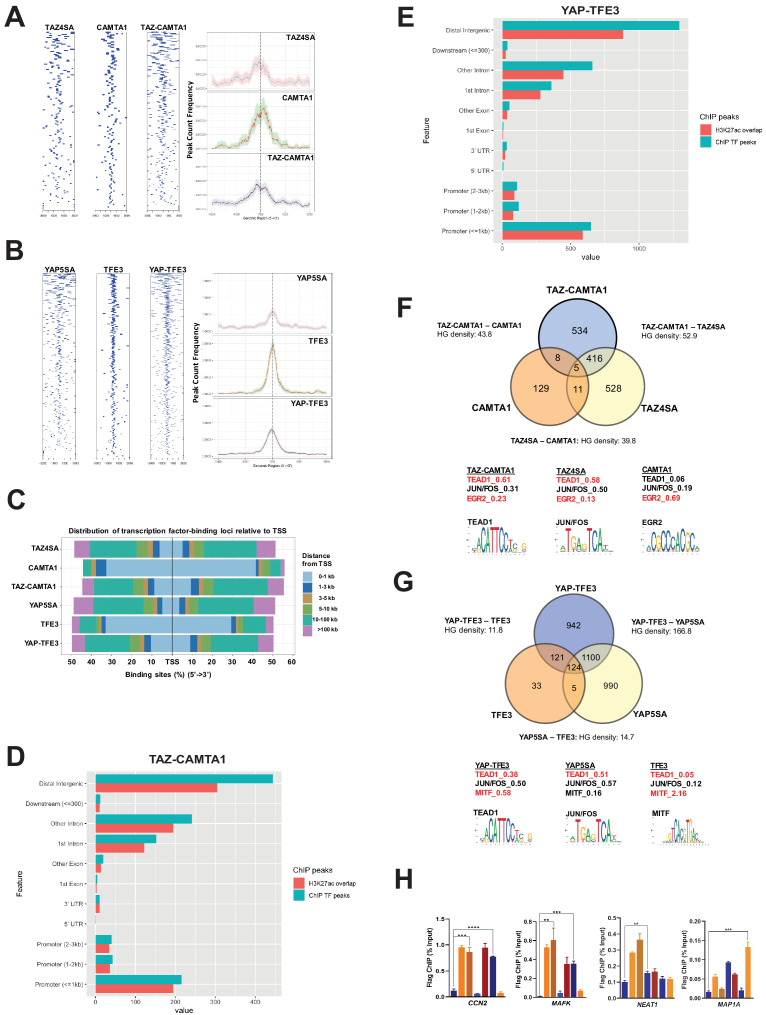
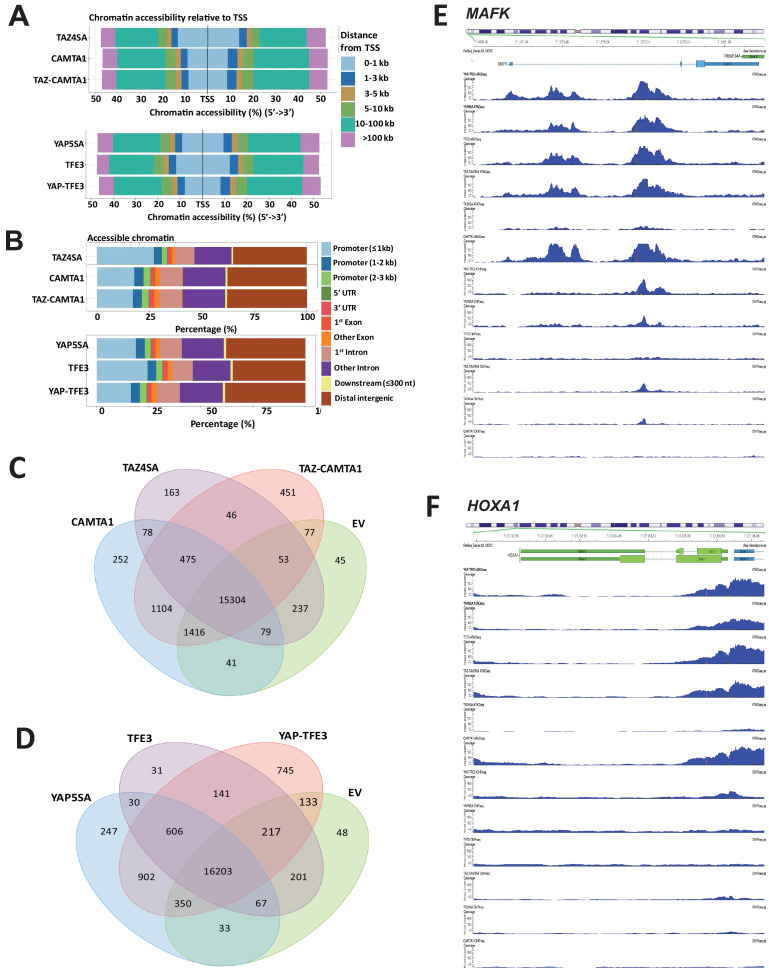
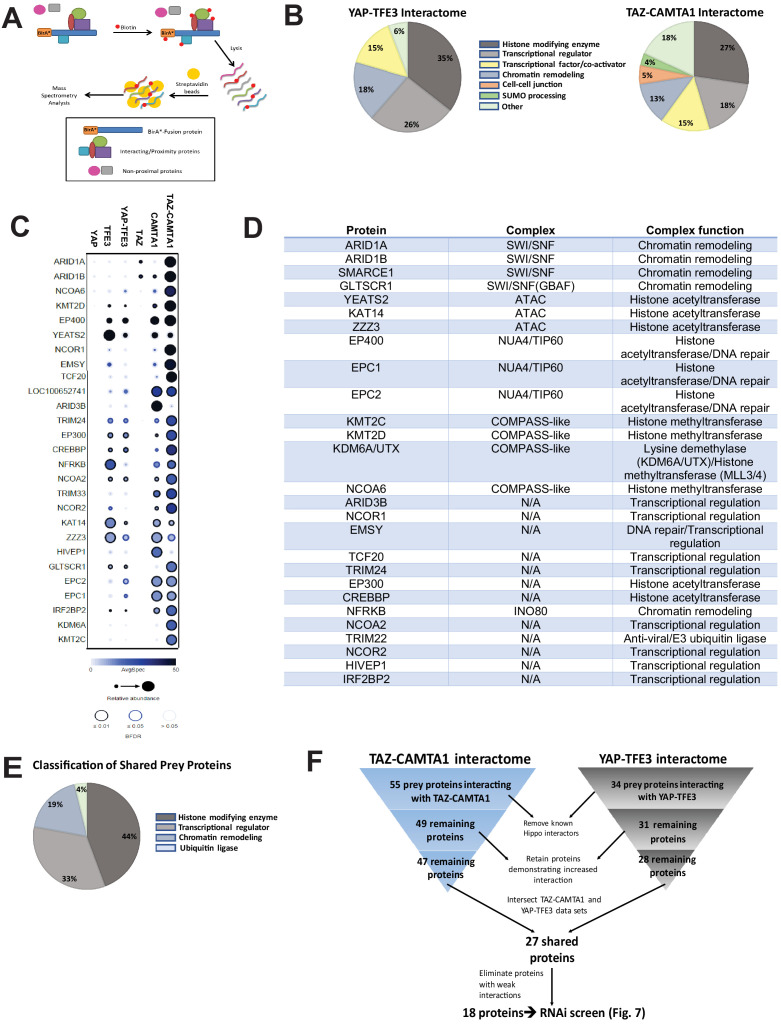
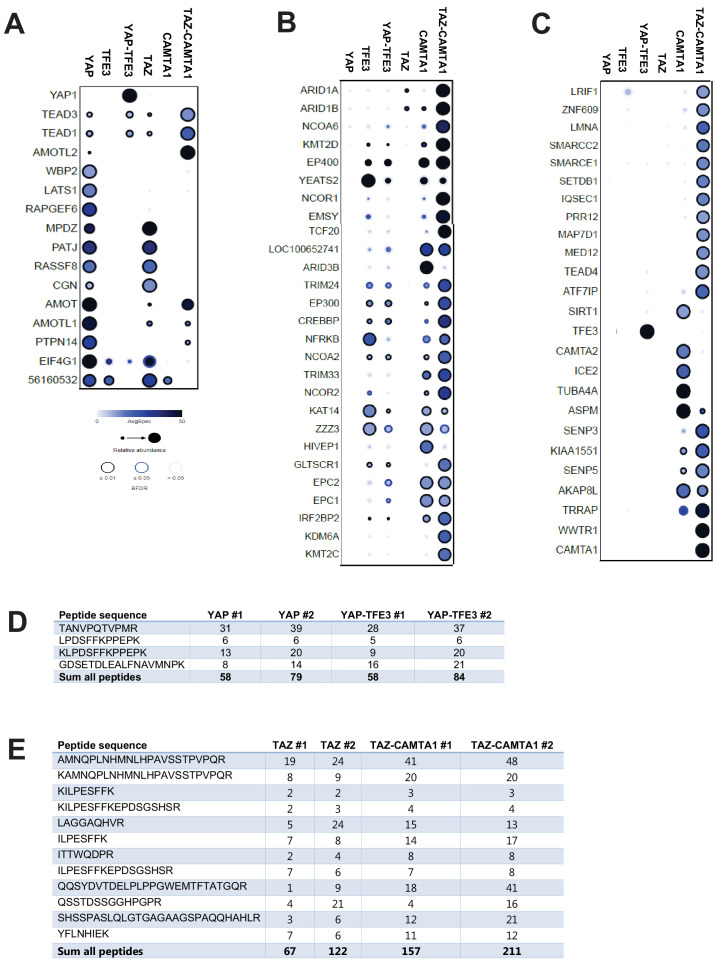
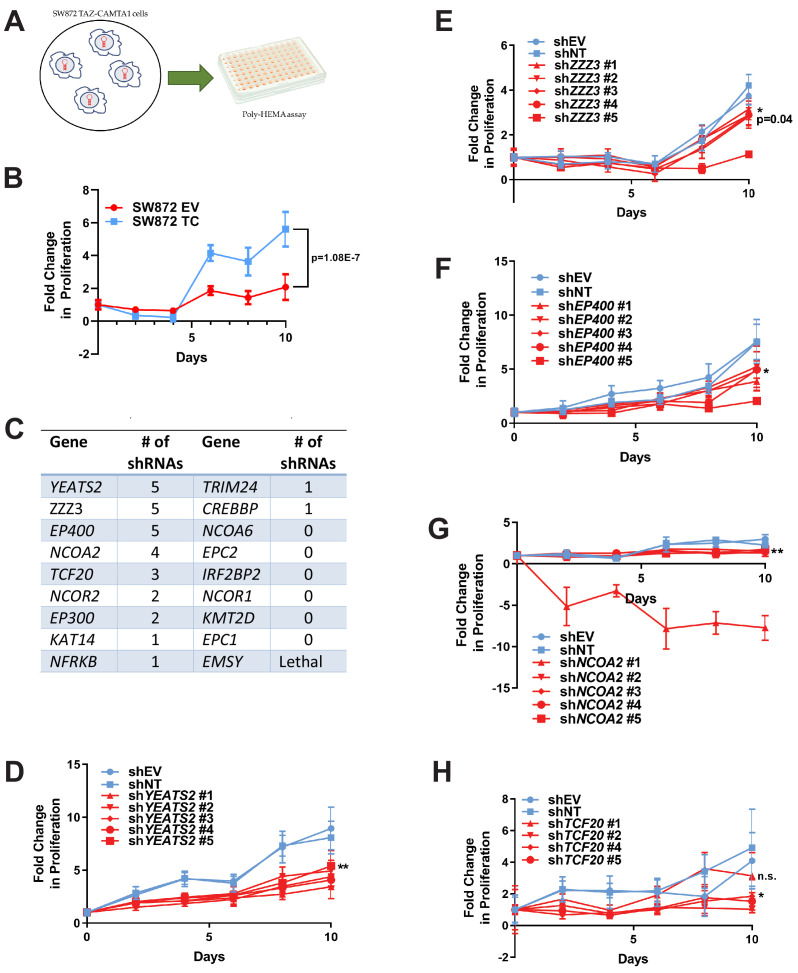
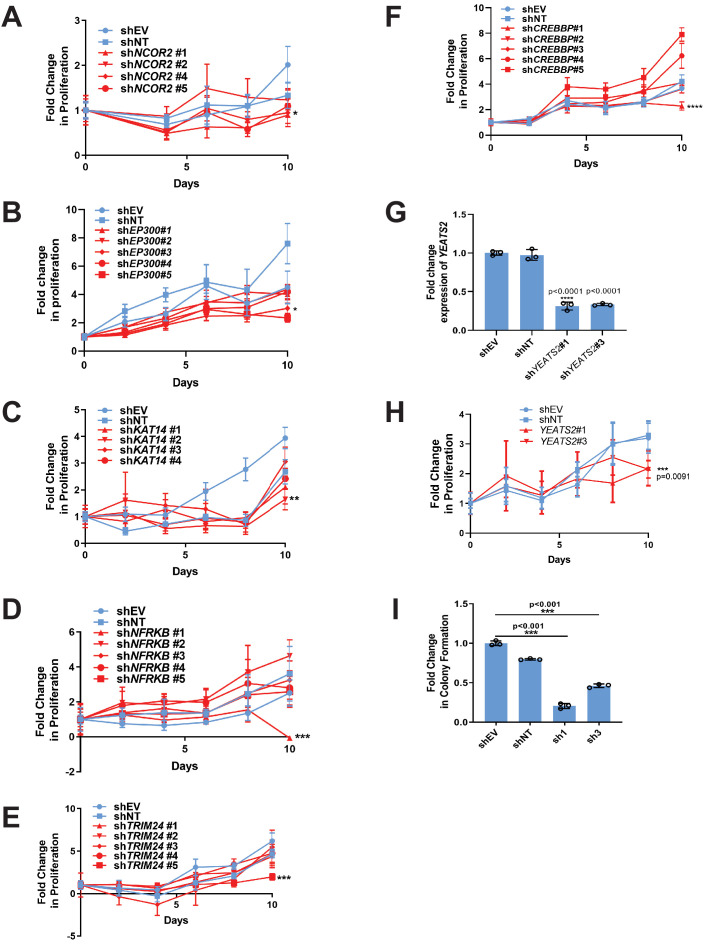
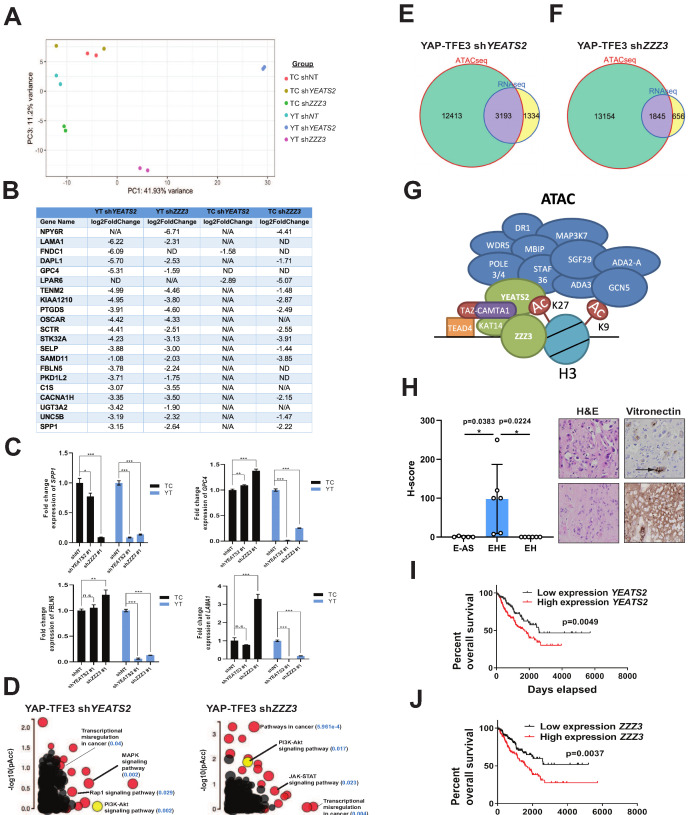
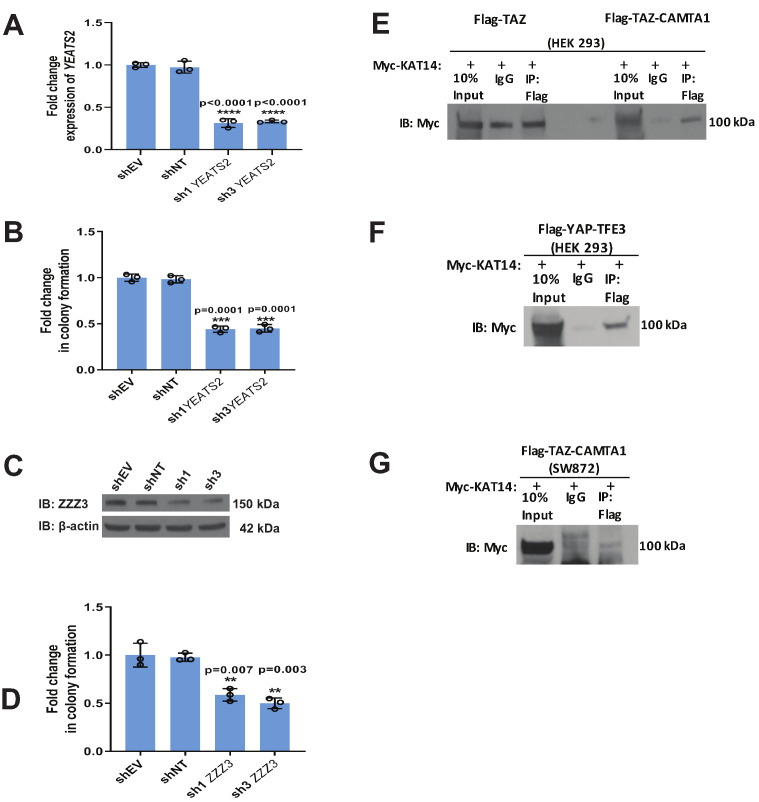
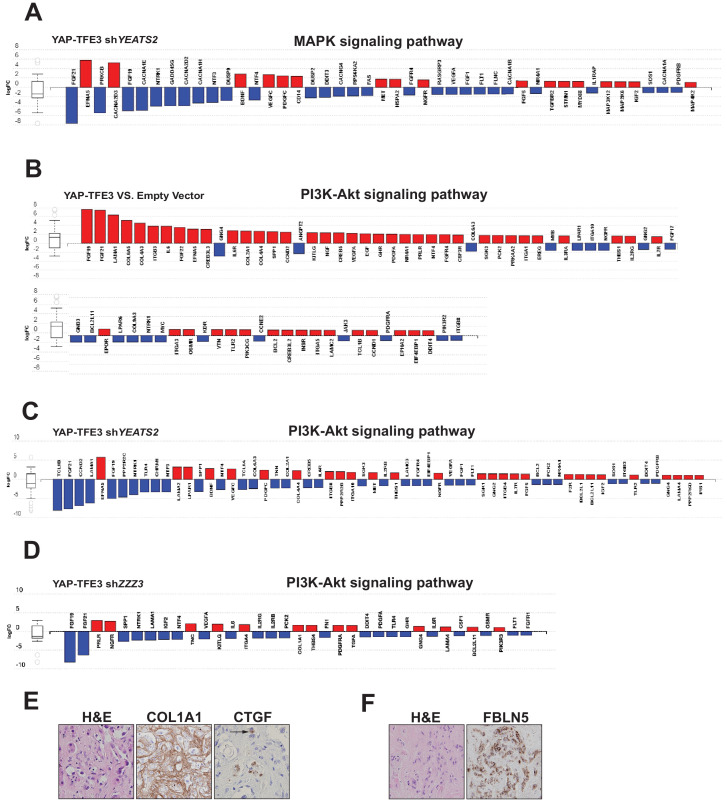
Epithelioid hemangioendothelioma (EHE) is a vascular sarcoma that metastasizes early in its clinical course and lacks an effective medical therapy. The TAZ-CAMTA1 and YAP-TFE3 fusion proteins are chimeric transcription factors and initiating oncogenic drivers of EHE. A combined proteomic/genetic screen in human cell lines identified YEATS2 and ZZZ3, components of the Ada2a-containing histone acetyltransferase (ATAC) complex, as key interactors of both fusion proteins despite the dissimilarity of the C terminal fusion partners CAMTA1 and TFE3. Integrative next-generation sequencing approaches in human and murine cell lines showed that the fusion proteins drive a unique transcriptome by simultaneously hyperactivating a TEAD-based transcriptional program and modulating the chromatin environment via interaction with the ATAC complex. Interaction of the ATAC complex with both fusion proteins indicates that it is a key oncogenic driver and unifying enzymatic therapeutic target for this sarcoma. This study presents an approach to mechanistically dissect how chimeric transcription factors drive the formation of human cancers.

Keywords: ATAC complex; cancer biology; chimeric transcription factors; chromosomes; epigenetics; fusion proteins; gene expression; hippo pathway; human; mouse; sarcomas.

Plain language summary

The proliferation of human cells is tightly regulated to ensure that enough cells are made to build and repair organs and tissues, while at the same time stopping cells from dividing uncontrollably and damaging the body. To get the right balance, cells rely on physical and chemical cues from their environment that trigger the biochemical signals that regulate two proteins called TAZ and YAP. These proteins control gene activity by regulating the rate at which genes are copied to produce proteins. If this process becomes dysregulated, cells can grow uncontrollably, causing cancer. In cancer cells, it is common to find TAZ and YAP fused to other proteins. In epithelioid hemangioendothelioma, a rare cancer that grows in the blood vessels, cancerous growth can be driven by a version of TAZ fused to the protein CAMTA1, or a version of YAP fused to the protein TFE3. While the role of TAZ and YAP in promoting gene activity is known, it is unclear how CAMTA1 and TFE3 contribute to cell growth becoming dysregulated. Merritt, Garcia et al. studied sarcoma cell lines to show that these two fusion proteins, TAZ-CAMTA1 and YAP-TFE3, change the pattern of gene activity seen in the cells compared to TAZ or YAP alone. An analysis of molecules that interact with the two fusion proteins identified a complex called ATAC as the cause of these changes. This complex adds chemical markers to DNA-packaging proteins, which control which genes are available for activation. The fusion proteins combine the ability of TAZ and YAP to control gene activity and the ability of CAMTA1 and TFE3 to make DNA more accessible, allowing the fusion proteins to drive uncontrolled cancerous growth. Similar TAZ and YAP fusion proteins have been found in other cancers, which can activate genes and potentially alter DNA packaging. Targeting drug development efforts at the proteins that complex with TAZ and YAP fusion proteins may lead to new therapies.


Conflict of interest statement

NM, KG, DR, ZL, XZ, KM, NB, CF, MC, AG, KH, MT No competing interests declared

Figures

Figure 1.
Figure 1.. YAP-TFE3 transforms cells in vitro and in vivo and combines properties of both YAP and TFE3.
(A) Structure of full-length TAZ, CAMTA1, TAZ-CAMTA1 (TC), YAP, TFE3, YAP-TFE3 (YT), truncated portion of YAP (YAP trunc) and the truncated portion of TFE3 (TFE3 trunc). (B) Soft agar assay in NIH 3T3 cells transduced with empty vector (EV), full-length YAP, YAP trunc, TFE3, TFE3 trunc, and YAP-TFE3. (C) Poly-HEMA proliferation assay in NIH 3T3 cells (same constructs as part B). (D) Poly-HEMA proliferation assay in SW872 cells (same constructs as part B). (E) Immunofluorescence images in NIH 3T3 cells expressing YAP, YAP-TFE3, and TFE3 during sparse and confluent conditions, represented graphically (% nuclear positivity during cell confluence is normalized to % positivity in sparse conditions) in (F). (G) Overall survival curve for NSG mice containing xenografted NIH 3T3 cells transduced with empty vector (EV), YAP-TFE3 (YT), and TAZ-CAMTA1 (TC). (H) Tumor growth curve for NSG mice containing xenografted NIH 3T3 cells transduced with empty vector (EV), YAP-TFE3 (YT), and TAZ-CAMTA1 (TC). (I) Gross and microscopic pathology of pulmonary metastases derived from NIH 3T3 cells derived tumors expressing YAP-TFE3. Graphically represented on the right. (J) Tumor growth curve for NSG mice containing xenografted SW872 cells transduced with empty vector (EV), YAP-TFE3 (YT), and TAZ-CAMTA1 (TC). For soft agar assays, statistical significance was evaluated using an unpaired two-tailed t-test. For poly-HEMA proliferation assays, statistical significance was evaluated using fold change increase in proliferation at day 10 with an unpaired two-tailed t-test. For immunofluorescence, % nuclear positivity was calculated for six different fields for each condition; statistical significance was evaluated using an unpaired two-tailed t-test. All in vitro assays were repeated at least twice. Xenograft mouse experiments were repeated twice, using 5–10 mice per group; statistical significance was evaluated using an unpaired two-tailed t-test for evaluation of metastasis and difference in primary tumor size (last day evaluated). Approximately equal numbers of male and female mice were used. Statistical analysis for Kaplan-Meier survival analysis was performed with the log-rank (Mantel-Cox) test. Error bars were used to define one standard deviation. For all panels, ****p<0.0001, ***p<0.001, **p<0.01, *p<0.05.
Figure 1—figure supplement 1.
Figure 1—figure supplement 1.. YAP-TFE3, TAZ-CAMTA1, and controls are expressed in NIH 3T3 cells, SW 872 cells, and HEK293 cells.
(A) Western blot for Flag tagged YAP5SA, YAP-TFE3, TFE3, TAZ4SA, TAZ-CAMTA1, CAMTA1 in NIH 3T3 cells (B) Western blot for Flag-tagged YAP, YAP-TFE3 S94A, YAP S94A, YAP-Trunc, and TFE3-Trunc in NIH 3T3 cells. (C) Western blot for Flag-tagged TAZ4SA, YAP5SA, YAP-TFE3, TFE3, TAZ-CAMTA1, CAMTA1 in SW872 cells (D) Western blot for Flag tagged YAP-TFE3 S94A, YAP, YAP-Trunc, and TFE3-Trunc in SW872 cells. (E) Western blots for Flag-tagged YAP-TFE3, YAP-TFE3 S94A, and TAZ-CAMTA1 in HEK293 cells. Each blot (excluding NIH 3T3 CAMTA1, (A)) was run on a single gel, respectively. * indicates protein band of interest, † indicates longer exposure, # indicates shorter exposure, †† 100 ug protein loaded.
Figure 1—figure supplement 2.
Figure 1—figure supplement 2.. YAP-TFE3 is not regulated by the Hippo pathway and required binding to TEAD transcription factors to drive its oncogenic transcriptional program.
(A) YAP and YAP-TFE3 are localized within the nucleus under spare conditions in SW872 cells. YAP-TFE3 but not YAP is localized within the nucleus under confluent conditions in SW872 cells. (B) Graphical representation of results in part (A) with % nuclear positivity during cell confluence normalized to % nuclear positivity during sparse conditions. (C) NIH 3T3 cells expressing YAP and YAP-TFE3 are plated under sparse and confluent conditions. YAP accumulation in the nucleus is diminished during confluence while YAP-TFE3 levels in the nucleus remain constant. α-tubulin is the cytoplasmic loading control; H3 histone is the nuclear loading control. (D) NIH 3T3 cells are detached in a time course. Nuclear:cytoplasmic fractionation show YAP-TFE3 remains in the nucleus during detachment while YAP localization in the nucleus diminishes with time. (E) TAZ-CAMTA1 and YAP-TFE3 promote anchorage independent growth in SW872 cells in soft agar colony formation assay. (F) The TAZ-CAMTA1 S51A mutant (TEAD binding domain mutant) abrogates colony formation in soft agar in NIH 3T3 cells. Mutating the WW domain in TAZ-CAMTA1 (TAZ-CAMTA1 ΔWW mutant) does not reduce colony formation in soft agar. (G) The TAZ-CAMTA1 S51A mutant but not the ΔWW mutant reduces anchorage independent proliferation on poly-HEMA. For immunofluorescence, % nuclear positivity was calculated for six different fields for each condition; statistical significance was evaluated using an unpaired two-tailed t-test. For soft agar assays, statistical significance was evaluated using an unpaired two-tailed t-test. For poly-HEMA proliferation assays, statistical significance was evaluated using fold change increase in proliferation at day 10 with an unpaired two-tailed t-test. Each experiment was repeated at least twice. Error bars were used to define one standard deviation. For all panels, ****p<0.0001, ***p<0.001, **p<0.01, *p<0.05.
Figure 1—figure supplement 3.
Figure 1—figure supplement 3.. YAP-TFE3 and TAZ-CAMTA1 driven xenografts in NOD.Cg-PrkdcscidIl2rgtm1Wjl/SzJ (NSG) mice form tumors in vivo.
(A) H and E sections of NIH 3T3 xenografts transduced with EV, YAP-TFE3 or TAZ-CAMTA1. Tumors expressing YAP-TFE3 or TAZ-CAMTA1 showed a more epithelioid cytomorphology and a greater degree of pleomorphism than EV control. Ki-67 labeling was not increased in YAP-TFE3 or TAZ-CAMTA1 tumors compared to EV. (B) H and E sections of SW872 xenografts transduced with EV, YAP-TFE3, or TAZ-CAMTA1. Tumors expressing YAP-TFE3 or TAZ-CAMTA1 showed a greater degree of pleomorphism, however this change was less pronounced than it was in NIH 3T3 cells. Ki-67 labeling was not increased in YAP-TFE3 or TAZ-CAMTA1 tumors compared to EV. Xenograft mouse experiments were repeated twice, using 5–10 mice per group. Significance of Ki-67 labeling was determine by unpaired two-tailed t-test.
Figure 2.
Figure 2.. Tead1 mediates the oncogenic transcriptional program of YAP-TFE3.
(A) Knockdown of Tead1 in NIH 3T3 YAP-TFE3 cells. (B) Poly-HEMA analysis in NIH 3T3 YAP-TFE3 cells with Tead1 knock-down. Spheroid formation on poly-HEMA is shown below. (C) Soft agar assay in NIH 3T3 YAP-TFE3 cells with two Tead1 shRNA (shTead#1 and shTead#2) with colonies shown below. (D) Co-immunoprecipitation experiment in NIH 3T3 cells stably expressing Flag-YAP-TFE3 or Flag-YAP-TFE3 S94A. 3HA-TEAD1 is transiently transfected. * indicates MW of Flag-YAP-TFE3. (E) Poly-HEMA assay in NIH 3T3 cells expressing same constructs present in E. Spheroid formation on poly-HEMA is shown below. (F) Soft agar assay in NIH 3T3 cells expressing YAP-TFE3 (YT), YT S94A, YAP, or YAPS94A. (G) Quantitative RT-PCR showing reduced Ccn2 expression in NIH 3T3 YAP-TFE3 (YT) S94A cells. (H) Chromatin immunoprecipitation-quantitative PCR for the CCN2 promoter in SW872 cells transduced with empty vector (EV), YT, and YT S94A. (I) Luciferase reporter assay (8XGTIIC luciferase reporter construct) in HEK 293 cells expressing YT or YT S94A. (J) Model diagram of YAP-TFE3 driving transcription by binding to TEAD1. For soft agar assays, statistical significance was evaluated using an unpaired two-tailed t-test. For poly-HEMA proliferation assays, statistical significance was evaluated using fold change increase in proliferation at day 10 with an unpaired two-tailed t-test. For quantitative RT-PCR and the luciferase reporter assay, standard deviation was calculated from fold change values for each triplicate. Each experiment was repeated at least twice. Error bars were used to define one standard deviation. For all panels, ****p<0.0001, ***p<0.001, **p<0.01, *p<0.05.
Figure 3.
Figure 3.. TAZ-CAMTA1 and YAP-TFE3 induce different but overlapping transcriptomes compared to TAZ and YAP.
(A) Number of differentially expressed genes (FDR = 5%) in NIH 3T3 cells expressing TAZ-CAMTA1 and full-length controls. HG density represents the –log10(hypergeometric density). p Value for hypergeometric analysis included. (B) Number of differentially expressed genes (FDR = 5%) in SW872 cells expressing TAZ-CAMTA1 and full-length controls. (C) Number of differentially expressed genes (FDR = 5%) in NIH 3T3 cells expressing YAP-TFE3 and full-length controls. (D) Number of differentially expressed genes (FDR = 5%) in SW872 cells expressing YAP-TFE3 and full-length controls. (E) Principal component analysis of RNA expression after variance-stabilizing transformation in NIH 3T3 cells. (F) Validation of RNA-Seq in NIH 3T3 cells by qRT-PCR for key genes. (G) Validation of RNA-Seq in SW872 cells by qRT-PCR for key genes. (H) Scatter plot of two types of pathway enrichment evidence: probability of over-representation (pORA) and probability of accumulation (pAcc) as calculated by iPathwayGuide for SW872 TAZ-CAMTA1 cells and (I) YAP-TFE3 cells. RNA-Seq experiments in NIH 3T3 cells and SW872 cells were performed using biological triplicates for each of the conditions (expression constructs). For gene expression data, the population was set to the total number of recovered genes with the mean of 5 counts across all samples. Hypergeometric testing was performed using the phyper() function in the stats R package (v3.6.3) set to assess enrichment and the lower tail set to false. Hypergeometric density was calculated using the related dhyper function and converted using the negative log10 of the output. For quantitative RT-PCR, standard deviation was calculated from fold change values for each triplicate. Error bars were used to define one standard deviation. For all panels, ****p<0.0001, ***p<0.001, **p<0.01, *p<0.05.
Figure 3—figure supplement 1.
Figure 3—figure supplement 1.. Differentially expressed genes in SW872 cells expressing fusion proteins and full length controls.
(A) Principal component analysis of RNA expression after variance stabilizing transformation in SW872 cells. (B) iPathwayGuide analysis showing enrichment of Hippo pathway genes in DE expression analysis in SW872 cells expressing TAZ-CAMTA1. RNA-Seq experiments were performed in biological triplicates. For gene expression data, the population was set to the total number of recovered genes with the mean of five counts across all samples.
Figure 4.
Figure 4.. TAZ-CAMTA1 and YAP-TFE3 occupy TEAD and non-TEAD transcription factor motifs.
(A) Heat map of ChIP binding to transcriptional start site (TSS) regions and average TSS profile histogram for TAZ-CAMTA1 and controls. (B) Heat map and histogram for YAP-TFE3 and controls. (C) Distribution of transcription factor binding loci relative to TSS for the fusion proteins and controls. (D) Distribution of overlapping TAZ-CAMTA1 and H3K27ac ChIP peaks among annotated functional DNA-binding sites. (E) Distribution of overlapping YAP-TFE3 and H3K27ac ChIP peaks among annotated functional DNA binding sites. (F) Intersection of gene annotations for TAZ-CAMTA1 ChIP peaks and controls. Proportion of peaks containing selected transcription factor (TF) motifs (consensus sequences included) shown for each construct below. HG density represents the –log10(hypergeometric density). (G) Intersection of gene annotations for YAP-TFE3 ChIP peaks and controls. Proportion of peaks containing selected TF motifs shown for each construct below. (H) Validation of ChIP-Seq in SW872 cells in selected genes by ChIP-qPCR. ChIP-Seq experiments in SW872 cells were performed using biological triplicates for each of the conditions (expression constructs). For ChIP-Seq analysis, the population was set as the total number of genes annotated across all conditions. Hypergeometric testing was performed using the phyper() function in the stats R package (v3.6.3) set to assess enrichment and the lower tail set to false. Hypergeometric density was calculated using the related dhyper function and converted using the negative log10 of the output. For ChIP-qPCR, standard deviation was calculated from fold change values for each triplicate. Error bars were used to define one standard deviation. For all panels, ****p<0.0001, ***p<0.001, **p<0.01, *p<0.05.
Figure 4—figure supplement 1.
Figure 4—figure supplement 1.. Distribution of overlapping transcription factor and H3K27ac ChIP peaks among annotated functional DNA-binding sites.
Overlapping transcription factor/coactivator ChIP peaks shown for annotated functional DNA binding sites in SW872 cells expressing (A) TAZ4SA, (B) CAMTA1, (C) YAP5SA, and (D) TFE3. (E) Combined Flag-TAZ-CAMTA1 and H3K27ac ChIP-Seq tracks in SW872 cells expressing Flag-TAZ-CAMTA1 centered around the transcriptional start sites for (E) MAFK and (F) HOXA1. ChIP-Seq experiments immunoprecipitating Flag-TAZ4SA, Flag-CAMTA1, Flag-YAP5SA, and Flag-TFE3 were performed in biological triplicates. H3K27ac ChIP-Seq was performed in biological duplicates for each of the constructs. For ChIP-Seq analysis, the population was set as the total number of genes annotated across all conditions.
Figure 4—figure supplement 2.
Figure 4—figure supplement 2.. Characterization of YAP-TFE3 and TAZ-CAMTA1 DNA binding in SW872 cells.
(A) Pull-down of TFE3 reveals interaction with Flag-YAP-TFE3 by co-immunoprecipitation, consistent with enrichment of the MiTF consensus DNA binding sequence and mass spectrometry data. Soft agar studies after disrupting the bHLH domain (YT R-I mutation) in the TFE3 component of YAP-TFE3. (B–F) Scatterplot arraying differentially expressed genes in terms of increasing statistical significance along the Y axis, and genes in terms of increasing ChIP peak ‘score’ (i.e. statistical significance) along the X axis. Many TAZ-CAMTA1 (C) and YAP-TFE3 (F) bound genes are also differentially expressed. TAZ4SA (B), CAMTA1 (D), and YAP5SA (E) controls included. Co-immunoprecipitation and soft agar assays repeated at least twice. RNA-Seq and ChIP-Seq experiments were performed in biological triplicates. For gene expression data, the population was set to the total number of recovered genes with the mean of five counts across all samples. For ChIP-seq, the population was set as the total number of genes annotated across all conditions.
Figure 4—figure supplement 3.
Figure 4—figure supplement 3.. TAZ-CAMTA1 and YAP-TFE3-bound genes are differentially expressed.
(A) Venn diagram showing intersection of DE expressed genes in SW872 TAZ-CAMTA1 with TAZ-CAMTA1-bound genes. (B) Venn diagram showing intersection of DE expressed genes in SW872 YAP-TFE3 with YAP-TFE3-bound genes. (C) KEGG pathway enrichment analysis of the collection of genes representing the intersection of TAZ-CAMTA1-bound genes (by ChIP-Seq) and DE genes in TAZ-CAMTA1 expressing SW872 cells. RNA-Seq and ChIP-Seq experiments were performed in biological triplicates. For gene expression data, the population was set to the total number of recovered genes with the mean of five counts across all samples. For ChIP-seq, the population was set as the total number of genes annotated across all conditions.
Figure 5.
Figure 5.. TAZ-CAMTA1 and YAP-TFE3 promote the formation of chromatin accessible to transcriptional regulation.
(A) Heat map of ATAC peak distribution around the transcriptional start site (TSS) region and average ATAC TSS profile for TAZ-CAMTA1 and controls and (B) for YAP-TFE3 and controls. (C) Intersection of gene annotations for transposase accessible chromatin peaks in TAZ-CAMTA1 and controls and (D) YAP-TFE3 and controls. HG density represents the –log10(hypergeometric density). p value for hypergeometric analysis included. (E) DiffBind principal component analysis for fusion proteins and controls. (F) Overlay of differentially expressed genes, bound genes, with transposase accessible chromatin for TAZ-CAMTA1. (G) Overlay of differentially expressed genes, bound genes, with transposase accessible chromatin for YAP-TFE3. ATAC-Seq experiments in SW872 cells were performed using biological triplicates for each of the conditions (expression constructs). For ATAC-Seq analysis, the population was set as the total number of genes annotated across all conditions. Hypergeometric testing was performed using the phyper() function in the stats R package (v3.6.3) set to assess enrichment and the lower tail set to false. Hypergeometric density was calculated using the related dhyper function and converted using the negative log10 of the output.
Figure 5—figure supplement 1.
Figure 5—figure supplement 1.. TAZ-CAMTA1 and YAP-TFE3 alter the chromatin landscape.
Distribution of transposase accessible chromatin relative to transcriptional start site (A) and functional annotation (B). (C) Venn diagram analysis for TAZ-CAMTA1 after ATAC peaks annotated to their nearest gene feature and including empty vector to demonstrate the baseline level of accessible chromatin. (D) Venn diagram analysis for YAP-TFE3 after ATAC peaks annotated to their nearest gene feature and including empty vector to demonstrate the baseline level of accessible chromatin. Combined ATAC-seq and ChIP-Seq signal tracks for MAFK (E) and HOXA1 (F). ATAC-Seq and ChIP-Seq experiments were performed in biological triplicates. For ATAC-seq and ChIP-seq analysis, the population was set as the total number of genes annotated across all conditions.
Figure 6.
Figure 6.. The TAZ-CAMTA1 and YAP-TFE3 interactomes are enriched for transcriptional regulators and chromatin modifiers.
(A) Overview of BioID method. (B) Summary of YAP-TFE3 and TAZ-CAMTA1 interactomes. (C) Dot plot representation of chromatin modifiers shared by YAP-TFE3 and TAZ-CAMTA1 interactomes. (D) Table of chromatin modifiers shared by YAP-TFE3 and TAZ-CAMTA1 interactomes. (E) Classification of prey proteins shared between TAZ-CAMTA1 and YAP-TFE3 interactomes. (F) Algorithm to prioritize the TAZ-CAMTA1 and YAP-TFE3 interactomes for the subsequent RNAi screen. For BioID mass spectrometry, two biological replicates were made for each cell line. Affinity purification and proximity biotinylation coupled to mass spectrometry were performed as described in Lambert et al., 2015. SAINT (significance analysis of interactome) analysis (Choi et al., 2011) was performed on the mass spectrometry data, using 10 controls compressed to 5. Only proteins with iProphet protein probability ≥ 0.95 were used. Results are expressed in dotplot format. Each prey protein is represented as a dot, with color signifying average spectral count, the darkness indicating average spectral count between the two biological replicates (the darker the dot, the higher the average spectral count), and the size represents the relative abundance. Darkness of the ring indicates the Bayesian False Discovery Rate (BFDR); black (FDR ≤ 0.01), blue (FDR ≤ 0.05), light blue (FDR > 0.05). The data was filtered so that each prey had a minimum of 10 spectral counts in at least one of the biological replicates.
Figure 6—figure supplement 1.
Figure 6—figure supplement 1.. BioID Mass Spectrometry shows that YAP-TFE3 and TAZ-CAMTA1 have an altered interactome compared to YAP and TAZ.
Group (A) prey proteins often demonstrated a loss of interaction with the fusion proteins. Group (B) prey proteins demonstrated enhanced interaction with the fusion proteins relative to TAZ and YAP and generally consisted of epigenetic modifiers and also interacted with CAMTA1 and TFE3. Group (C) prey proteins predominantly demonstrated enhanced interactions with TAZ-CAMTA1 relative to TAZ, and predominantly represented epigenetic modifiers. (D) Protein quantification table for YAP-TFE3 and YAP control showing similar expression levels. Biological replicates are represented. (E) Protein quantification table for TAZ-CAMTA1 and TAZ control showing similar expression levels. Biological replicates are represented. Results demonstrated in dot plot form. Size of dot is proportionate to relative abundance. Darkness of dot is proportionate to the spectral count. Darkness of the ring indicates the Bayesian False Discovery Rate (BFDR); black (FDR ≤ 0.01), blue (FDR ≤ 0.05), light blue (FDR > 0.05).
Figure 7.
Figure 7.. RNAi screen shows subunits of the ATAC complex mediate the transforming capacity of TAZ-CAMTA1 and YAP-TFE3.
(A) Overview of RNAi screen. SW872 cells expressing TAZ-CAMTA1 are transduced with five shRNAs for each gene in the shared TAZ-CAMTA1/YAP-TFE3 interactome and proliferation assayed on poly-HEMA-coated plates. (B) Poly-HEMA assay with SW872 cells expressing TAZ-CAMTA1. (C) Table with rank ordering of shared prey proteins after RNAi screen according to shRNAs causing a decrease in anchorage-independent growth. (D–H) Proliferation curves for prey proteins/genes with the highest number of shRNAs demonstrating a reduction in anchorage-independent growth on poly-HEMA coated plates. For poly-HEMA proliferation assays, statistical significance was evaluated using fold change increase in proliferation at day 10 with an unpaired two-tailed t-test. Error bars were used to define one standard deviation. For all panels, ****p<0.0001, ***p<0.001, **p<0.01, *p<0.05.
Figure 7—figure supplement 1.
Figure 7—figure supplement 1.. RNAi screen identifies epigenetic modifiers important for the activity of TAZ-CAMTA1 and YAP-TFE3.
(A–F) Additional epigenetic modifiers with at least one shRNA showing a deficit in anchorage-independent growth in SW872 TAZ-CAMTA1 cells. (G) Knock-down of YEATS2 in SW872 YAP-TFE3 cells by qRT-PCR. Knock-down of YEATS2 demonstrated a deficit in anchorage-independent growth in SW872 YAP-TFE3 cells when assayed by poly-HEMA assay (H) and soft agar (I). For soft agar assays, statistical significance was evaluated using an unpaired two-tailed t-test. For poly-HEMA proliferation assays, statistical significance was evaluated using fold change increase in proliferation at day 10 with an unpaired two-tailed t-test. For quantitative RT-PCR, standard deviation was calculated from fold change values for each triplicate. Experiments were repeated at least twice. For all panels, ****p<0.0001, ***p<0.001, **p<0.01, *p<0.05.
Figure 8.
Figure 8.. The ATAC complex is critical for the oncogenic transcriptomes of the fusion proteins.
(A) Principal component analysis showing the effect of knock-down of YEATS2 or ZZZ3 on the TAZ-CAMTA1 and YAP-TFE3 transcriptomes. (B) Genes with at least a two-fold decrease in at least two of the four conditions (YT shYEATS2, YT shZZZ3, TC shYEATS2, and TC shZZZ3); top genes most down-regulated according to aforementioned filter. N/A indicates gene was not differentially expressed in the data set. ND indicates there was no decrease in expression. (C) Extracellular matrix-related downregulated genes in part B validated by quantitative RT-PCR. (D) Scatter plot of two types of pathway enrichment evidence: probability of over-representation (pORA) and probability of accumulation (pAcc) as calculated by iPathwayGuide for SW872 YAP-TFE3 cells with knock-down of YEATS2 or ZZZ3. (E) Intersection of differentially expressed genes after knock-down of YEATS2 in SW872 YAP-TFE3 cells with open chromatin regions unique to YAP-TFE3 expressing cells (not present with empty vector). (F) Intersection of differentially expressed genes after knock-down of ZZZ3 in SW872 YAP-TFE3 cells with open chromatin regions unique to YAP-TFE3 expressing cells (not present with empty vector). (G) Working model of TAZ-CAMTA1:ATAC complex. (H) Vitronectin expression in epithelioid hemangioendothelioma (EHE) compared to epithelioid angiosarcoma (E–AS) and epithelioid hemangioma (EH). Vitronectin expression could be more focal (top example of EHE) and secreted in the ECM between neoplastic cells (demonstrated by arrow) or more diffusely expressed in the ECM (bottom example of EHE). Overall survival curves as a function of YEATS2 (I) and ZZZ3 RNA expression (J) across different histological types of sarcoma utilizing RNA-Seq expression data for The Cancer Genome Atlas (TCGA). RNA-Seq experiments in SW872 cells were performed using biological duplicates for each of the conditions. For gene expression data, the population was set to the total number of recovered genes with the mean of five counts across all samples. ATAC-Seq experiments in SW872 cells were performed using biological triplicates for each of the conditions (expression constructs). For ATAC-Seq analysis, the population was set as the total number of genes annotated across all conditions. For quantitative RT-PCR, standard deviation was calculated from fold change values for each triplicate. Error bars were used to define one standard deviation. For Kaplan-Meier curves significance was determined by Log-rank (Mantel-Cox) test. Each experiment was repeated at least twice. For all panels, ****p<0.0001, ***p<0.001, **p<0.01, *p<0.05.
Figure 8—figure supplement 1.
Figure 8—figure supplement 1.. Validation of mass spectrometry/RNAi screen.
(A) Knock-down of YEATS2 in SW872 TAZ-CAMTA1 cells by qRT-PCR. (B) Soft agar assay for SW872 TAZ-CAMTA1 cells after YEATS2 knock-down. (C) Knock-down of ZZZ3 in SW872 TAZ-CAMTA1 cells evaluated by western blot. (D) Soft agar assay after ZZZ3 knock-down in SW872 TAZ-CAMTA1 cells. (E) Co-immunoprecipitation experiment (Co-IP) in HEK293 cells expressing Flag-TAZ-CAMTA1 or Flag-TAZ control. Myc-KAT14 is transiently transfected. Flag-TAZ-CAMTA1 demonstrates an enrichment for Myc-KAT14 relative to IgG control after Flag pull-down. In contrast, the Flag-TAZ control does not demonstrate enrichment of Myc-KAT14 relative to IgG control after Flag pull-down. (F) Co-IP in HEK293 cells expressing Flag-YAP-TFE3. Myc-KAT14 is transiently transfected. (G) Co-IP in SW872 cells expressing TAZ-CAMTA1. Myc-KAT14 is transiently transfected. Each experiment was repeated at least twice. For all panels, ****p<0.0001, ***p<0.001, **p<0.01, *p<0.05.
Figure 8—figure supplement 2.
Figure 8—figure supplement 2.. The ATAC complex modulates expression of the MAPK signaling pathway, the PI3K signaling pathway, and extracellular matrix (ECM) proteins.
(A) Knock-down of YEATS2 in YAP-TFE3 expressing SW872 cells inhibited expression of components of MAPK signaling by iPathwayGuide analysis. (B) Upregulation of PI3K-Akt signaling in SW872 cells expressing YAP-TFE3. (C) Knock-down of YEATS2 in SW872 YAP-TFE3 cells resulted in downregulation of the PI3K signaling pathway. (D) Knock-down of ZZZ3 in SW872 YAP-TFE3 cells resulted in downregulation of the PI3K signaling pathway. (E) Expression of COL1A1 and CTGF in the ECM matrix surrounding the neoplastic cells in EHE 1. Arrow shows perinuclear expression/cytoplasmic expression of CTGF. (F) Expression of FBLN5 in the cytoplasm of EHE 2.

Similar articles

Cited by

References

    1. Antonescu CR, Le Loarer F, Mosquera JM, Sboner A, Zhang L, Chen CL, Chen HW, Pathan N, Krausz T, Dickson BC, Weinreb I, Rubin MA, Hameed M, Fletcher CD. Novel YAP1-TFE3 fusion defines a distinct subset of epithelioid hemangioendothelioma. Genes, Chromosomes and Cancer. 2013;52:775–784. doi: 10.1002/gcc.22073. - DOI - PMC - PubMed
    1. Antonescu CR, Dickson BC, Sung YS, Zhang L, Suurmeijer AJH, Stenzinger A, Mechtersheimer G, Fletcher CDM. Recurrent YAP1 and MAML2 gene rearrangements in retiform and composite hemangioendothelioma. American Journal of Surgical Pathology. 2020;44:1677–1684. doi: 10.1097/PAS.0000000000001575. - DOI - PMC - PubMed
    1. Argani P, Lui MY, Couturier J, Bouvier R, Fournet JC, Ladanyi M. A novel CLTC-TFE3 gene fusion in pediatric renal adenocarcinoma with t(X;17)(p11.2;q23) Oncogene. 2003;22:5374–5378. doi: 10.1038/sj.onc.1206686. - DOI - PubMed
    1. Beckmann H, Su LK, Kadesch T. TFE3: a helix-loop-helix protein that activates transcription through the immunoglobulin enhancer muE3 motif. Genes & Development. 1990;4:167–179. doi: 10.1101/gad.4.2.167. - DOI - PubMed
    1. Beird HC, Wu CC, Ingram DR, Wang WL, Alimohamed A, Gumbs C, Little L, Song X, Feig BW, Roland CL, Zhang J, Benjamin RS, Hwu P, Lazar AJ, Futreal PA, Somaiah N. Genomic profiling of dedifferentiated liposarcoma compared to matched well-differentiated liposarcoma reveals higher genomic complexity and a common origin. Molecular Case Studies. 2018;4:a002386. doi: 10.1101/mcs.a002386. - DOI - PMC - PubMed

Publication types

MeSH terms

Substances

Associated data