

The influence of routine uncomplicated phacoemulsification on the orthogonality of the cornea
- PMID: 33913835
- PMCID: PMC8186582
- DOI: 10.4103/ijo.IJO_1168_20
The influence of routine uncomplicated phacoemulsification on the orthogonality of the cornea
Abstract
Purpose: The aim of this study was to determine the effect of routine uncomplicated phacoemulsification on the orthogonal distribution of mass within the central optical zone of the cornea.
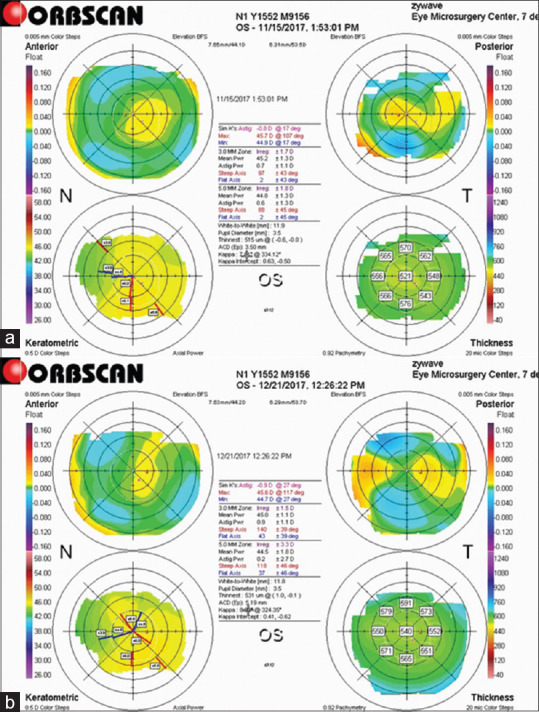
Methods: Astigmatism at both corneal surfaces was evaluated using Orbscan II (Bausch &and Lomb) before and up to 3 months after routine phacoemulsification (one eye/patient). The data were subjected to vector analysis to estimate the pre-and postoperative total astigmatism of the cornea (TCA).
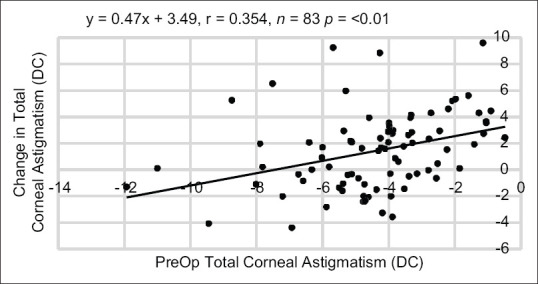
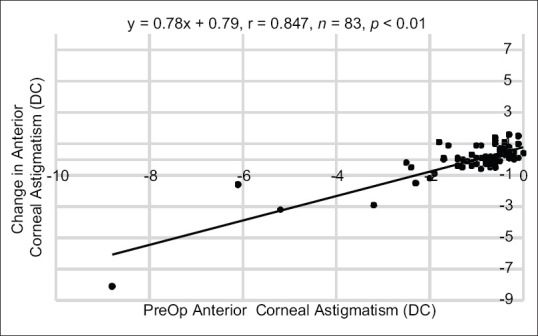
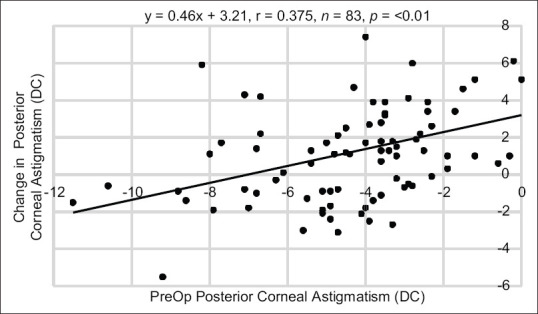
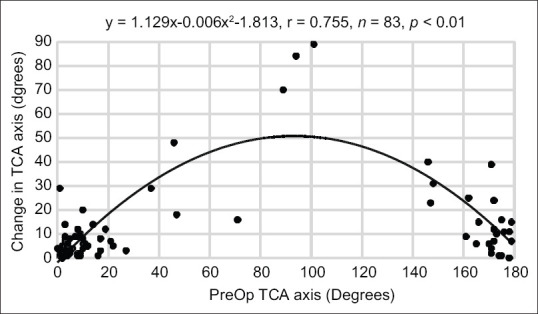
Results: Reporting the chief findings in minus cylinder (diopters, DC) over the central 3 mm (A) and 5 mm (B) optical zones. Mean TCA powers (±sd) at pre- and 3-months postop were A) -4.45DC (±2.00) and -5.69DC (±2.69), B) -2.91DC (±2.22) and -2.71DC (±1.60). Change in mean power was significant over 3 mm (P < 0.01, n = 49) but not over 5 mm. Inter-zonal differences were significant (P < 0.01). There was a significant linear relationship between the change in TCA power (y = preoperative-postoperative) and TCA at preoperative stage (x) where, A) y = 0.45x + 3.12 (r = 0.336, n = 49, P = 0.018), B) y = x + 2.65 (r = 0.753, n = 49, P = <0.01). Over the central 3 mm zone only, change (preoperative-postoperative) in axis (°) of TCA (y1) was significantly associated with TCA axis at preoperative stage (x1) where y1 = 1.391x1-0.008x12-0.701 (r = 0.635, n = 49, P < 0.01).
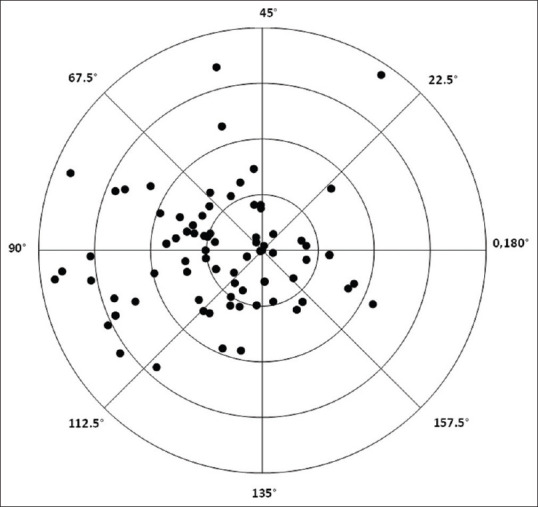
Conclusion: Changes in TCA power and axis at 3 months postop, determined using Orbscan II, are indicative of orthogonal alterations in the distribution of corneal tissue. Over the central 3 mm zone, the association between y1 and x1 shows that a change in TCA axis is more profound when preoperative axis is near 90° i.e., against-the-rule.
Keywords: Astigmatism; corneal; surface; total.
Conflict of interest statement
None
Figures
Similar articles
-
The Impact of Changes in Corneal Back Surface Astigmatism on the Residual Astigmatic Refractive Error following Routine Uncomplicated Phacoemulsification.J Ophthalmol. 2020 Jul 22;2020:7395081. doi: 10.1155/2020/7395081. eCollection 2020. J Ophthalmol. 2020. PMID: 32774910 Free PMC article.
-
Choosing the location of corneal incision based on preexisting astigmatism in phacoemulsification.Am J Ophthalmol. 2005 May;139(5):767-76. doi: 10.1016/j.ajo.2004.12.057. Am J Ophthalmol. 2005. PMID: 15860279 Clinical Trial.
-
Five-Year Changes in Corneal Astigmatism After Combined Femtosecond-Assisted Phacoemulsification and Arcuate Keratotomy.Am J Ophthalmol. 2020 Sep;217:232-239. doi: 10.1016/j.ajo.2020.05.004. Epub 2020 May 11. Am J Ophthalmol. 2020. PMID: 32437671
-
Torsional and flattening effect on corneal astigmatism after cataract surgery: a retrospective analysis.BMC Ophthalmol. 2017 Feb 8;17(1):10. doi: 10.1186/s12886-017-0399-1. BMC Ophthalmol. 2017. PMID: 28178925 Free PMC article.
-
Corneal Diameter as a Factor Influencing Corneal Astigmatism After Cataract Surgery.Cornea. 2016 Jan;35(1):132-6. doi: 10.1097/ICO.0000000000000668. Cornea. 2016. PMID: 26555586
Cited by
-
Spotlight on the Corneal Back Surface Astigmatism: A Review.Clin Ophthalmol. 2021 Jul 26;15:3157-3164. doi: 10.2147/OPTH.S284616. eCollection 2021. Clin Ophthalmol. 2021. PMID: 34345163 Free PMC article. Review.
-
Surgical approaches to correct corneal astigmatism at time of cataract surgery: a mini-review.Int J Ophthalmol. 2024 Jul 18;17(7):1370-1374. doi: 10.18240/ijo.2024.07.23. eCollection 2024. Int J Ophthalmol. 2024. PMID: 39026920 Free PMC article. Review.
References
-
- Praeger DL, Schneider HA. Corneal thickness measurements following intraocular lens implantation. Ophthalmic Surg. 1977;8:97–101. - PubMed
-
- Vargas JM, McCulley JP, Bowman RW, Johnson WE, Jani BR, Shen J. Effect of phacoemulsification on corneal thickness. Am J Ophthalmol. 2003;136:171–2. - PubMed
-
- Oliveira CM, Ribeiro C, Franco S. Corneal imaging with slit-scanning and Scheimpflug imaging techniques. Clin Exp Optom. 2011;94:33–42. - PubMed
MeSH terms
LinkOut - more resources
Full Text Sources
Other Literature Sources
Research Materials
