Endotrophin, a collagen type VI-derived matrikine, reflects the degree of renal fibrosis in patients with IgA nephropathy and in patients with ANCA-associated vasculitis
- PMID: 33914059
- PMCID: PMC9130028
- DOI: 10.1093/ndt/gfab163
Endotrophin, a collagen type VI-derived matrikine, reflects the degree of renal fibrosis in patients with IgA nephropathy and in patients with ANCA-associated vasculitis
Abstract
Background: Renal fibrosis is the hallmark of chronic kidney disease (CKD) and is characterized by an imbalanced extracellular matrix remodelling. Endotrophin (ETP) is a signalling molecule released from collagen type VI (COL VI). ETP can be measured by the PRO-C6 assay, which quantifies the levels of COL VI formation. ETP levels were previously associated with mortality and disease progression in patients with CKD. We hypothesized that serum and urinary ETP levels correlate with the degree of interstitial fibrosis in kidney biopsies from patients with immunoglobulin A nephropathy (IgAN) and patients with anti-neutrophil cytoplasmic antibody-associated vasculitis (AAV).
Methods: We examined a cohort of 49 IgAN and 47 AAV patients. A validation cohort of 85 IgAN patients was included. ETP was measured in serum (S-ETP) and urine (U-ETP/Cr) samples, taken on the same day before renal biopsy was performed, using the enzyme-linked immunosorbent assay PRO-C6. The biopsies were evaluated for interstitial fibrosis and tubular atrophy according to the Banff and MEST-C scores.
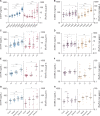
Results: S-ETP and U-ETP/Cr levels correlated with kidney function, increased CKD severity, correlated with the extent of interstitial fibrosis and gradually increased with increasing degree of interstitial fibrosis and tubular atrophy. ETP outperformed the known fibrosis biomarker Dickkopf-3 for discrimination of patients with high fibrotic burden. The association of S-ETP and U-ETP/Cr with the level of kidney fibrosis was confirmed in the validation cohort.
Conclusions: We demonstrated that high levels of circulating and excreted ETP are not only indicative of lower kidney function, but also reflect the burden of fibrosis in the kidneys.
Keywords: ANCA-associated vasculitis; IgA nephropathy; biomarkers; chronic kidney disease; interstitial fibrosis.
© The Author(s) 2021. Published by Oxford University Press on behalf of ERA-EDTA.
Figures


Similar articles
-
Unique Biomarkers of Collagen Type III Remodeling Reflect Different Information Regarding Pathological Kidney Tissue Alterations in Patients with IgA Nephropathy.Biomolecules. 2023 Jul 8;13(7):1093. doi: 10.3390/biom13071093. Biomolecules. 2023. PMID: 37509129 Free PMC article.
-
Discovery of Fibrinogen γ-chain as a potential urinary biomarker for renal interstitial fibrosis in IgA nephropathy.BMC Nephrol. 2023 Mar 20;24(1):60. doi: 10.1186/s12882-023-03103-7. BMC Nephrol. 2023. PMID: 36941570 Free PMC article.
-
Relationship between blood neutrophil-lymphocyte ratio and renal tubular atrophy/interstitial fibrosis in IgA nephropathy patients.J Clin Lab Anal. 2021 Jun;35(6):e23774. doi: 10.1002/jcla.23774. Epub 2021 May 5. J Clin Lab Anal. 2021. PMID: 33951240 Free PMC article.
-
An unsuspected histopathological finding -concomitant IgA nephropathy in a patient with ANCA-associated vasculitis: a case report and literature review.Front Immunol. 2023 Aug 15;14:1227878. doi: 10.3389/fimmu.2023.1227878. eCollection 2023. Front Immunol. 2023. PMID: 37649475 Free PMC article. Review.
-
Endotrophin, a Key Marker and Driver for Fibroinflammatory Disease.Endocr Rev. 2024 May 7;45(3):361-378. doi: 10.1210/endrev/bnad036. Endocr Rev. 2024. PMID: 38091968 Free PMC article. Review.
Cited by
-
Biomarkers of fibrosis, kidney tissue injury and inflammation may predict severity and outcome of renal ANCA - associated vasculitis.Front Immunol. 2023 Mar 20;14:1122972. doi: 10.3389/fimmu.2023.1122972. eCollection 2023. Front Immunol. 2023. PMID: 37020541 Free PMC article.
-
Urinary Endotrophin and Long-term Outcomes in Kidney Transplant Recipients.Transplant Direct. 2024 Feb 21;10(3):e1591. doi: 10.1097/TXD.0000000000001591. eCollection 2024 Mar. Transplant Direct. 2024. PMID: 39877646 Free PMC article.
-
Collagen formation, function and role in kidney disease.Nat Rev Nephrol. 2025 Mar;21(3):200-215. doi: 10.1038/s41581-024-00902-5. Epub 2024 Nov 15. Nat Rev Nephrol. 2025. PMID: 39548215 Review.
-
Plasma endotrophin, reflecting tissue fibrosis, is associated with graft failure and mortality in KTRs: results from two prospective cohort studies.Nephrol Dial Transplant. 2023 Mar 31;38(4):1041-1052. doi: 10.1093/ndt/gfac332. Nephrol Dial Transplant. 2023. PMID: 36535643 Free PMC article.
-
Matrikines in kidney ageing and age-related disease.Curr Opin Nephrol Hypertens. 2023 Nov 1;32(6):551-558. doi: 10.1097/MNH.0000000000000916. Epub 2023 Aug 16. Curr Opin Nephrol Hypertens. 2023. PMID: 37584348 Free PMC article. Review.
References
-
- Maixnerova D, Jancova E, Skibova J. et al. Nationwide biopsy survey of renal diseases in the Czech Republic during the years 1994–2011. J Nephrol 2014; 28: 39–49 - PubMed
-
- Coppo R, Davin JC.. The difficulty in considering modifiable pathology risk factors in children with IgA nephropathy: crescents and timing of renal biopsy. Pediatr Nephrol 2015; 30: 189–192 - PubMed
Publication types
MeSH terms
Substances
LinkOut - more resources
Full Text Sources
Other Literature Sources
Medical
Miscellaneous

