

Impact of Microdevice Geometry on Transit and Retention in the Murine Gastrointestinal Tract
- PMID: 33914503
- PMCID: PMC10389692
- DOI: 10.1021/acsbiomaterials.0c01606
Impact of Microdevice Geometry on Transit and Retention in the Murine Gastrointestinal Tract
Abstract
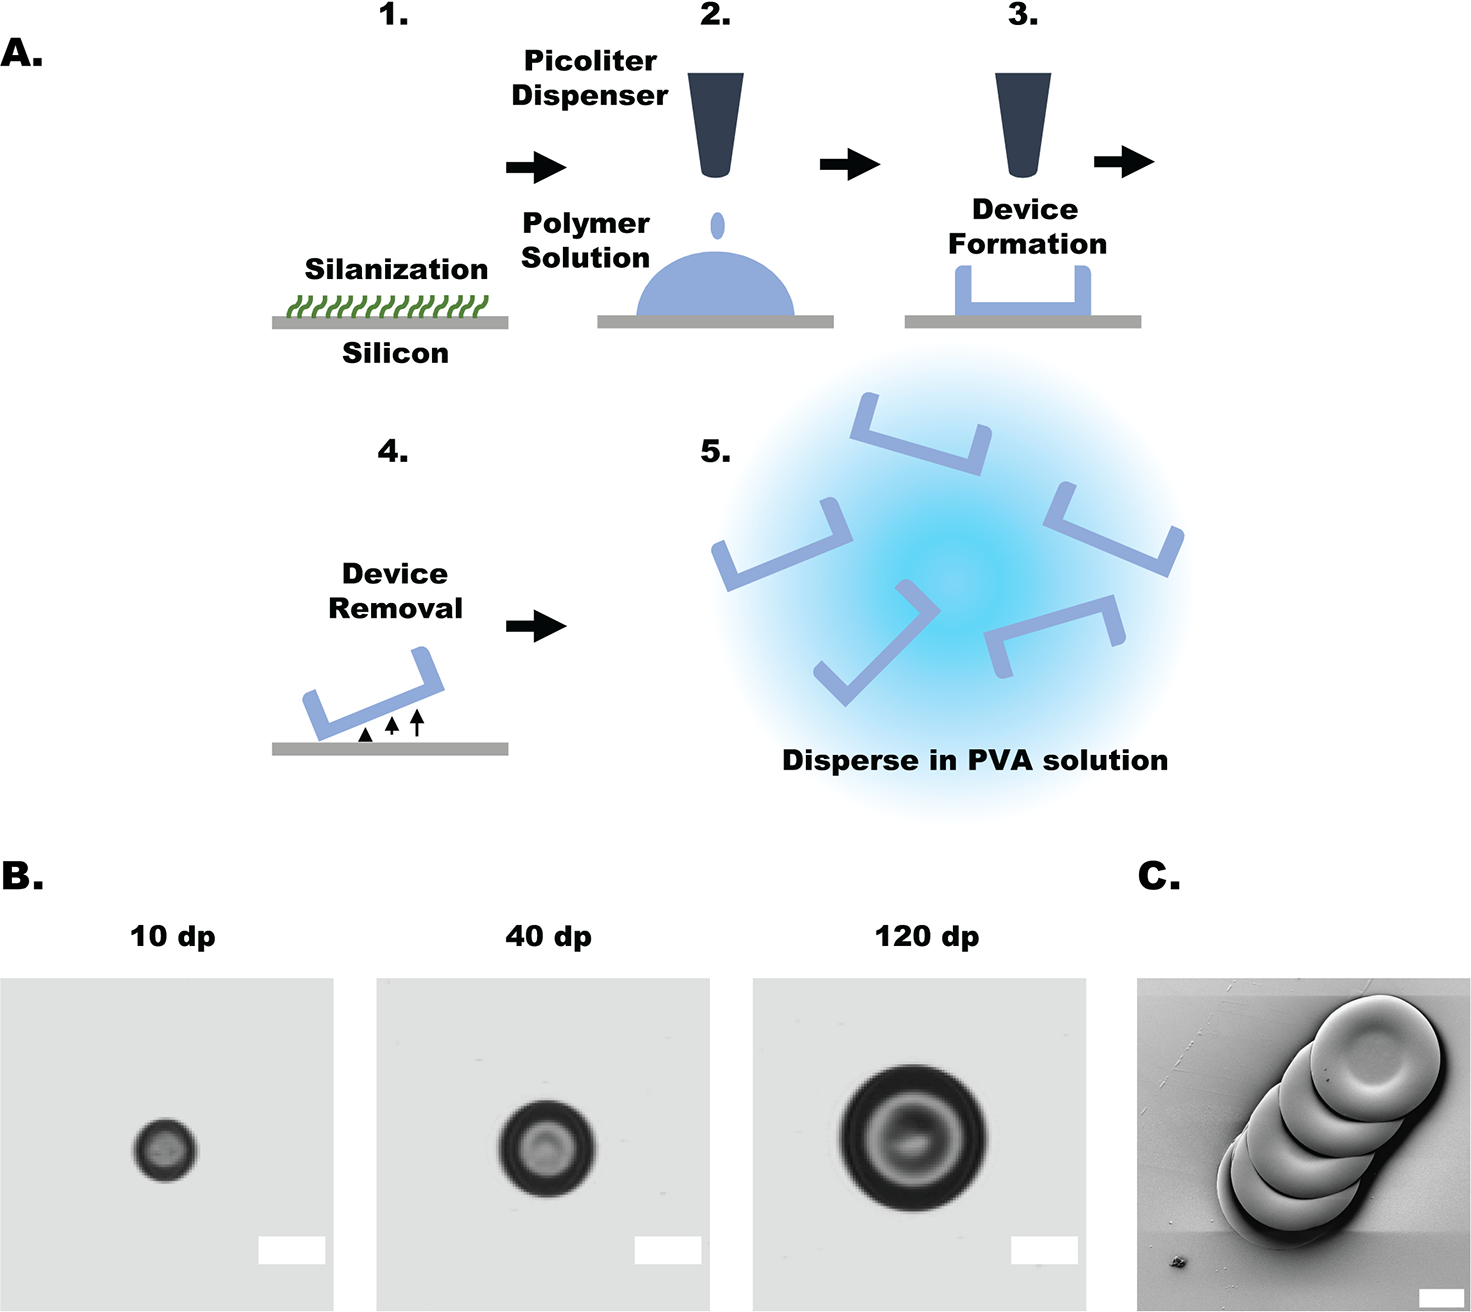
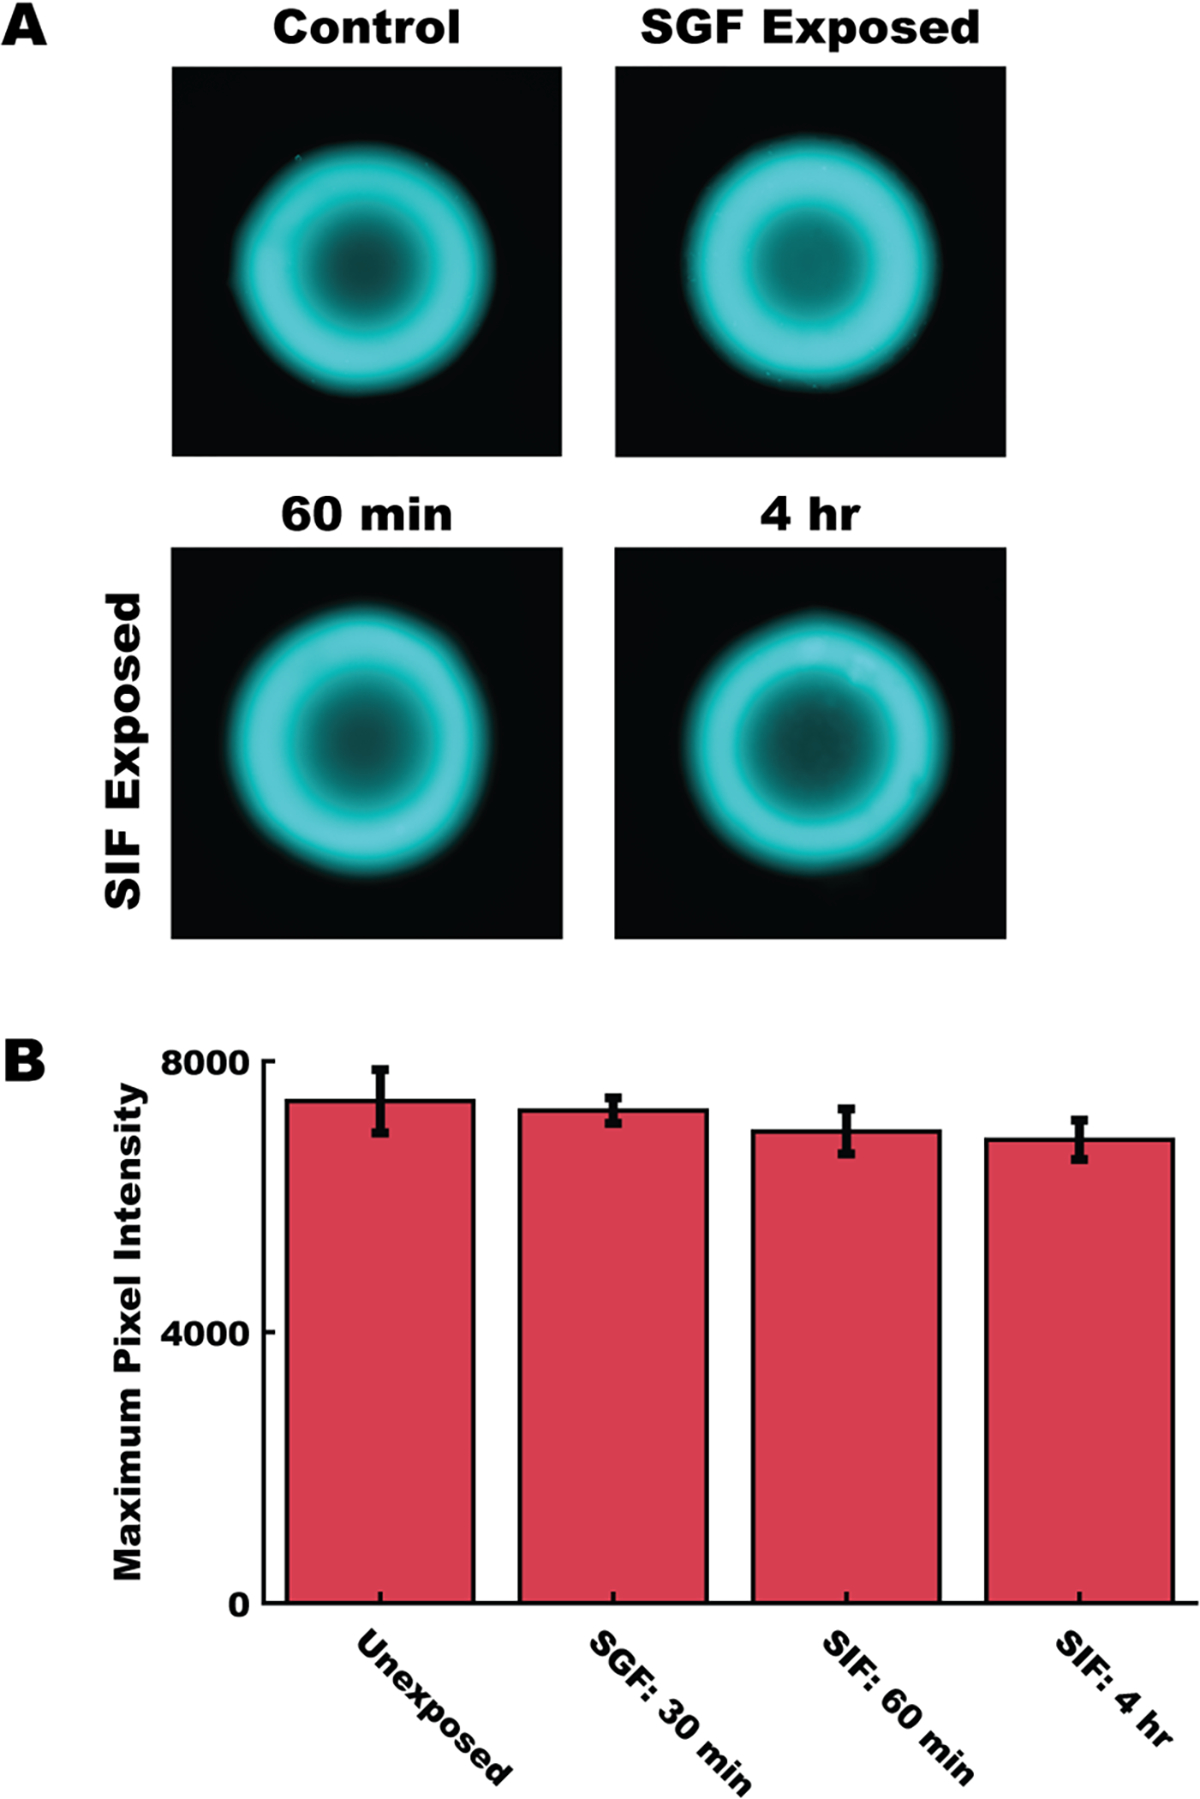
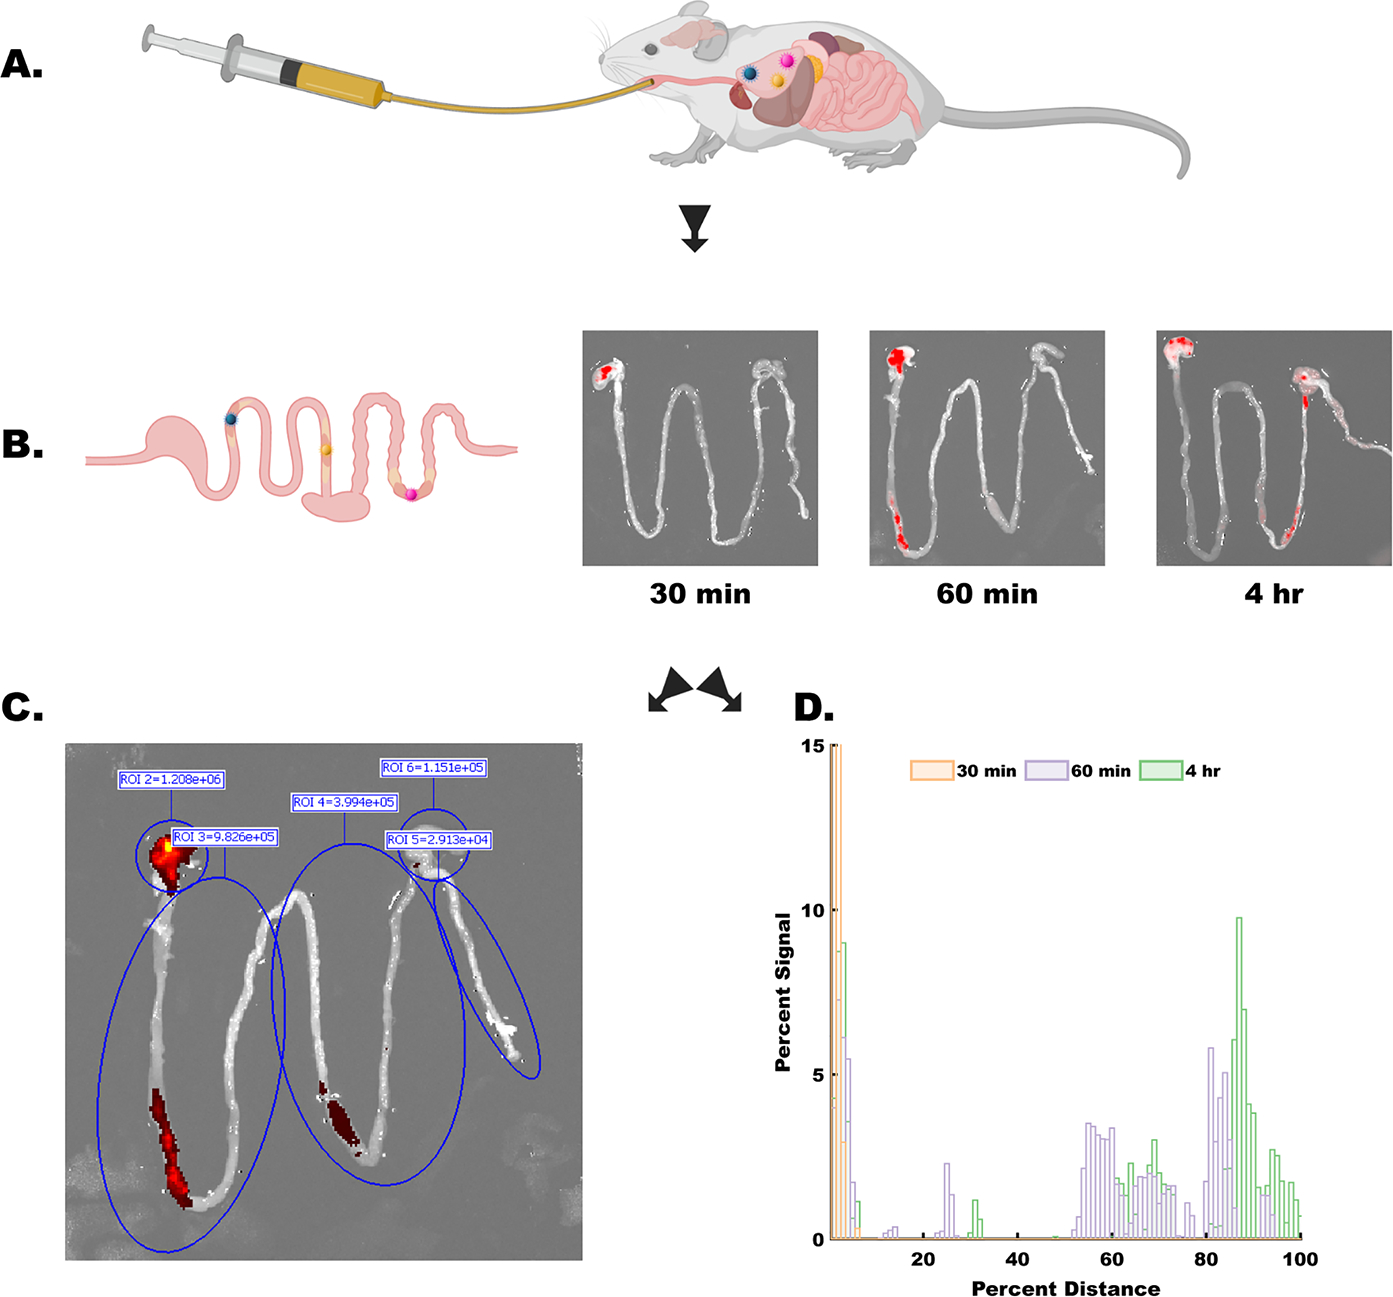
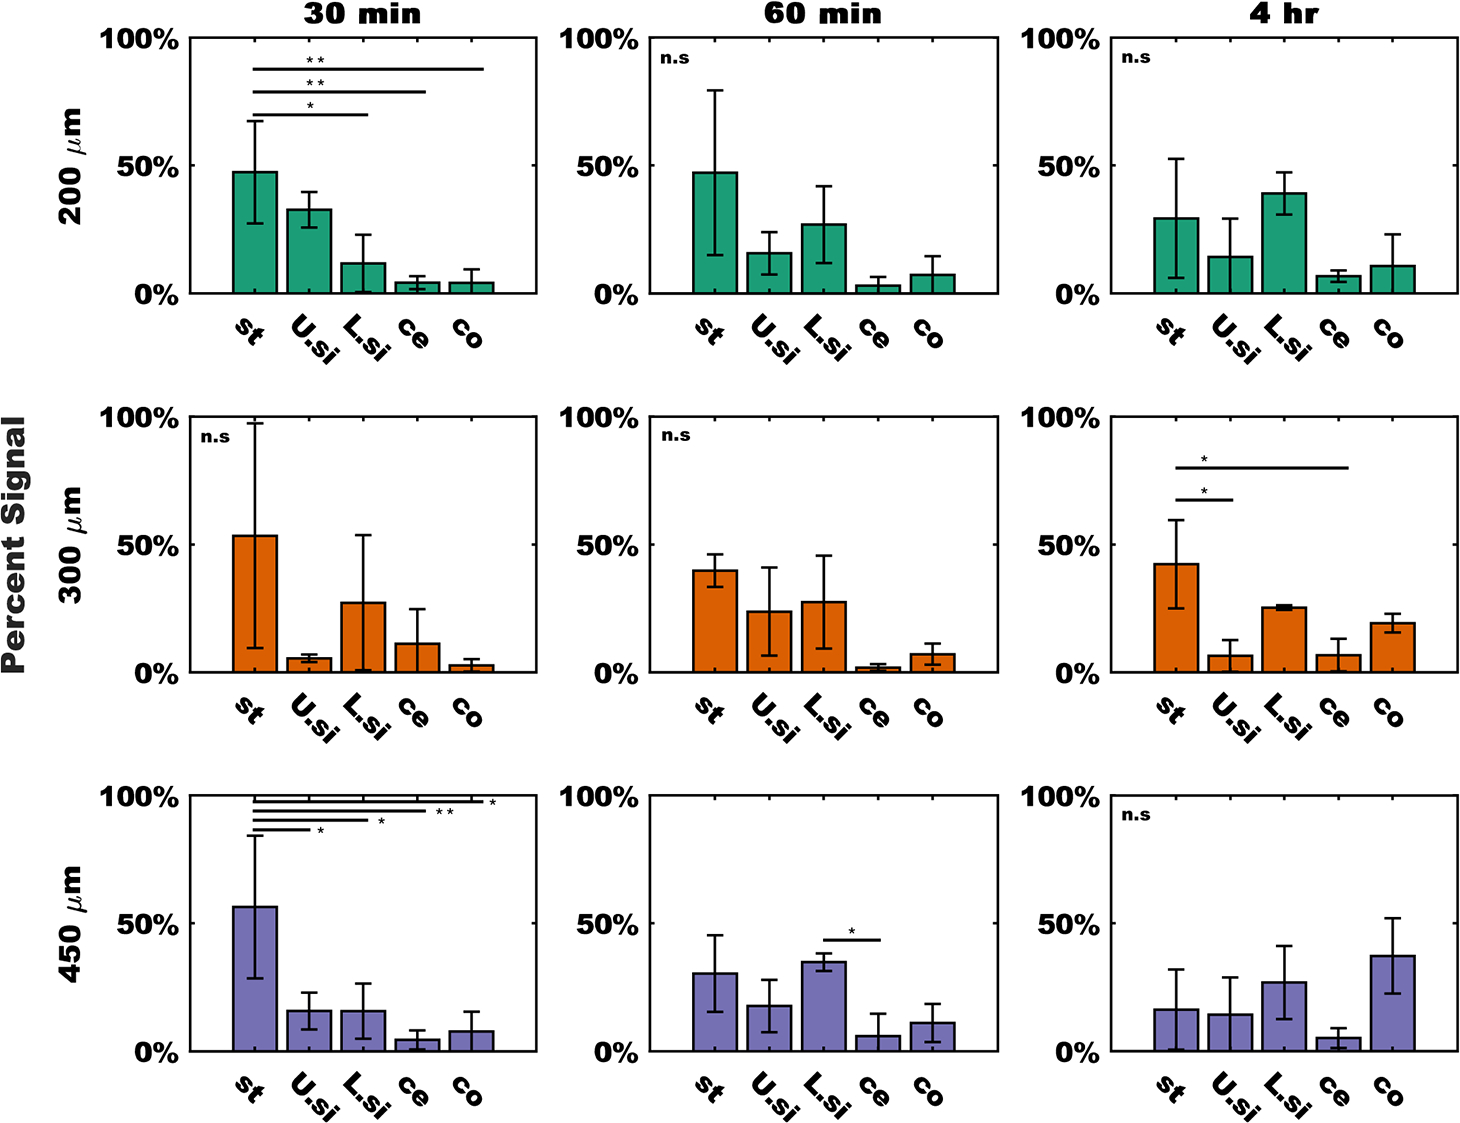
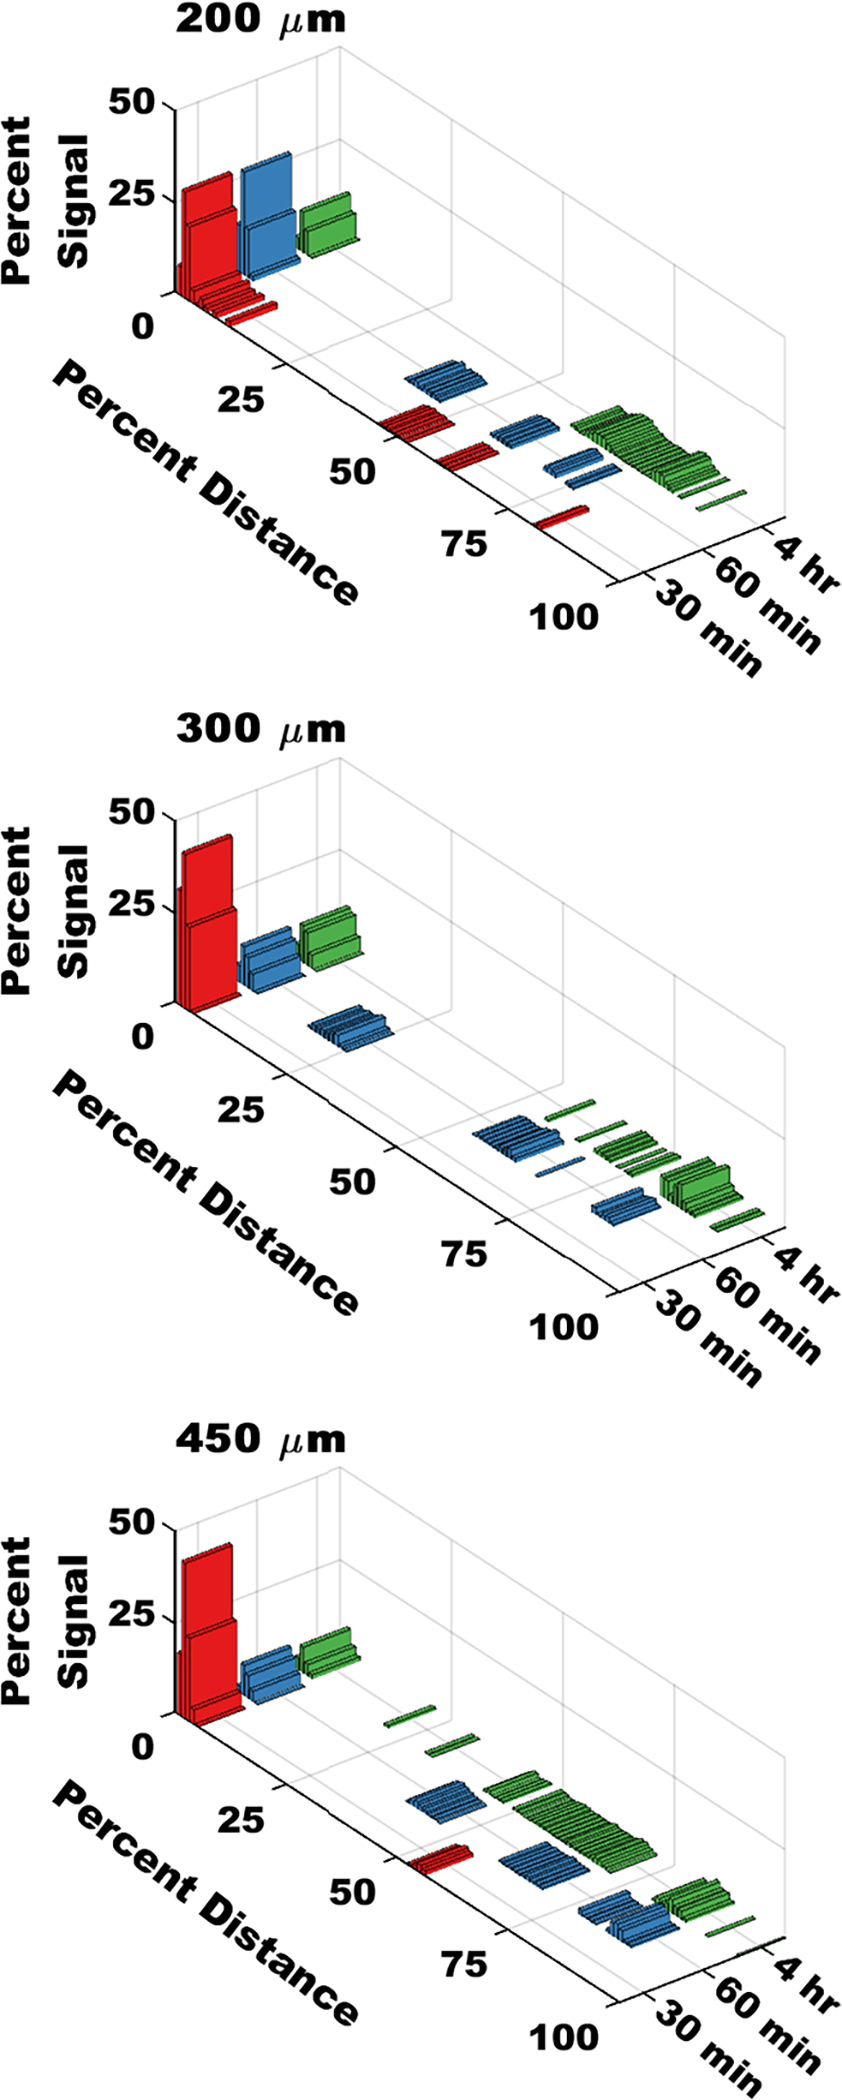
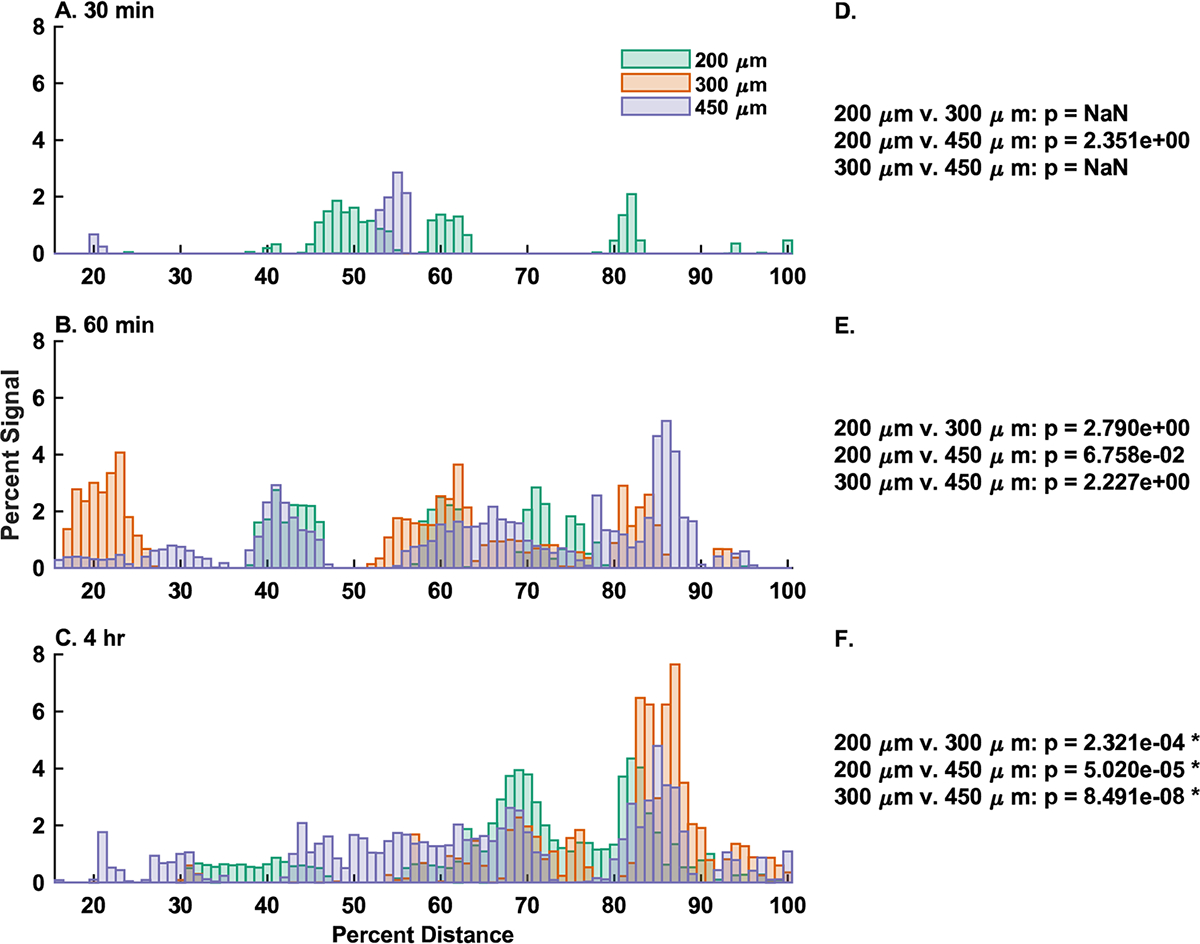
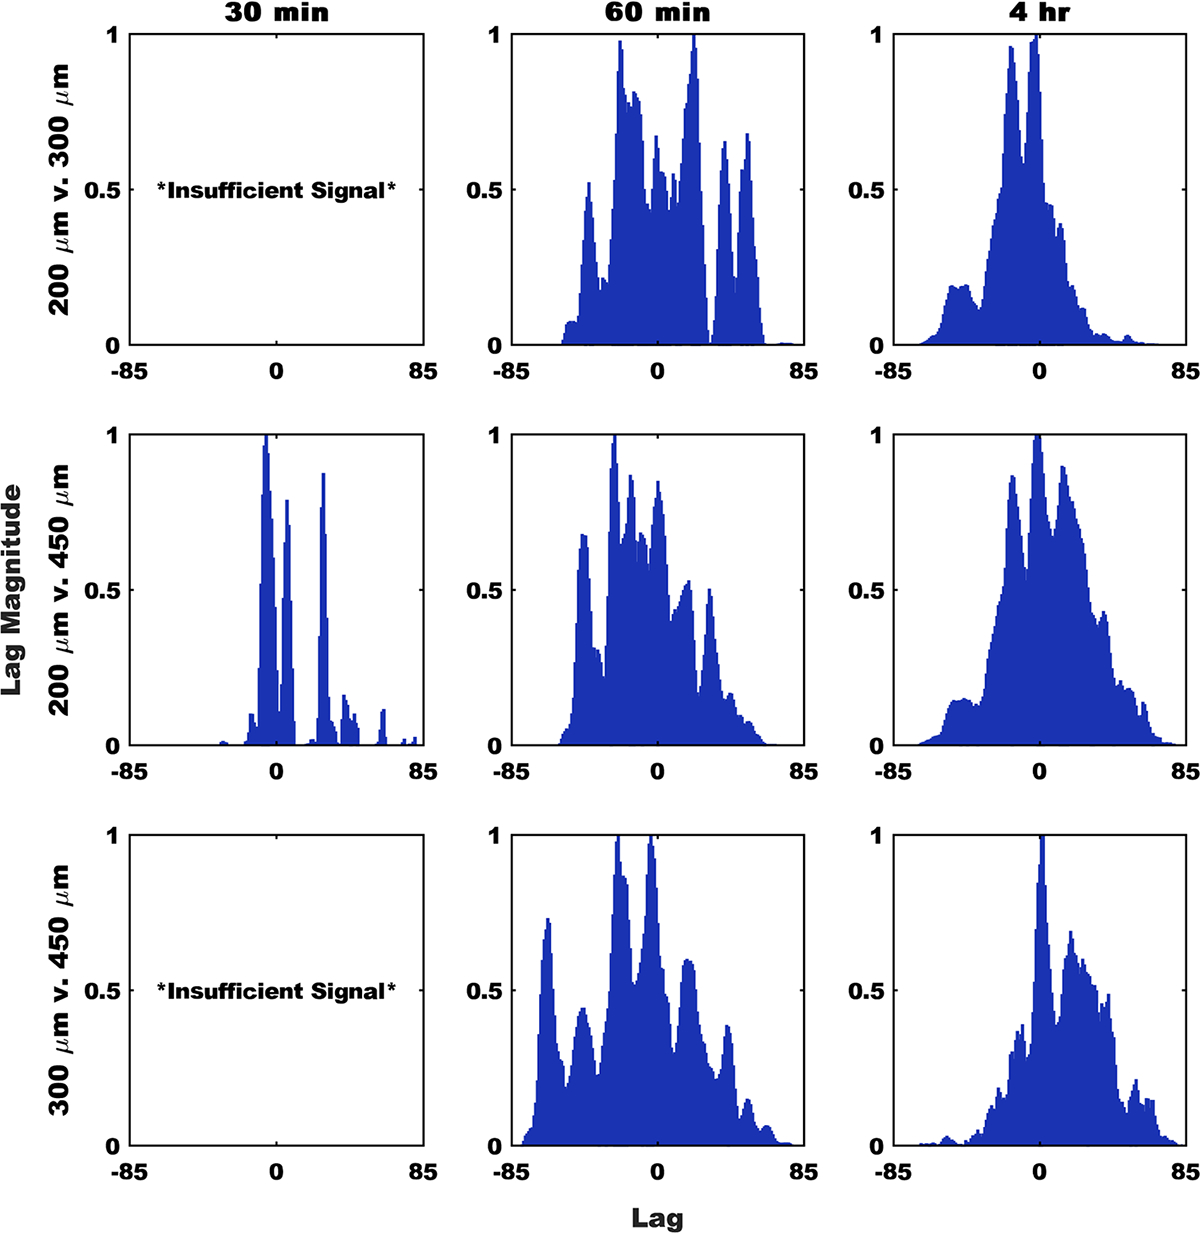
Oral protein delivery technologies often depend on encapsulating or enclosing the protein cargo to protect it against pH-driven degradation in the stomach or enzymatic digestion in the small intestine. An emergent methodology is to encapsulate therapeutics in microscale, asymmetric, planar microparticles, referred to as microdevices. Previous work has shown that, compared to spherical particles, planar microdevices have longer residence times in the GI tract, but it remains unclear how specific design choices (e.g., material selection, particle diameter) impact microdevice behavior in vivo. Recent advances in microdevice fabrication through picoliter printing have expanded the range of device sizes that can be fabricated in a rapid manner. However, relatively little work has explored how device size governs their behavior in the intestinal environment. In this study, we probe the impact of geometry of planar microdevices on their transit and accumulation in the murine GI tract. Additionally, we present a strategy to label, image, and quantify these distributions in intact tissue in a continuous manner, enabling a more detailed understanding of device distribution and transit kinetics than previously possible. We show that smaller particles (194.6 ± 7 μm.diameter) tend to empty from the stomach faster than midsize (293.2 ± 7 μm.diameter) and larger devices (440.9 ± 9 μm.diameter) and that larger devices distribute more broadly in the GI tract and exit slower than other geometries. In general, we observed an inverse correlation between device diameter and GI transit rate. These results inform the future design of drug delivery systems, using particle geometry as an engineering design parameter to control device accumulation and distribution in the GI tract. Additionally, our image analysis process provides greater insight into the tissue level distribution and transit of particle populations. Using this technique, we demonstrate that microdevices act and translocate independently, as opposed to transiting in one homogeneous mass, meaning that target sites will likely be exposed to devices multiple times over the course of hours post administration. This imaging technique and associated findings enable data-informed design of future particle delivery systems, allowing orthogonal control of transit and distribution kinetics in vivo independent of material and cargo selection.
Keywords: additive manufacturing; enteric materials; fluorescent tracking; gastrointestinal distribution; microdevices.
Conflict of interest statement
The authors declare no competing financial interest.
Figures
Similar articles
-
3D-Printed Radiopaque Microdevices with Enhanced Mucoadhesive Geometry for Oral Drug Delivery.Adv Healthc Mater. 2023 Feb;12(4):e2201897. doi: 10.1002/adhm.202201897. Epub 2022 Dec 4. Adv Healthc Mater. 2023. PMID: 36414017 Free PMC article.
-
Bottom-Up Fabrication of Multilayer Enteric Devices for the Oral Delivery of Peptides.Pharm Res. 2019 Apr 19;36(6):89. doi: 10.1007/s11095-019-2618-3. Pharm Res. 2019. PMID: 31004235
-
Picoliter-volume inkjet printing into planar microdevice reservoirs for low-waste, high-capacity drug loading.Bioeng Transl Med. 2017 Mar;2(1):9-16. doi: 10.1002/btm2.10053. Epub 2017 Feb 3. Bioeng Transl Med. 2017. PMID: 28503662 Free PMC article.
-
Orally ingestible medical devices for gut engineering.Adv Drug Deliv Rev. 2020;165-166:142-154. doi: 10.1016/j.addr.2020.05.004. Epub 2020 May 13. Adv Drug Deliv Rev. 2020. PMID: 32416112 Free PMC article. Review.
-
Planar bioadhesive microdevices: a new technology for oral drug delivery.Curr Pharm Biotechnol. 2014;15(7):673-83. doi: 10.2174/1389201015666140915152706. Curr Pharm Biotechnol. 2014. PMID: 25219863 Free PMC article. Review.
Cited by
-
Spiked Systems for Colonic Drug Delivery: Architectural Opportunities and Quality Assurance of Selective Laser Sintering.ACS Biomater Sci Eng. 2025 Mar 10;11(3):1818-1833. doi: 10.1021/acsbiomaterials.4c02038. Epub 2025 Feb 6. ACS Biomater Sci Eng. 2025. PMID: 39912506 Free PMC article.
-
3D-Printed Radiopaque Microdevices with Enhanced Mucoadhesive Geometry for Oral Drug Delivery.Adv Healthc Mater. 2023 Feb;12(4):e2201897. doi: 10.1002/adhm.202201897. Epub 2022 Dec 4. Adv Healthc Mater. 2023. PMID: 36414017 Free PMC article.
References
-
- Brown TD; Whitehead KA; Mitragotri S Materials for Oral Delivery of Proteins and Peptides. Nat. Rev. Mater. 2020, 5, 127.
Publication types
MeSH terms
Grants and funding
LinkOut - more resources
Full Text Sources
Other Literature Sources