. 2021 Jun 15;131(12):e143691.
doi: 10.1172/JCI143691.

HIF-2α activation potentiates oxidative cell death in colorectal cancers by increasing cellular iron

Affiliations

HIF-2α activation potentiates oxidative cell death in colorectal cancers by increasing cellular iron

Rashi Singhal et al. J Clin Invest. .

Abstract

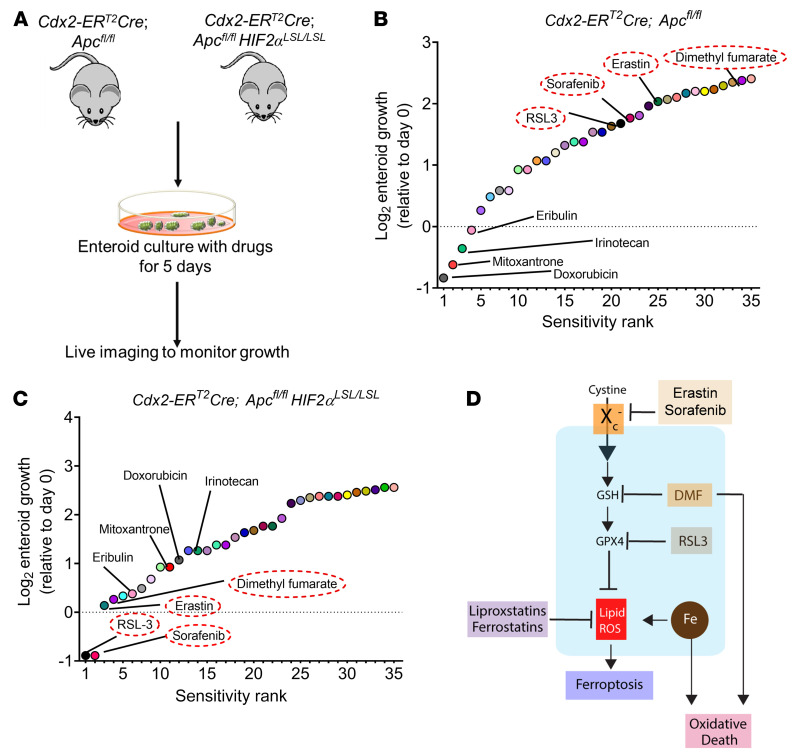
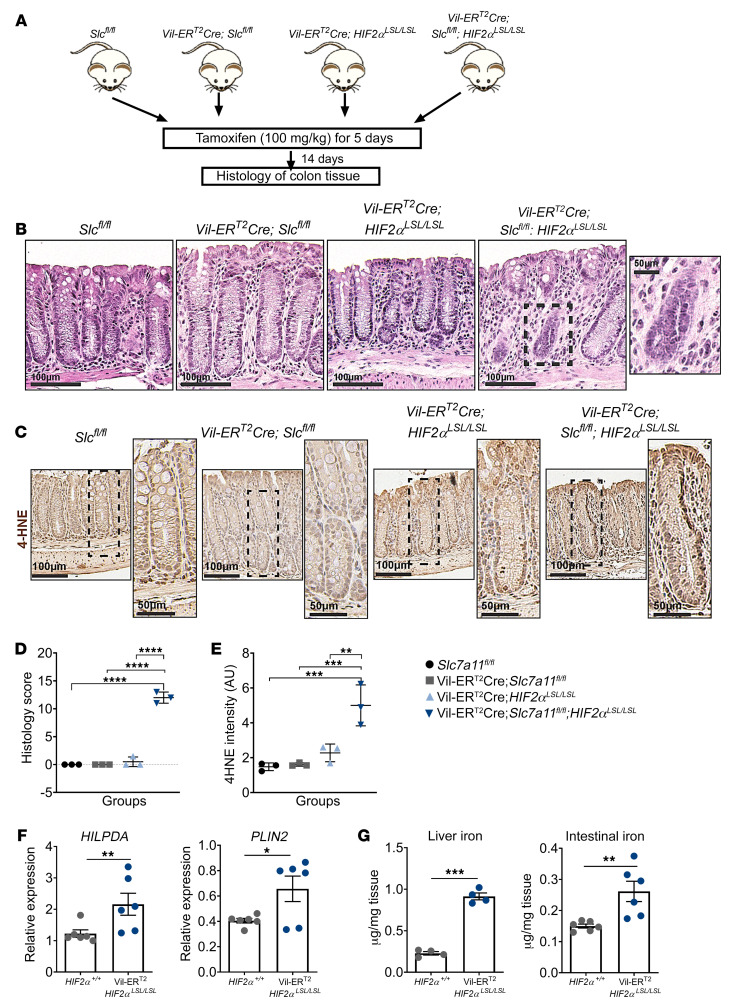
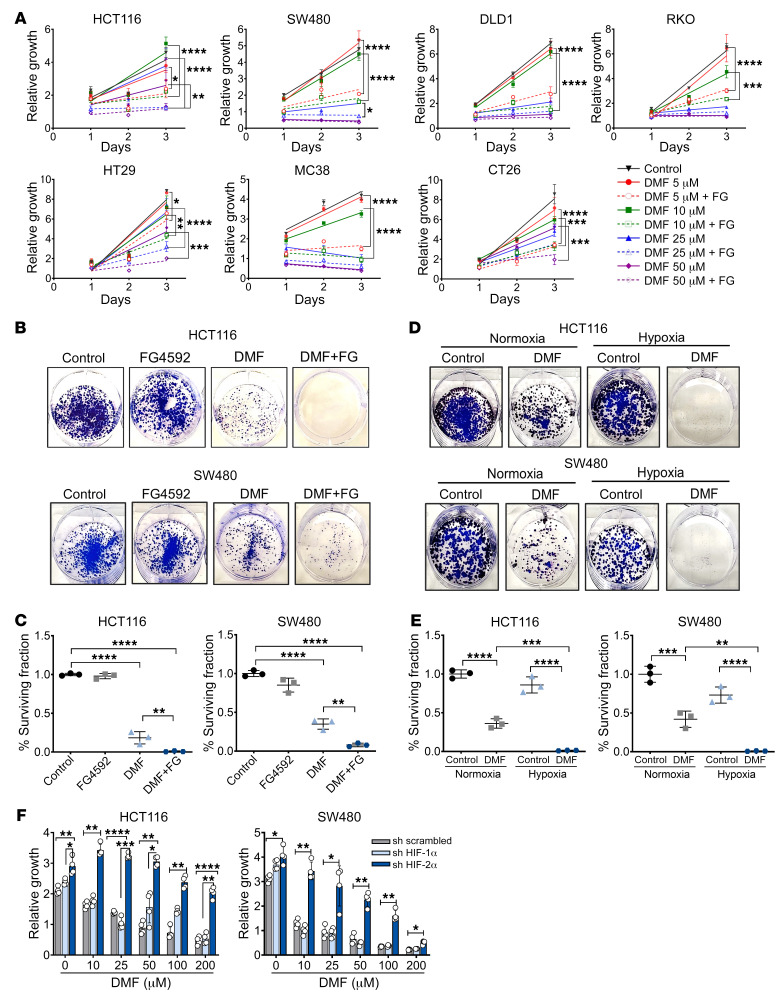
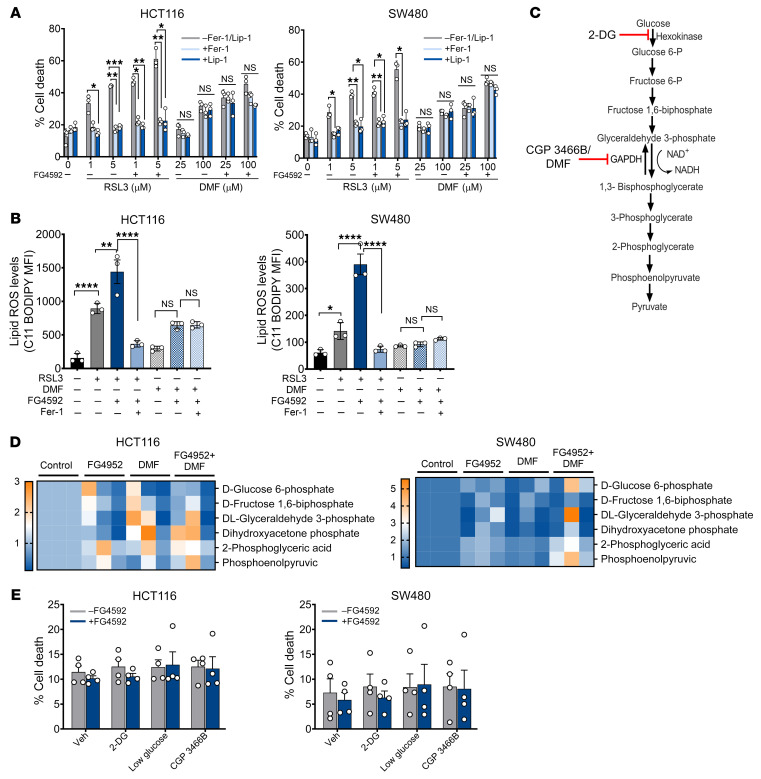
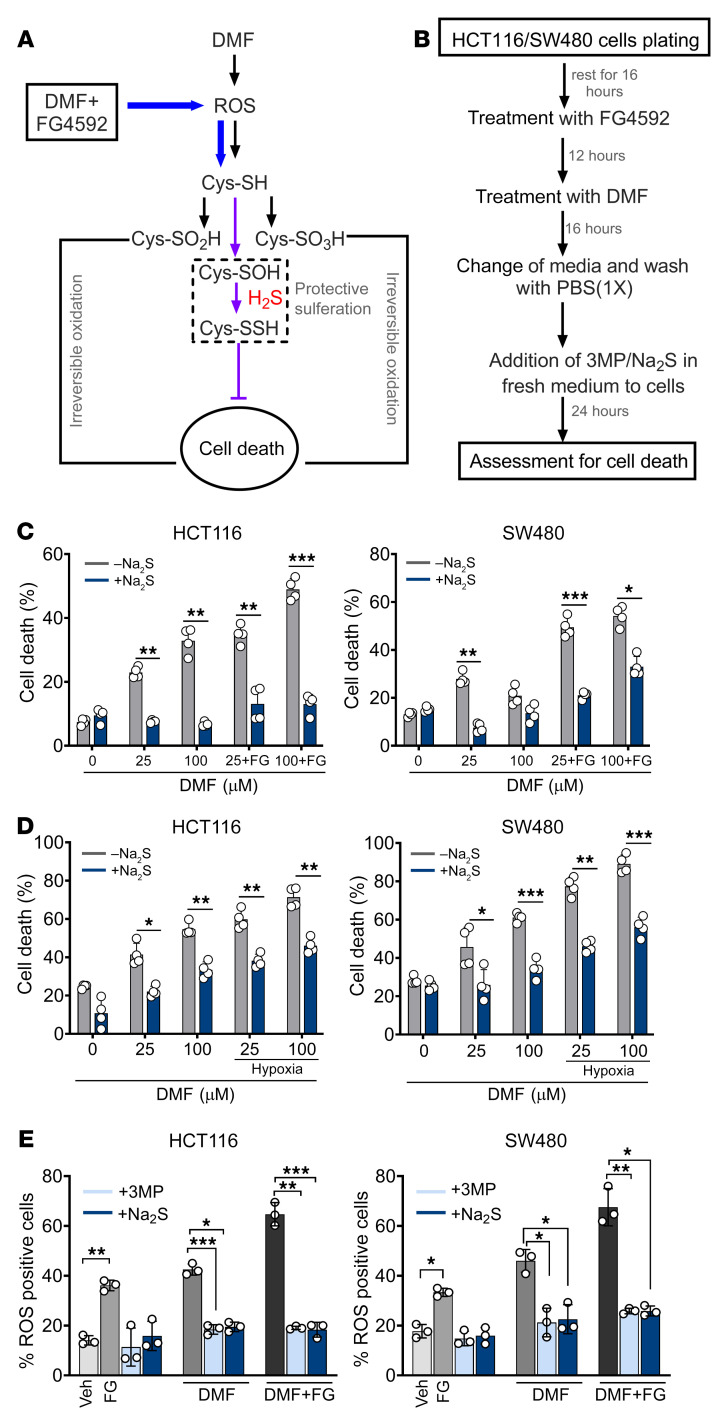
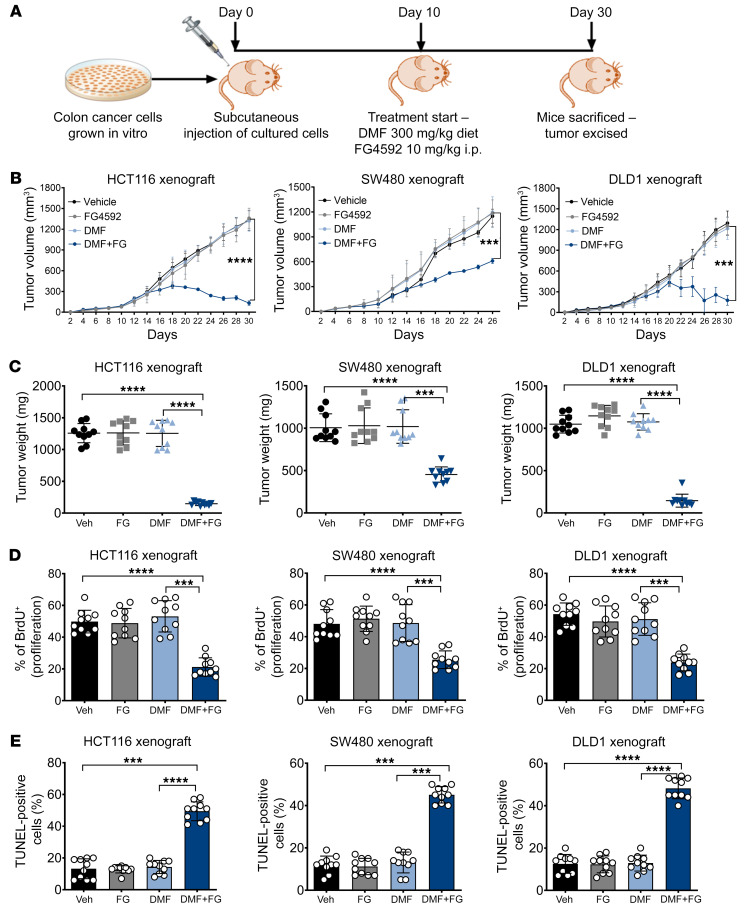
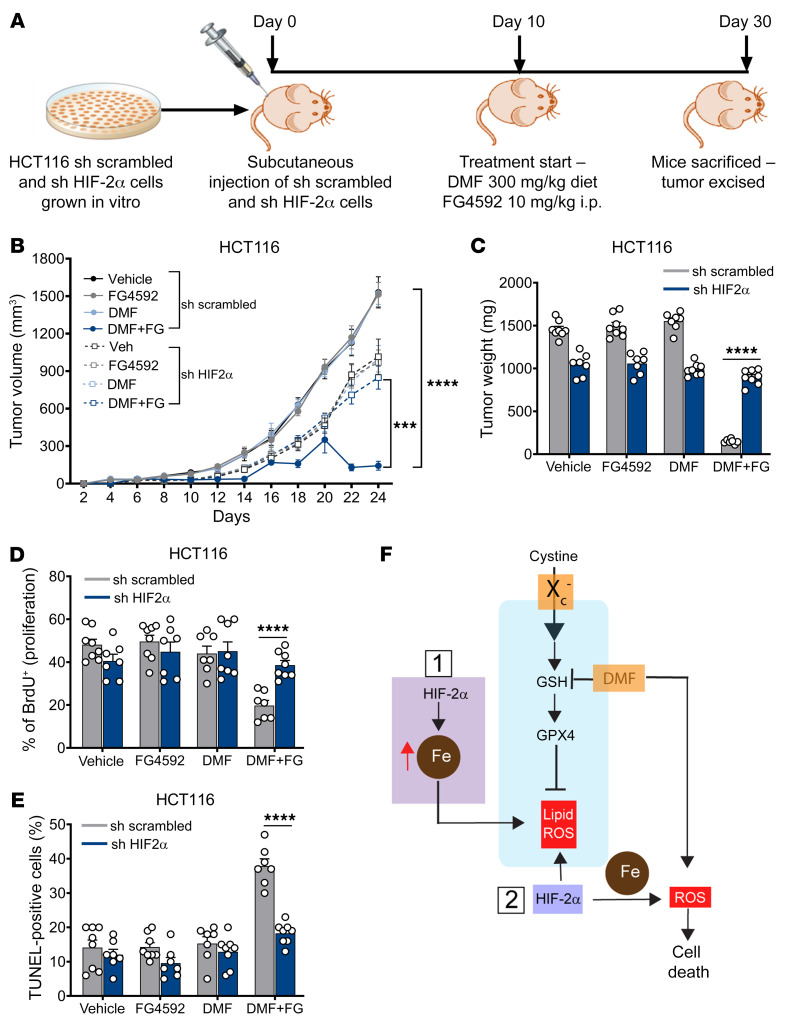
Hypoxia is a hallmark of solid tumors that promotes cell growth, survival, and metastasis and confers resistance to chemo and radiotherapies. Hypoxic responses are largely mediated by the transcription factors hypoxia-inducible factor 1α (HIF-1α) and HIF-2α. Our work demonstrates that HIF-2α is essential for colorectal cancer (CRC) progression. However, targeting hypoxic cells is difficult, and tumors rapidly acquire resistance to inhibitors of HIF-2α. To overcome this limitation, we performed a small molecule screen to identify HIF-2α-dependent vulnerabilities. Several known ferroptosis activators and dimethyl fumarate (DMF), a cell-permeable mitochondrial metabolite derivative, led to selective synthetic lethality in HIF-2α-expressing tumor enteroids. Our work demonstrated that HIF-2α integrated 2 independent forms of cell death via regulation of cellular iron and oxidation. First, activation of HIF-2α upregulated lipid and iron regulatory genes in CRC cells and colon tumors in mice and led to a ferroptosis-susceptible cell state. Second, via an iron-dependent, lipid peroxidation-independent pathway, HIF-2α activation potentiated ROS via irreversible cysteine oxidation and enhanced cell death. Inhibition or knockdown of HIF-2α decreased ROS and resistance to oxidative cell death in vitro and in vivo. Our results demonstrated a mechanistic vulnerability in cancer cells that were dependent on HIF-2α that can be leveraged for CRC treatment.

Keywords: Cancer; Cell stress; Hypoxia; Metabolism; Oncology.


Conflict of interest statement

Conflict of interest: RB is a paid member of the scientific advisory board of Apneo Therapeutics and owns equity in the company. CAL is an inventor on patents pertaining to Kras-regulated metabolic pathways, redox control pathways in pancreatic cancer, and targeting GOT1 as a therapeutic approach (Methods for diagnosing and treating oncogenic Kras-associated cancer, US patent no. 2015126580-A1; Targeting the glutamine to pyruvate pathway for treatment of oncogenic Kras-associated cancer, US patent no. 20190136238; international patent no.: WO2013177426-A2).

Figures

Figure 1
Figure 1. Screening of compounds that exhibit reduction in growth of HIF-2α–overexpressing tumor enteroids.
(A) Schematic of enteroids isolated from a sporadic CRC mouse model (Cdx2-ERT2Cre; Apcfl/fl) and CRC HIF-2α–overexpressing mouse model (Cdx2-ERT2Cre; Apcfl/flHIF2αLSL/LSL). (B and C) The log2 fold change in AUC from cell viability dose-response curves for each compound in the library, signifying the most sensitive (sensitivity rank 1) to least sensitive (sensitivity rank 35) compounds (n = 10). (D) Schematic of known oxidative cell death pathways of the 4 most significant compounds from the screen, indicating ferroptosis activators, such as erastin, RSL3, and sorafenib, that inhibit Slc7a11 or GPX4 and induce lipid peroxides. The process of lipid ROS (Li-ROS) accumulation can be inhibited by ferroptosis inhibitors, such as ferrostatins and liproxstatins, which directly eliminate lipid peroxide formation. Small molecules such as DMF are known to mediate oxidative stress and cell death by depletion of GSH.
Figure 2
Figure 2. HIF-2α activation potentiates ferroptosis in vivo.
(A) Schematic of temporal activation of intestinal HIF-2α and deletion of Slc7a11 in the colon following tamoxifen treatment (100 mg/kg). (B) Representative H&E staining and (C) immunohistochemistry analysis showing 4-HNE of colons from a Slc7a11fl/fl, Vil-ERT2Cre; Slc7a11fl/fl, Vil-ERT2Cre; HIF2αLSL/LSL, and Vil-ERT2Cre; Slc7a11fl/fl; HIF2αLSL/LSL mice. Quantitation of histology score (D and E) 4-HNE (n = 3 in each group). One-way ANOVA followed by Tukey’s multiple comparisons test was used for comparison between groups. **P < 0.01; ***P < 0.001; ****P < 0.0001. (F) Quantitative real-time PCR (qRT-PCR) analysis for HILPDA and PLIN2 in HIF-2α+/+ (n = 6) and Vil-ERT2HIF2αLSL/LSL mice (n = 6). (G) Iron levels measured in liver (n = 4) and intestinal tissue (n = 6) in HIF-2α+/+ and Vil-ERT2HIF2αLSL/LSL mice. Data are represented as mean ± SD from 3 independent experiments. P values were determined using unpaired t test. *P < 0.05; **P < 0.01; ***P < 0.001.
Figure 3
Figure 3. Hypoxia mimetic contributes to DMF-induced growth inhibition in CRC cells.
(A) Cell-growth assay following FG4592 (100 μM) and DMF cotreatment. Error bars represent mean ± SD. Statistical significance was calculated using 1-way ANOVA followed by Tukey’s multiple comparisons test. *P < 0.05; **P < 0.01; ***P < 0.001; ****P < 0.0001. (B) Representative images and (C) quantitation of colony-forming assays in HCT116 and SW480 cells treated with DMF (25 μM), or FG4592 (100 μM) or cotreated with DMF and FG4592. (D) Representative images and (E) quantitation of colony-forming assays in HCT116 and SW480 cells treated with DMF (25 μM) and cultured under normoxic and hypoxic conditions. Quantitative data are represented as mean ± SD from 3 independent experiments. Statistical significance was calculated using 1-way ANOVA with Tukey’s multiple comparisons. **P < 0.01; ***P < 0.001; ****P < 0.0001. (F) Growth assay of HIF-1α and HIF-2α knockdown HCT116 and SW480 cells treated with DMF alone or in combination with FG4592 (100 μM). Quantitative data are represented as mean ± SD from 3 independent experiments. Statistical significance was calculated using 2-way ANOVA with Tukey’s multiple comparisons. *P < 0.05; **P < 0.01; ***P < 0.001; ****P < 0.0001
Figure 4
Figure 4. DMF is not a ferroptotic inducer in CRC cells.
(A) HCT116 and SW480 cells were treated with RSL3 (1 and 5 μM) or DMF (25 and 100 μM) alone or in combination with FG4592 (100 μM) with or without ferroptotic inhibitors Fer-1 (0.5 μM) or Lip-1 (1 μM) for 24 hours, and cell death was assayed. Data are represented as mean ± SEM from 3 independent experiments. Statistical significance was calculated using 2-way ANOVA with Tukey’s multiple comparison test. *P < 0.05; **P < 0.01; ***P < 0.001. (B) HCT116 and SW480 cells were treated with RSL3 (2 μM), DMF (50 μM), or in combination with FG4592 (100 μM) with or without Fer-1 (1 μM) for 12 hours. Lipid ROS was determined in these cells through staining with ferroptosis-dependent C11-BODIPY581/591. Data are plotted as the mean ± SD. P values were determined using 1-way ANOVA with Tukey’s multiple comparison. *P < 0.05; **P < 0.01; ****P < 0.0001. (C) Schematic of glycolysis pathway in cells showing DMF, CGP 3466B as inhibitors of GAPDH, and 2-DG as inhibitor of hexokinase. (D) Heatmap showing the relative abundance of glycolytic intermediates in HCT116 and SW480 cells treated with FG4592 (100 μM) or DMF (50 μM) either alone or in combination. (E) HCT116 and SW480 cells were treated with glycolysis inhibitors with or without FG4592, and cell death was assessed using LDH assay.
Figure 5
Figure 5. ROS generation and iron accumulation are involved in DMF and FG4592–mediated cell death in CRC cells.
Cell death assay in HCT116 and SW480 cells treated with DMF (25 and 75 μM) (A) cotreated with DMF and FG4592 (100 μM) (B) cultured under hypoxia with or without NAC (5 mM). Data are represented as mean ± SD from 3 independent experiments. Statistical significance was calculated using unpaired t test. *P < 0.05; **P < 0.01; ***P < 0.001; ****P < 0.0001. ROS measurements in HCT116 and SW480 cells (C) treated with FG4592 (100 μM), DMF (50 μM), or DMF and FG4592 with or without NAC. (D) Cells treated with DMF and cultured in normoxia and hypoxia with or without NAC. Data are plotted as the mean ± SEM from 3 independent experiments. Statistical significance was calculated using 1-way ANOVA with Tukey’s multiple comparison test. *P < 0.05; **P < 0.01; ***P < 0.001; ****P < 0.0001. (E) ROS measurements in shRNA-mediated HIF-1α, HIF-2α knockdown, and non–target scrambled HCT116 and SW480 cells treated with DMF (50 μM) either alone or in combination with FG4592 (100 μM). Statistical significance was calculated using 2-way ANOVA with Tukey’s multiple comparison. *P < 0.05; **P < 0.01; ***P < 0.001; ****P < 0.0001. (F) Heatmap showing the relative abundance of mitochondrial metabolites in FG4592-treated (100 μM) and DMF-treated (50 μM) HCT116 and SW480 cells. (G) Cell death and (H) ROS measurements using FG4592 (100 μM) and DMF (75 μM) either alone or under cotreated conditions in the presence of normal iron (control) and low iron. Statistical significance was calculated using unpaired t test. **P < 0.01; ***P < 0.001; ****P < 0.0001.
Figure 6
Figure 6. H2S can prevent irreversible protein oxidation and rescue cell death mediated by DMF and FG4592.
(A) Schematic showing H2S effects on DMF-mediated cell death. The addition of sulphur group to proteins prevents the cell death mediated by DMF. (B) Schematic showing treatment regime of HCT116 and SW480 cells with DMF, FG4592, 3MP, and Na2S. (C and D) Cell death in HCT116 and SW480 cells treated with DMF (25 and 100 μM) (C) or cotreated with DMF and FG4592 (100 μM) (D) cultured under normoxic and hypoxic conditions with or without Na2S (300 μM). Data are represented as mean ± SD from 3 independent experiments. Statistical significance was calculated using unpaired t test. *P < 0.05; **P < 0.01; ***P < 0.001. (E) ROS measurements in HCT116 and SW480 cells treated with DMF (50 μM) or DMF in combination with FG4592 (100 μM) either alone or in addition with 3MP (5 mM) and Na2S (300 μM) for 16 hours. Data are represented as mean ± SD from 3 independent experiments. Statistical significance was calculated using 2-way ANOVA with Tukey’s multiple comparison. *P < 0.05; **P < 0.01; ***P < 0.001.
Figure 7
Figure 7. DMF and FG4592 potentiate CRC cell death in vivo.
(A) Schematic of xenografts in vivo study. HCT116, SW480, and DLD1 cells were injected subcutaneously into both flanks of C57BL/6 mice (n = 10 for each group). After visible formation of tumor at day 10, the mice were subjected to DMF diet (300 mg/kg of chow) and FG4592 (10 mg/kg of mouse weight). (B) Tumor volume, (C) tumor weight, (D) tumor proliferation, and (E) tumor apoptosis in HCT116, SW480, and DLD1 xenograft mice. Data are represented as mean ± SEM. *P < 0.05; **P < 0.01; ***P < 0.001; ****P < 0.0001 (differences between untreated mice and between treated groups). One-way ANOVA with Tukey’s multiple comparison test was used for calculating statistical significance.
Figure 8
Figure 8. DMF-mediated CRC cell death in vivo is HIF-2α dependent.
(A) Schematic of HIF-2α knockdown xenograft in vivo study. shRNA-mediated HIF-2α knockdown and non–target scrambled HCT116 cells were injected subcutaneously into both flanks of C57BL/6 mice (n = 8 for each group). After visible formation of tumor at day 10, the mice were subjected to the DMF diet (300 mg/kg of chow) and FG4592 (10 mg/kg of mouse body weight). (B) Tumor volume, (C) tumor weight, (D) tumor proliferation, and (E) tumor apoptosis in HIF-2α knockdown and non–target scrambled HCT116 xenograft mice. Data are represented as mean ± SEM. ***P < 0.001; ****P < 0.0001 (differences between scrambled and HIF-2α knockdown cells for DMF+FG treatment). Unpaired t test was used for calculating statistical significance. (F) Schematic outlining the role of HIF-2α mediating vulnerability to oxidative cell death. HIF-2α mediated iron toxicity and accumulation of lipid ROS, which synergized with ferroptotic activators to enhance CRC cell death. HIF-2α also increased cellular iron and synergize with cellular oxidants such as DMF to enhance irreversible cysteine oxidation and cell death.

References

    1. Bhandari A, et al. Colorectal cancer is a leading cause of cancer incidence and mortality among adults younger than 50 years in the USA: a SEER-based analysis with comparison to other young-onset cancers. J Investig Med. 2017;65(2):311–315. doi: 10.1136/jim-2016-000229. - DOI - PMC - PubMed
    1. Rawla P, et al. Epidemiology of colorectal cancer: incidence, mortality, survival, and risk factors. Prz Gastroenterol. 2019;14(2):89–103. - PMC - PubMed
    1. Yu S, et al. Hypoxia promotes colorectal cancer cell migration and invasion in a SIRT1-dependent manner. Cancer Cell Int. 2019;19:116. - PMC - PubMed
    1. Krock BL, et al. Hypoxia-induced angiogenesis: good and evil. Genes Cancer. 2011;2(12):1117–1133. doi: 10.1177/1947601911423654. - DOI - PMC - PubMed
    1. Semenza GL. Hypoxia-inducible factors: mediators of cancer progression and targets for cancer therapy. Trends Pharmacol Sci. 2012;33(4):207–214. doi: 10.1016/j.tips.2012.01.005. - DOI - PMC - PubMed

Publication types

MeSH terms

Substances