. 2021 Jun 3;28(6):1105-1124.e19.
doi: 10.1016/j.stem.2021.03.005. Epub 2021 Apr 28.

Modeling plasticity and dysplasia of pancreatic ductal organoids derived from human pluripotent stem cells

Affiliations

Modeling plasticity and dysplasia of pancreatic ductal organoids derived from human pluripotent stem cells

Markus Breunig et al. Cell Stem Cell. .

Abstract

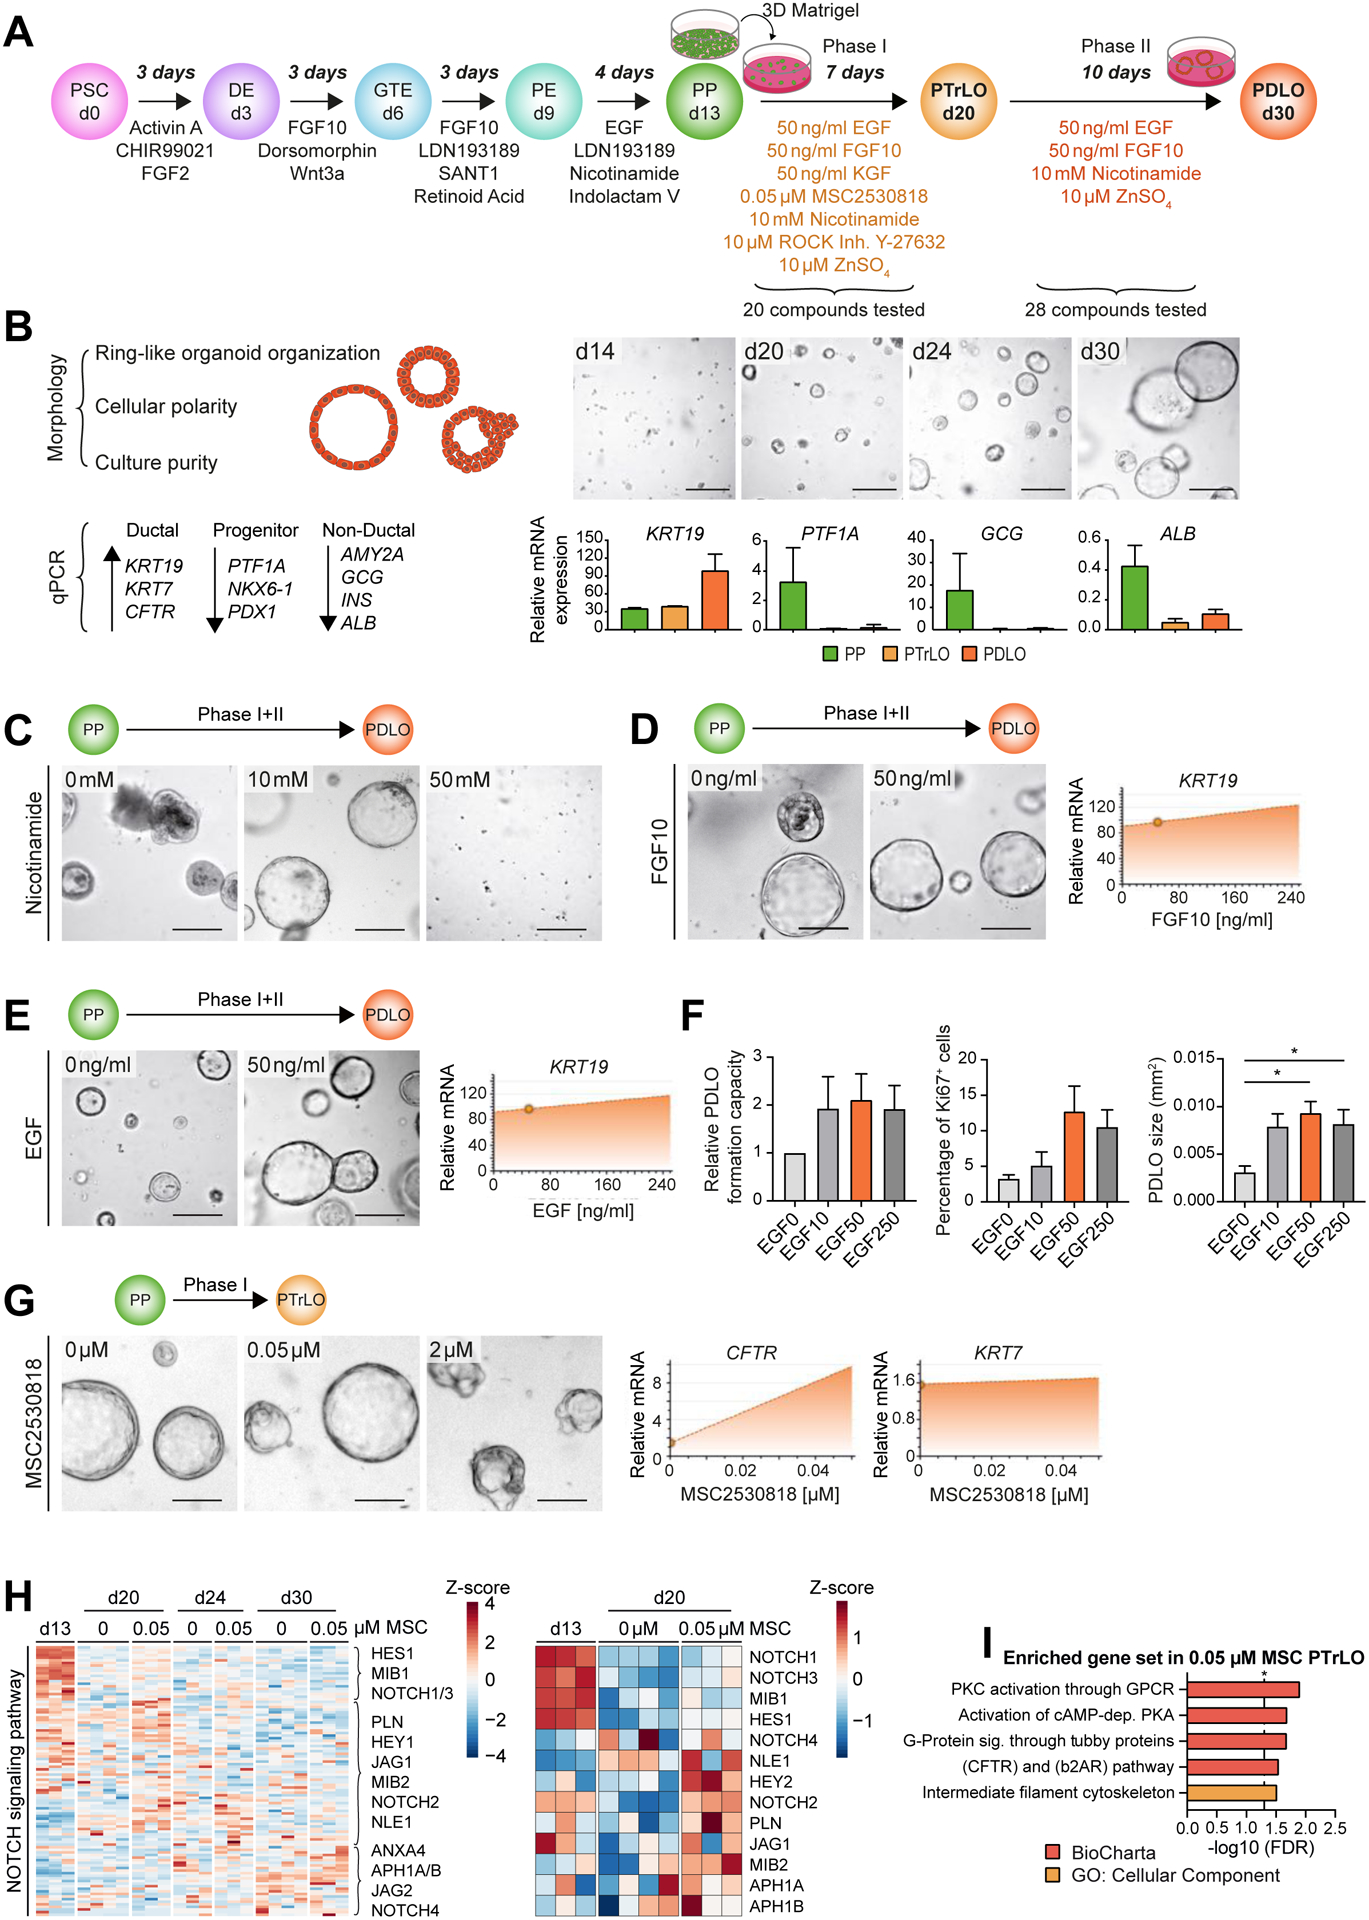
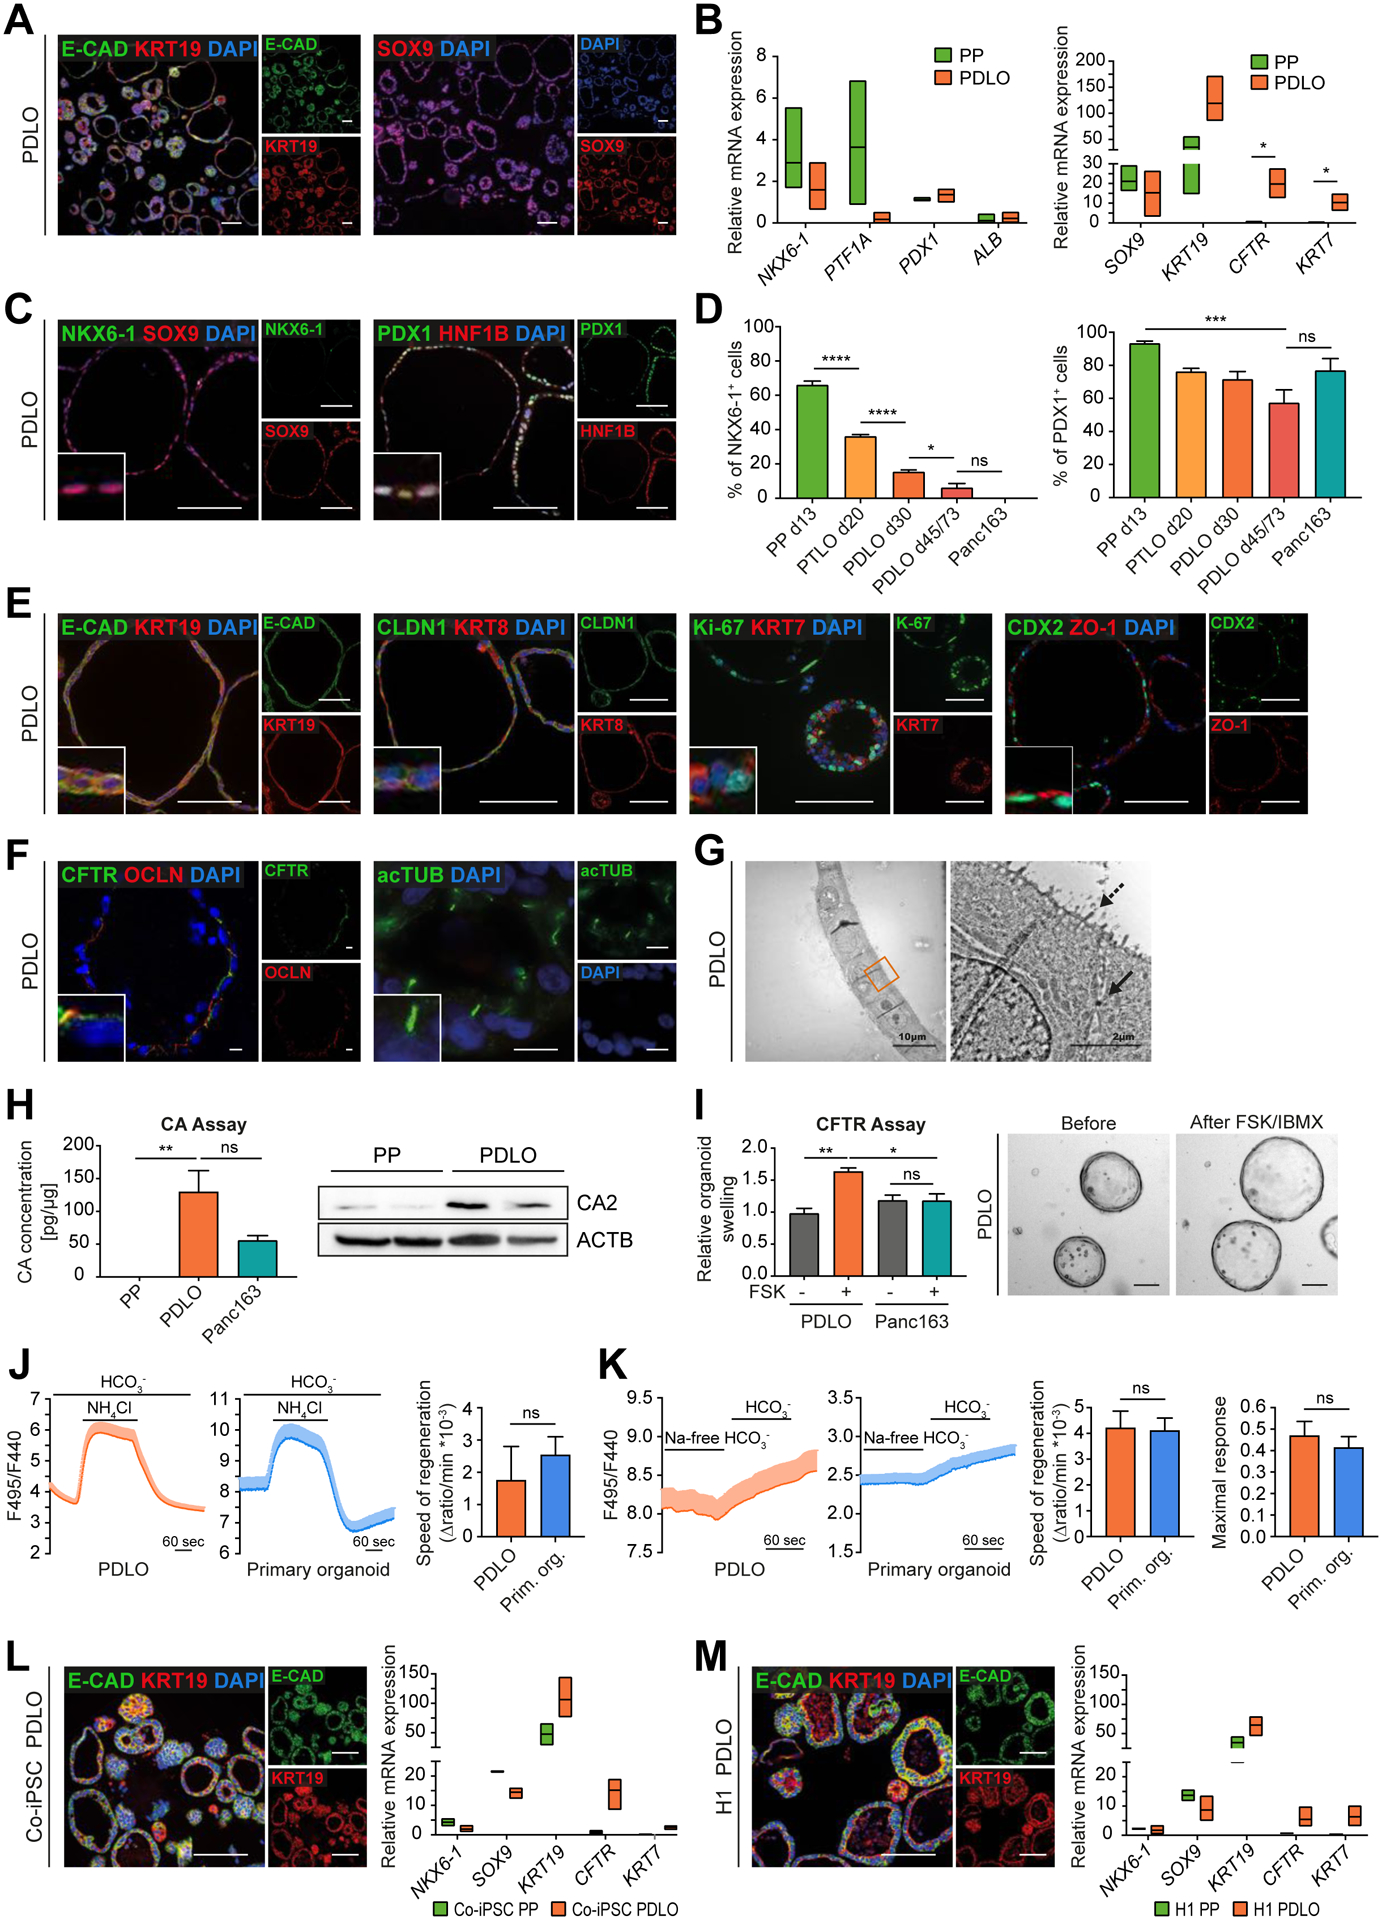
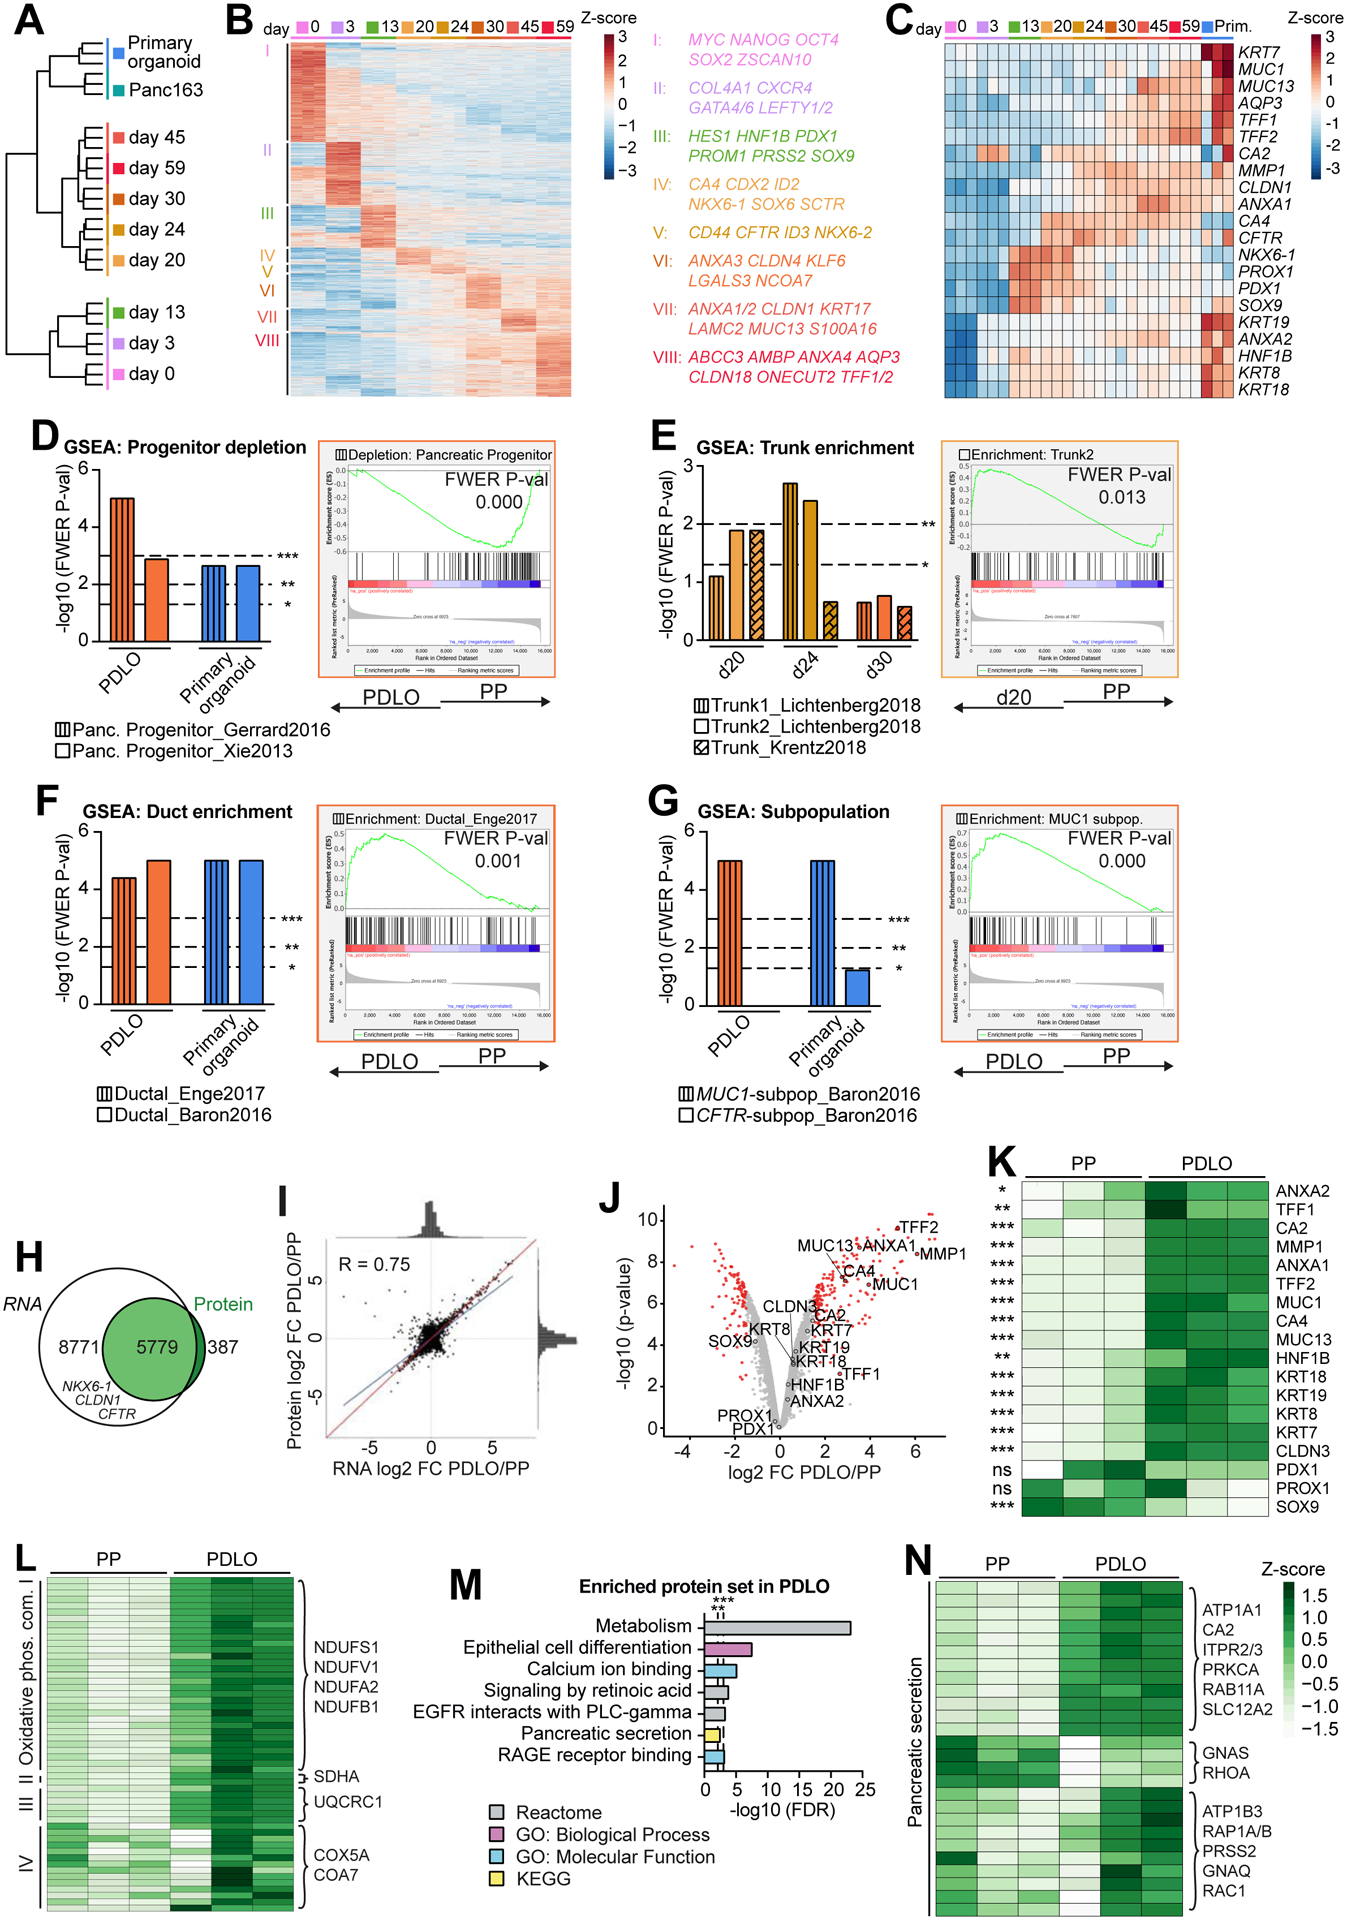
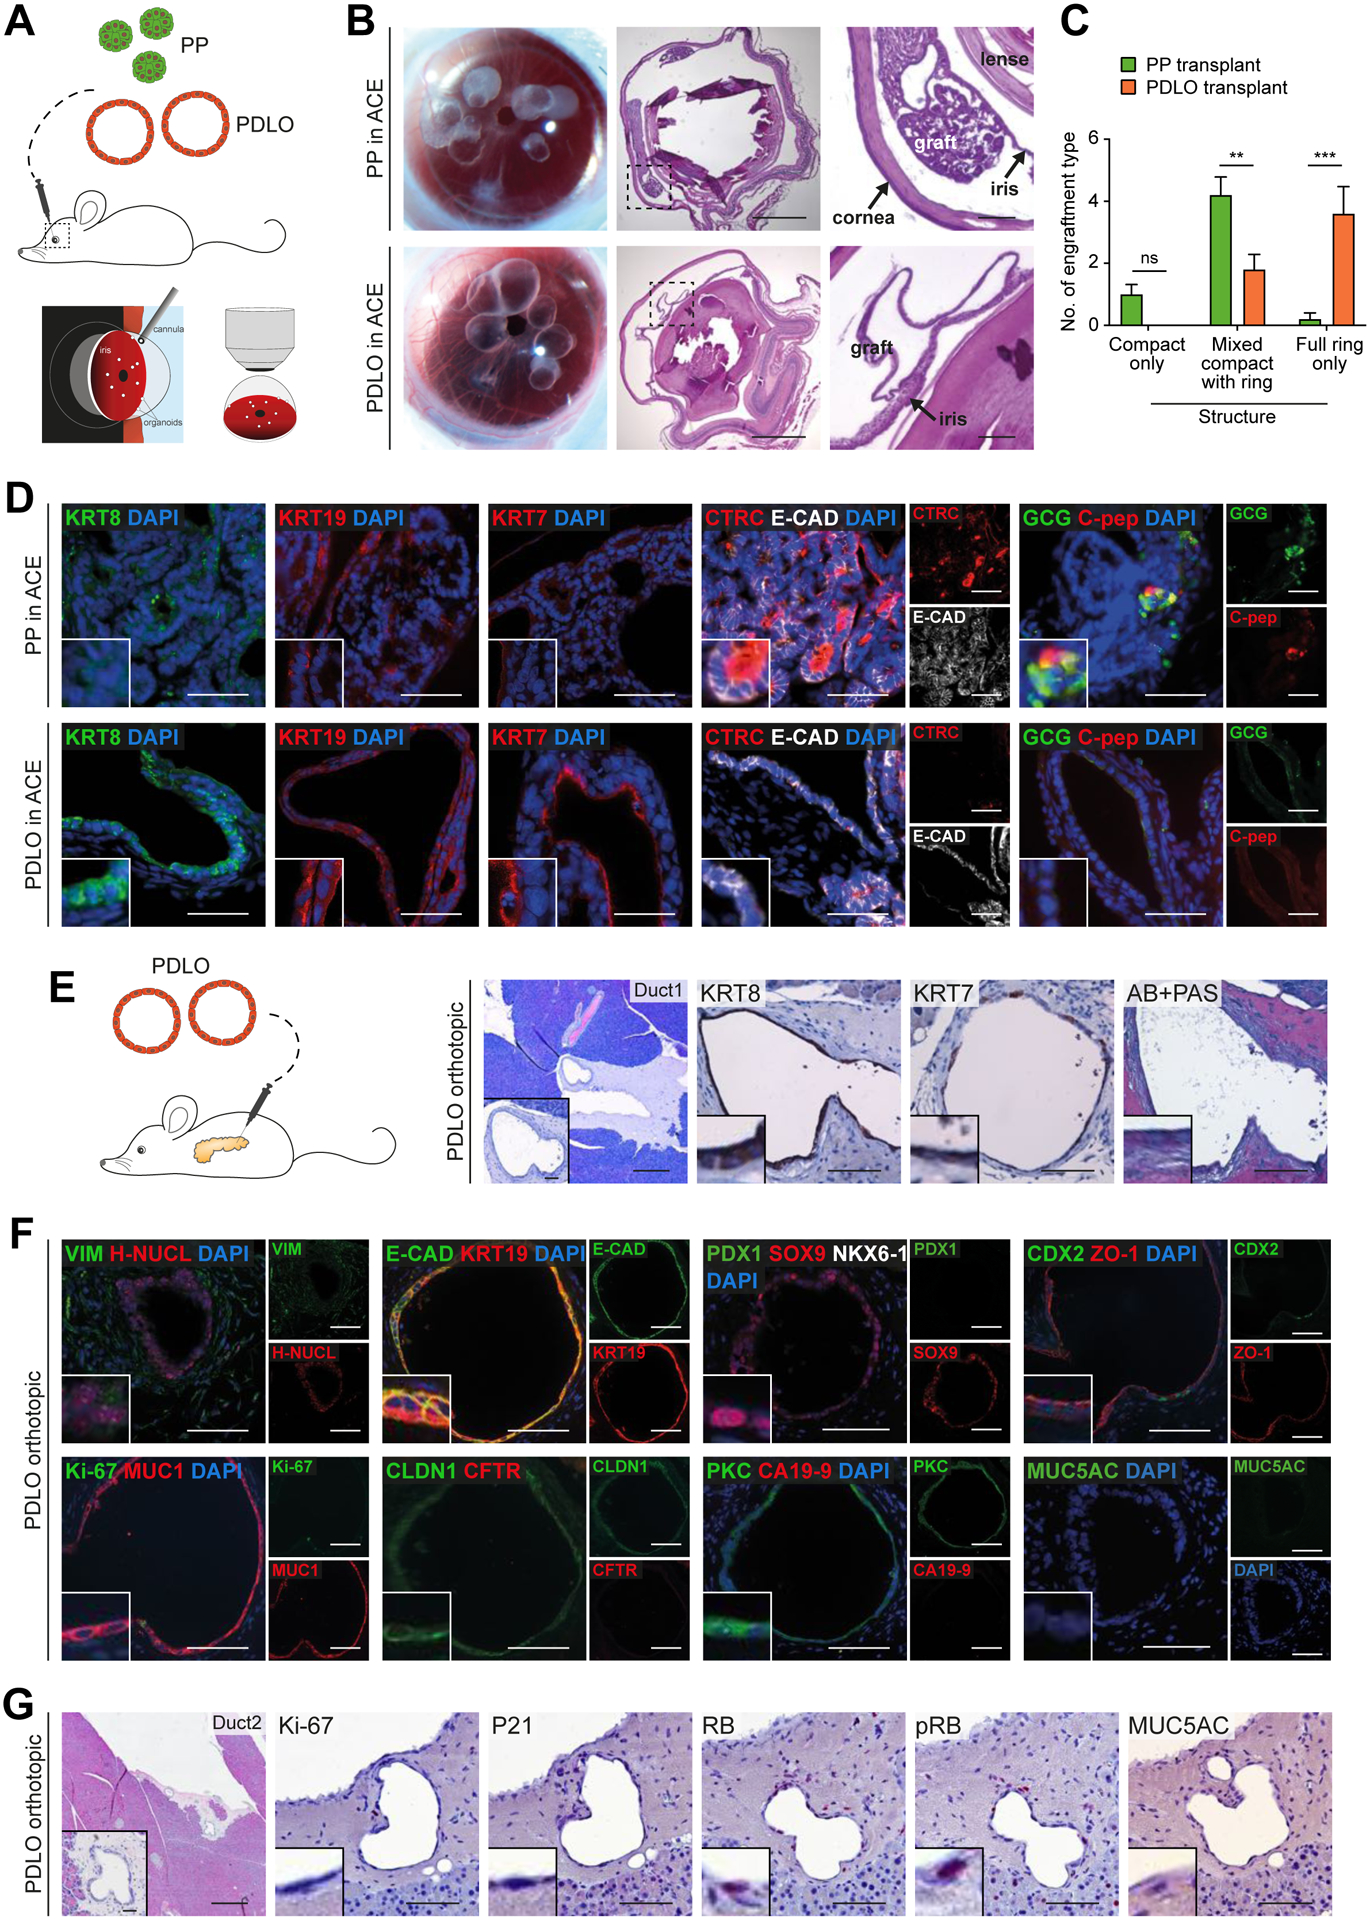
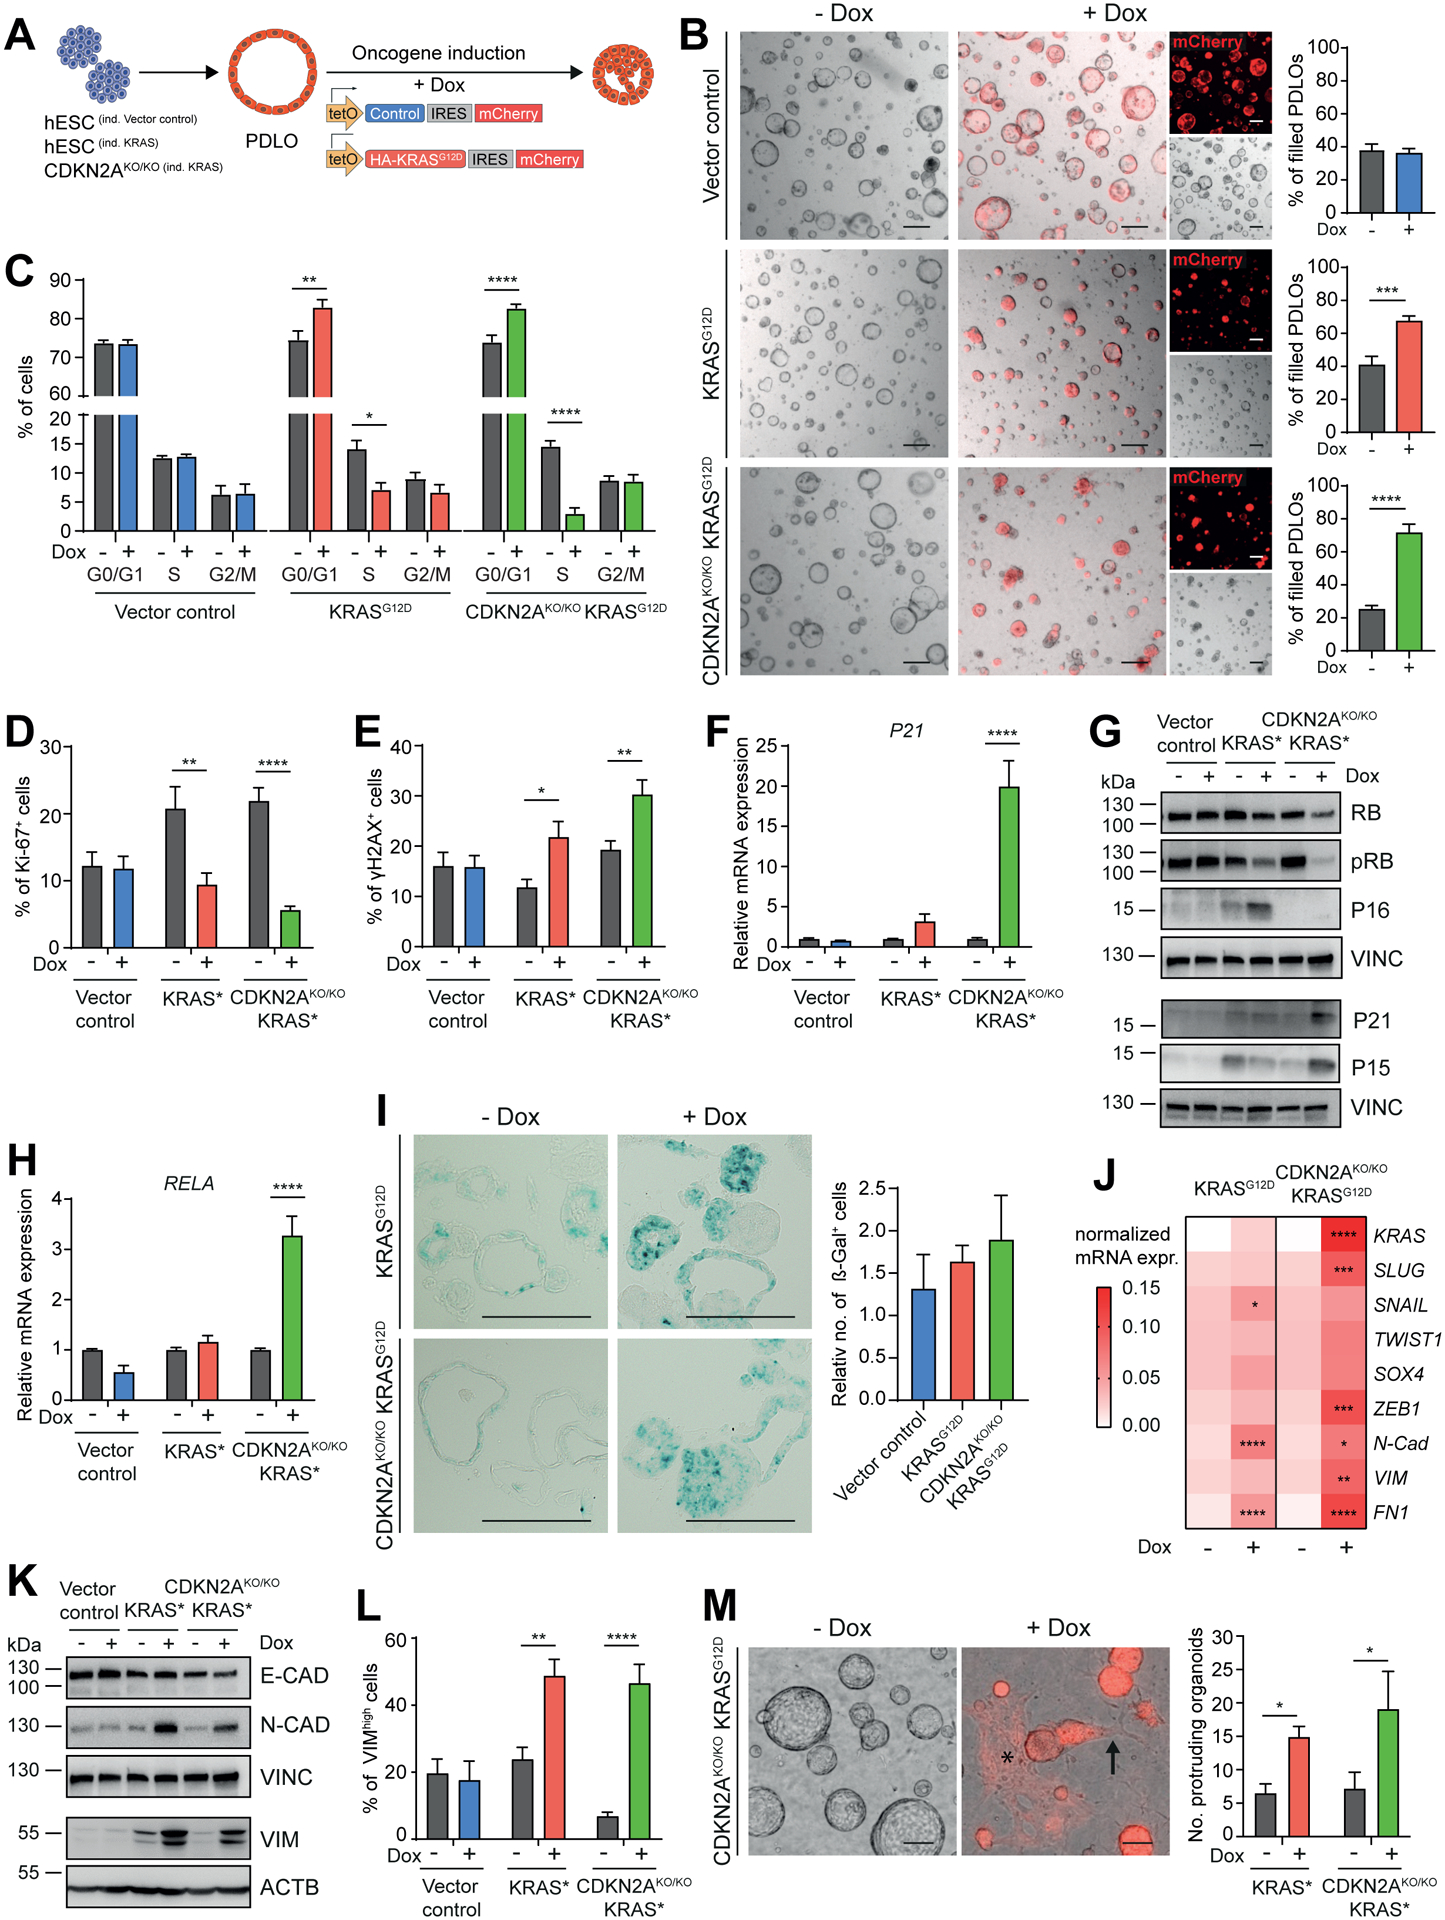
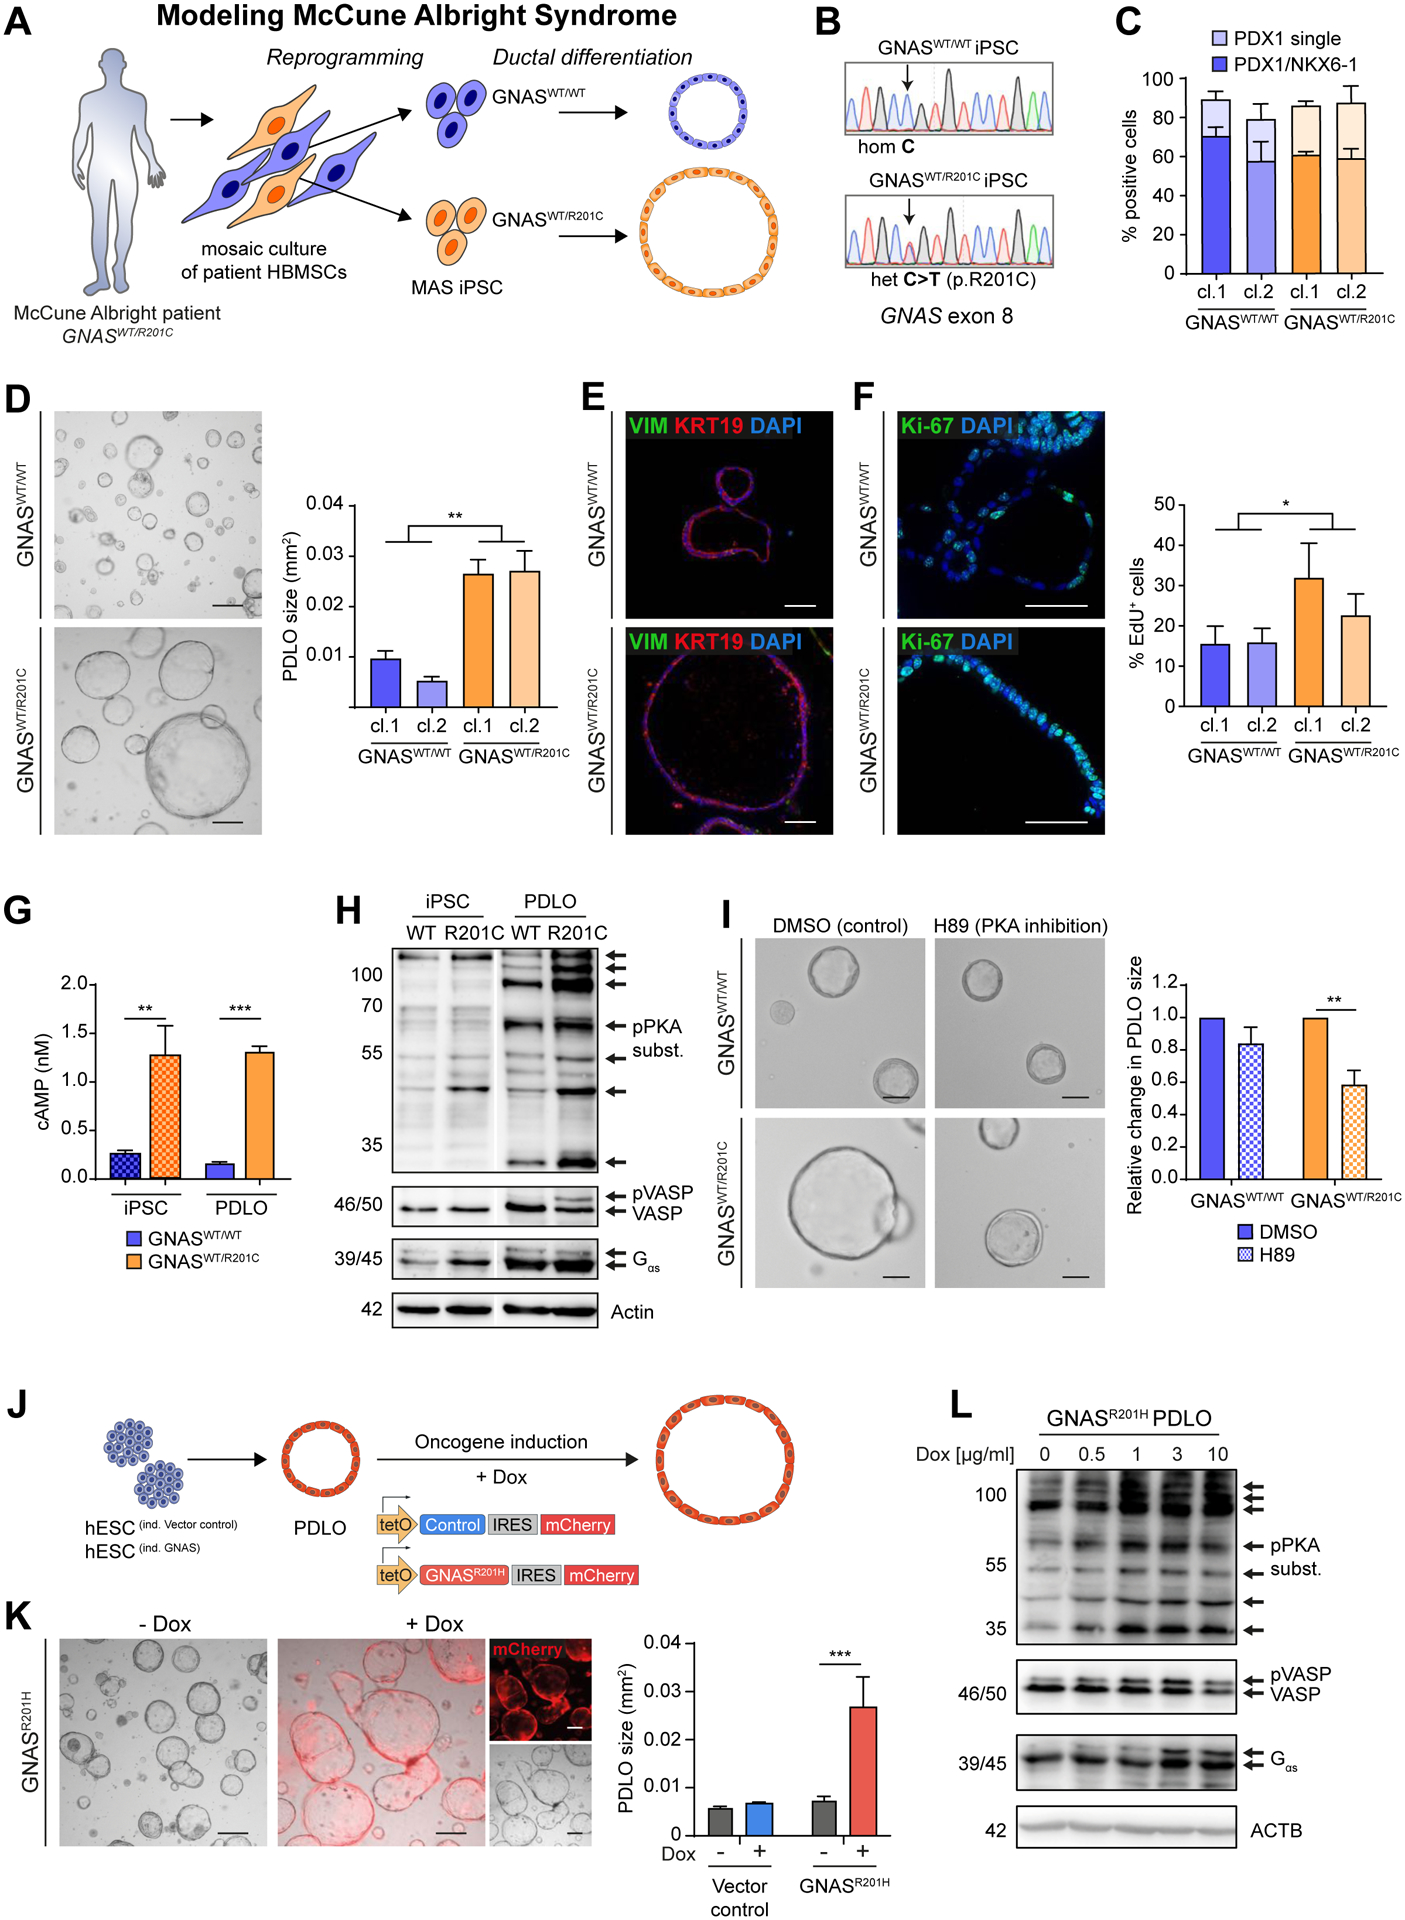
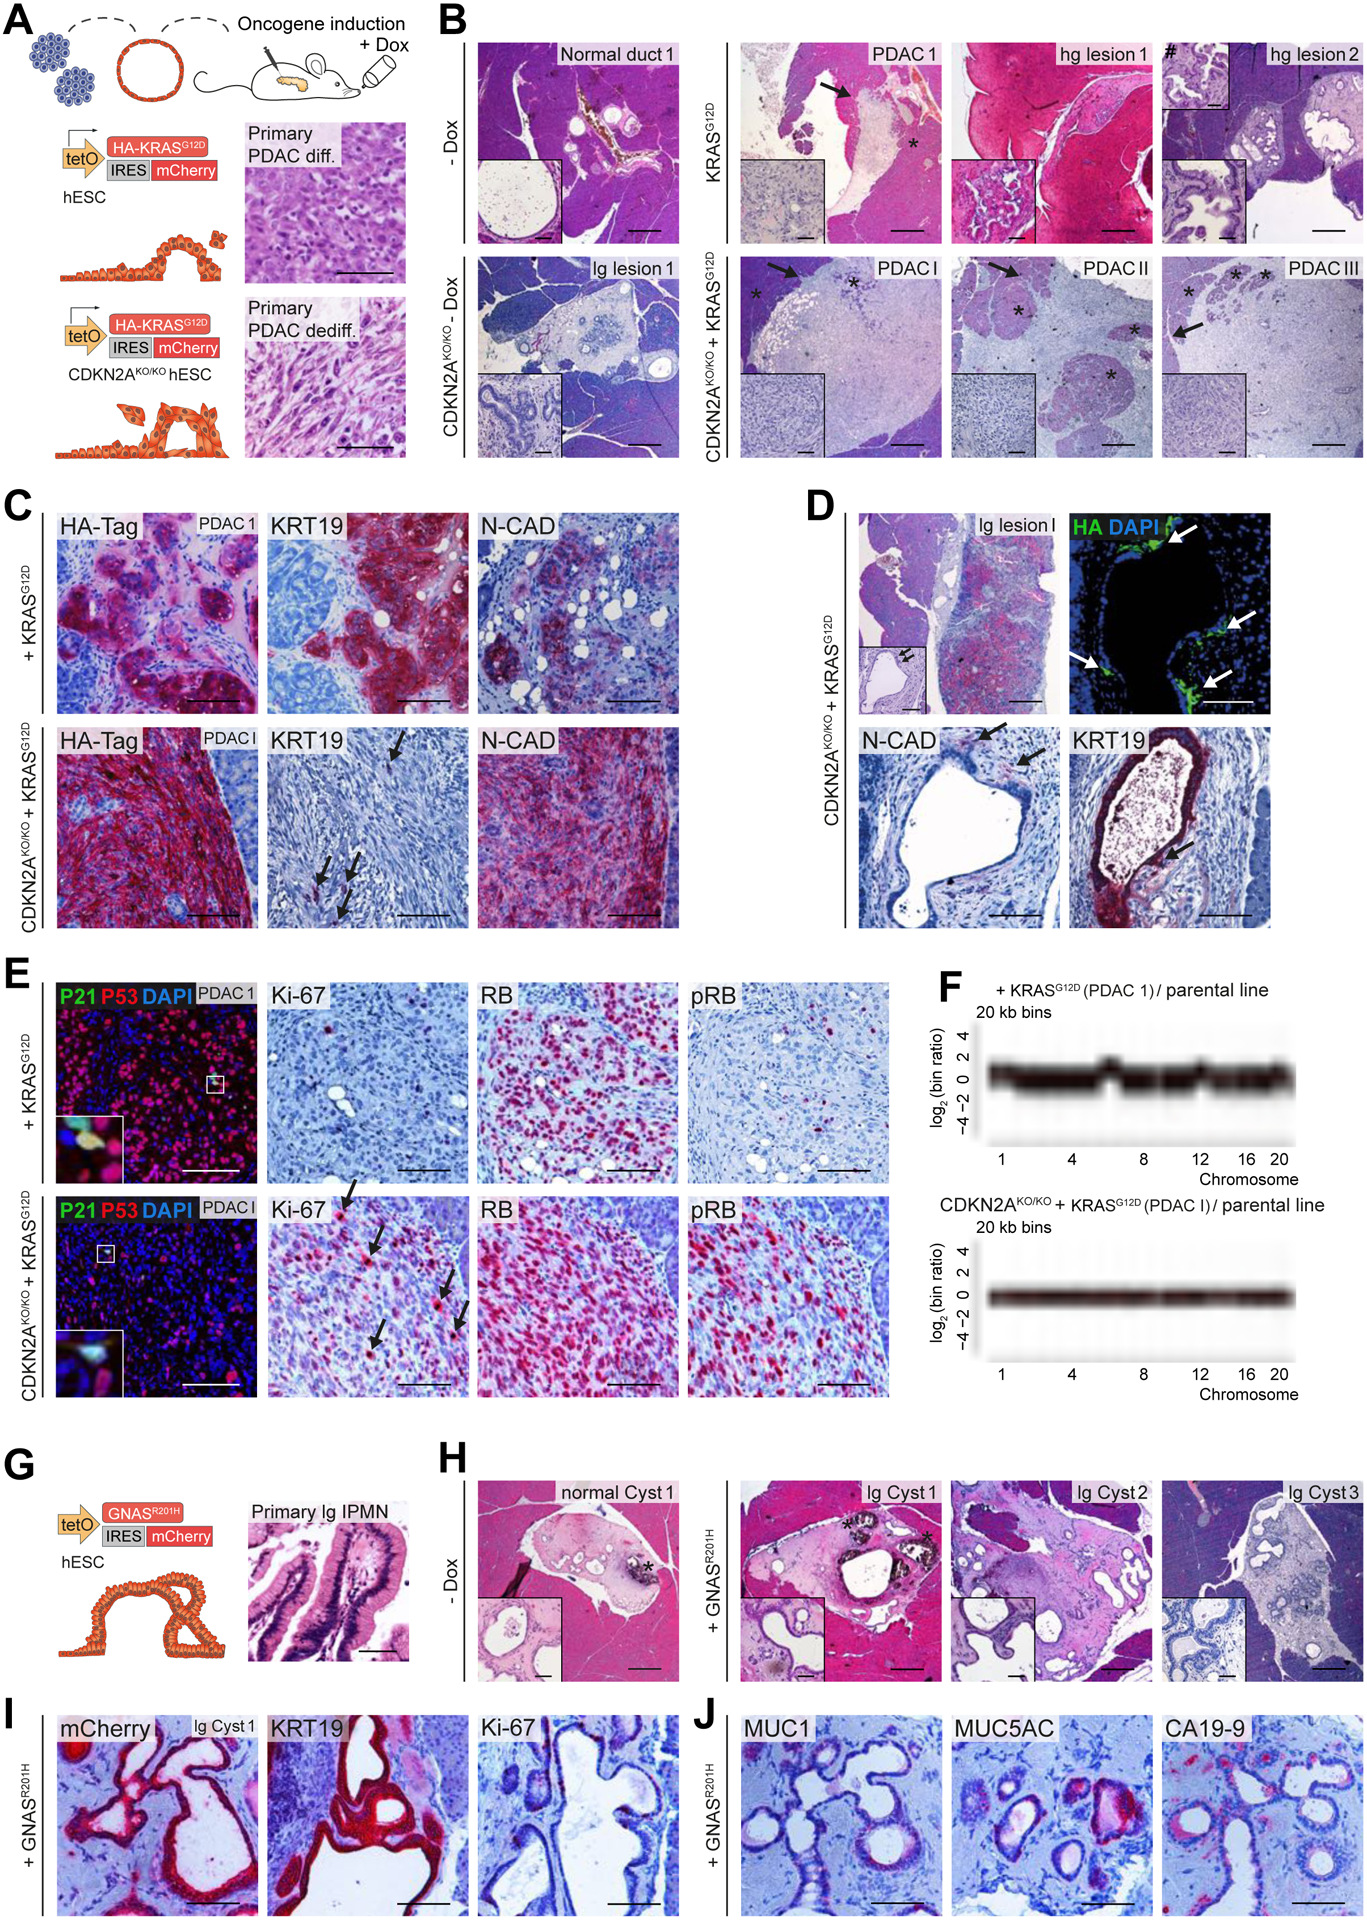
Personalized in vitro models for dysplasia and carcinogenesis in the pancreas have been constrained by insufficient differentiation of human pluripotent stem cells (hPSCs) into the exocrine pancreatic lineage. Here, we differentiate hPSCs into pancreatic duct-like organoids (PDLOs) with morphological, transcriptional, proteomic, and functional characteristics of human pancreatic ducts, further maturing upon transplantation into mice. PDLOs are generated from hPSCs inducibly expressing oncogenic GNAS, KRAS, or KRAS with genetic covariance of lost CDKN2A and from induced hPSCs derived from a McCune-Albright patient. Each oncogene causes a specific growth, structural, and molecular phenotype in vitro. While transplanted PDLOs with oncogenic KRAS alone form heterogenous dysplastic lesions or cancer, KRAS with CDKN2A loss develop dedifferentiated pancreatic ductal adenocarcinomas. In contrast, transplanted PDLOs with mutant GNAS lead to intraductal papillary mucinous neoplasia-like structures. Conclusively, PDLOs enable in vitro and in vivo studies of pancreatic plasticity, dysplasia, and cancer formation from a genetically defined background.

Keywords: CDKN2A; GNAS; IPMN; KRAS; PDAC; disease modelling; ductal pancreatic organoids; human pluripotent stem cells; in vitro differentiation; xenograft.


Conflict of interest statement

Declaration of interests The authors declare no competing interests.

Figures

Figure 1.
Figure 1.. Engineering pancreatic duct-like organoids (PDLOs) from human pluripotent stem cells
(A) Schematic overview of the 2-phase screening approach. Definitive endoderm (DE); gut tube endoderm (GTE); pancreatic endoderm (PE); pancreatic trunk-like organoid (PTrLO). (B) Left: Morphological criteria and marker for evaluation of duct formation. Right: Bright field (BF) images and marker profiles obtained from PP, PTrLOs, and PDLOs during differentiation; day (d). (C-E,G) BF images and dynamic marker profiles of PDLOs/PTrLOs. Compounds and screening phase as indicated. Dynamic marker profiles were interpolated from qPCR data using MODDE software and small circles indicate the applied concentration of the protocol version at the timepoint of testing. (C) Nicotinamide, (D) FGF10, (E) EGF, and (G) MSC2530818 titration. (F) Titration of EGF concentration in PDLO medium (0–250 ng/ml) and its effect on organoid growth characteristics (Mean±SEM; n=3; in duplicates, ordinary one-way Anova followed by Tukey’s multiple comparison test). (H,I) RNA-seq analysis of PPs, PTrLOs, and PDLOs with or without 0.05 μM MSC2530818 during phase I (0.00 μM: n=4, 0.05 μM: n=3). (H) Left: Plotting all identified genes from the GO term “NOTCH signaling pathway” (GO:0007219) over time. Right: Selection of genes at PP and PTrLO stage. (I) RNA-seq overrepresentation analysis of PTrLOs (d20) with 0.05 μM MSC2530818 treatment against PTrLOs (d20) without MSC. Scale bars: 100 μm. PDLO cultures were analyzed at day 30, if not stated elsewise. C,D,E, and G show data from one representative experiment in duplicates.
Figure 2.
Figure 2.. PDLOs recapitulate cell type-specific features
(A) Representative overview IF images of HUES8-derived PDLOs. (B) Downregulation of PP and upregulation of ductal markers in PDLOs in qPCR experiments (PTF1A, PDX1, KRT7, CFTR: n=3; NKX6-1, ALB, SOX9, KRT19: n=6; in duplicates). (C) Representative IF images of individual PDLOs. (D) Time-resolved downregulation of PP markers measured by flow cytometry (FC) in comparison with patient-derived human PDAC organoids (Panc163) (n=4; d45/73: n=3; Panc163: n=2; in duplicates). (E) IF images of PDLOs stained for ductal, epithelial, proliferation, and polarity markers. (F) IF staining for CFTR, tight junction protein Occludin (OCLN), and primary cilia (acTUB, acetylated Tubulin). Scale bar: 10 μm. (G) Transmission electron microscopy images of a PDLO. Arrow marks a desmosome, dashed arrow microvilli. (H) Carbonic anhydrase (CA) activity assay (n=3; in duplicates, 3 blinded measurements for each replicate). Right: Higher CA2 level in PDLOs than in PPs on Western blot (WB) (n=2; in duplicates). (I) PDLO swelling within the CFTR assay upon stimulation with 20 μM forskolin (FSK) and 100 μM IBMX for 18 h (n=3; in duplicates). Right: BF images of PDLOs (d44/45). (J,K) Confirmation of the functional similarity in ion secretion of PDLOs and adult primary tissue-derived ductal organoids by intracellular pH measurement. (J) Apical Cl/HCO3 exchange activity (PDLOs: n=28; Primary organoids: n=12) (Maléth et al., 2015) and (K) basolateral Na+ dependent HCO3 uptake (PDLOs: n=15; Primary organoids: n=13; n=number of organoids) (Molnár et al., 2020) were estimated (Mean±SEM; analysis of variance/Mann-Whitney test). (L,M) IF images of KRT19 and E-CAD in PDLOs derived from Co-iPSCs or H1 together with progenitor and ductal mRNA marker expression (n=3; in duplicates). Scale bars: 100 μm, if not stated elsewise. Insets in the corners are 4x enlarged. PDLOs represent day 30 of the protocol. B,L,M: Floating bars spanning minimal and maximal values; multiple t-tests via the Holm-Sidak method; only significant comparisons are depicted. D,H,I: Mean±SEM; ordinary one-way Anova followed by Tukey’s multiple comparison test.
Figure 3.
Figure 3.. Global transcriptomic and proteomic analyses confirm ductal identity
(A) Global RNA-seq data during PDLO differentiation and of patient-derived human ductal organoids (n=3). Ward clustering was performed with all processed genes. (B) Heatmap of stage-specific significant genes. (C) Temporally resolved heatmap of key progenitor and ductal genes. (D-G) Gene Set Enrichment Analysis (GSEA) of d20, d24, PDLOs (d30), and primary ductal organoids against PPs (d13) for distinct reference gene sets. Exemplary GSEA plots are highlighted in respective sample colors. (H) Venn diagram representing the overlap of transcripts measured by RNA-seq with proteins detected by mass spectrometry (n=3). (I) Pearson correlation of RNA-seq and proteome log2FC of PDLOs (d59) versus PPs (d13). The blue line indicates actual correlation, the red line ideal correlation of all 5779 shared genes/proteins. (J) Volcano plot of protein mass spectrometry data of PDLOs and PPs. Differentially regulated proteins in red (P-value ≤ 0.01 and FC ≥ |1.5|). (K) Heatmap of key progenitor and ductal proteins in PPs and PDLOs. (L,N) Heatmap illustration of proteins (L) from the four “Oxidative phosphorylation” complexes and (N) the KEGG term “Pancreatic Secretion”. (M) Enriched protein sets in PDLOs over PPs.
Figure 4.
Figure 4.. Development of human duct-like tissue after xenotransplantation of PDLOs
(A) Scheme of transplantation into the anterior chamber of the mouse eye (ACE). (B) Growth of grafted organoids on the iris 5 weeks after transplantation. Left panel: Image of eyes transplanted with PPs or PDLOs. Right panels: HE staining of sagittal section of explanted eyes with PDLO graft on the iris. (C) Quantification of observed engraftment types (Mean±SEM; n=5 mice per group; ordinary two-way Anova with Sidak’s multiple comparison test)(D) IF staining of PP-derived grafts revealed acinar, ductal, and endocrine cells in the ACE, while marker expression of PDLO-derived grafts was restricted to the ductal pancreatic lineage (CTRC, Chymotrypsin C; C-pep, C-peptide). (E) Orthotopic transplantation scheme and HE/IHC images demonstrating engraftment site 8 weeks after transplantation (n=5 mice). (F) PDLO transplants expressed ductal epithelium-specific proteins, MUC1, E-CAD, KRT19, and CLDN1, lost transcription factors, PDX1 and CDX2, but lacked CFTR and CA19-9 expression. (G) WT PDLO transplant stained for proliferation- and cell cycle-related proteins and the dysplastic marker MUC5AC (RB, retinoblastoma protein; pRB, phosphorylated RB). B,E-G: Scale bars: 100 μm. Insets in the corners are 4x enlarged. Except in overview staining: 500 μm, here insets: 50 μm. D: Scale bar: 50 μm, insets are 2x enlarged.
Figure 5.
Figure 5.. KRASG12D expression induces lumen-filling and EMT in PDLOs
(A) Timed induction of a piggyBac KRASG12D transposon construct in engineered HUES8. (B) BF PDLO images after induction of the vector control in CDKN2AWT/WT cells, or the KRASG12D expression cassette in CDKN2AWT/WT and CDKN2AKO/KO cells. Formation of lumen-filled PDLOs was quantified (n=3; in triplicates). Scale bar: 200 μm. (C) Cell cycle analysis in PDLOs −/+ Dox (n=3; in duplicates). (D,E) FC quantification of proliferation marker Ki-67 and DNA-damage marker γH2AX (n=3; in duplicates). (F) qPCR analysis of P21 (n=3; in duplicates). (G) Genotype-dependent differential regulation of cell cycle regulators and checkpoint proteins. See Suppl.Fig. 5I,J for respective quantification of WB analysis. (H) qPCR analysis of senescence marker RELA (n=3; in duplicates). (I) Histological sections of PDLOs stained for senescence-associated β-galactosidase activity (dark cyan color) and respective quantification (vector control, CDKN2AKO/KO KRASG12D n=3; KRASG12D n=5). (J) Marker panel revealing increased EMT on mRNA level (n=3; in duplicates). (K) Regulation of EMT-related proteins after oncogene induction. See Suppl.Fig. 5O for respective quantification. (L) FC analysis of PDLO cells with high VIM expression (vector control, CDKN2AKO/KO KRASG12D n=4; KRASG12D n=3; in duplicates). (M) BF PDLO images reveal how cells adopt morphological features of EMT in response to KRAS activation. Arrow: single cells disseminating from a PDLO, asterisk: area of mesenchymal-like cells (red, mCherry). Right: Phenotype quantification (n=4; in duplicates). Refer to Suppl.Video S1,2 for respective live-cell imaging. All data were acquired in PDLOs at day 38, 9 days after Dox induction. Scale bar: 100 μm, if not stated elsewise. For all subfigures: Mean±SEM; only significant comparisons are depicted. B-F,H,J,L,M: Ordinary two-way Anova with Sidak’s multiple comparison test. I: Ordinary one-way Anova with Tukey’s multiple comparison test.
Figure 6.
Figure 6.. McCune-Albright syndrome-derived and GNASR201H overexpressing PDLOs form large cysts
(A) Scheme of generating isogenic iPSC lines from a MAS patient carrying a mosaic GNASWT/R201C mutation followed by PDLO formation. (B) Sequencing results of selected iPSC clones. (C) FC-based PP quantification after differentiation of GNASWT/WT and GNASWT/R201C MAS-iPSCs (n=3; cl.: clonally derived iPSC line). (D) BF PDLO images from MAS-iPSCs. Right: Size comparison. (E) VIM and KRT19 IF staining of MAS-PDLOs. (F) Ki-67 IF staining (left images) and FC analysis after EdU-treatment (right) showed increased proliferation of GNASWT/R201C PDLOs. (G) Analysis of cAMP levels in MAS-iPSC and PDLO cells (n=1; in triplicates). (H) WB showing increased PKA signaling in GNASWT/R201C PDLOs. iPSC and PDLO samples shown separately were detected on the same blot, image was cropped due to additional loaded samples (n=1). (I) Representative BF images of MAS-iPSC-derived PDLOs treated with PKA inhibitor H89 or DMSO for 9 days. Right: Size quantification of PDLOs upon inhibition of PKA signaling (n=3). (J) Timed induction of a piggyBac GNASR201H transposon construct in engineered HUES8. (K) BF images of GNASR201H PDLO cultures after 7 days on Dox. (red: mCherry signal). Right: PDLO size quantification (n=3; in triplicates). (L) Dox concentration-dependent increase of PKA-signaling in PDLOs after Dox treatment for 3 days. Scale bar: 200 μm, if not stated elsewise. Mean±SEM; D,F: n=6 experiments per group (3 per individual clone), Mann-Whitney test. G: Ordinary one-way Anova with Tukey’s multiple comparison test. I,K: Ordinary two-way Anova with Sidak’s multiple comparison test; only significant comparisons are depicted.
Figure 7.
Figure 7.. Mutation-dependent PDAC- or IPMN-like tumor formation from PDLO grafts
(A) Schema of orthotopic PDLO transplantations. Oncogene expression was induced in vivo for 8 weeks. Reference images of HE staining of primary PDAC patient tissue are depicted for illustration. (B) HE overview images of grafts that developed from KRASG12D and CDKN2AKO/KO KRASG12D PDLOs with and without oncogene induction (lg/hg lesion, low-grade/high-grade preneoplastic lesion). Asterisks label murine pancreas tissue, arrows indicate invasive tumor growth, hashtag marks a second inset from a different section of the same graft, demonstrating a higher grade of cellular atypia. See Suppl.Fig7A for number of transplanted mice. (C) IHC staining showing that KRASG12D induction (reflected by HA-Tag) alone led to differentiated PDAC, and CDKN2AKO/KO KRASG12D to dedifferentiated PDAC. Arrows highlight single epithelial cells in the CDKN2AKO/KO KRASG12D graft. (D) One specific CDKN2AKO/KO KRASG12D graft with heterogenous transgene induction. Sites of dissemination and EMT correlate with HA-tag expression (indicated by arrows). (E) Staining of cell cycle-associated proteins. Few P21 positive cells. RB/pRB staining indicated an intact checkpoint control in KRASG12D tumors, but nearly complete loss of active RB in CDKN2AKO/KO KRASG12D grafts resulting in increased proliferation (Ki-67) in CDKN2AKO/KO KRASG12D grafts. Arrows highlight several mitoses in the CDKN2AKO/KO KRASG12D graft. (F) lcWGS of PDLO-derived tumors. (G) Schema and reference HE image of primary patient IPMN tissue. (H) IPMN-like lesion formation observed after GNASR201H induction in vivo. HE overview of low-grade cystic GNASR201H grafts and control without Dox treatment. Asterisks label disrupted Matrigel, observed in few grafts. See Suppl.Fig7A for number of transplanted mice. (I,J) IHC staining indicating IPMN formation after GNASR201H induction (confirmed by mCherry expression). Scale bar: 100 μm, except for HE staining in B,D,H: 500 μm; in insets: 50 μm.

Comment in

References

    1. AIELLO NM, MADDIPATI R, NORGARD RJ, BALLI D, LI J, YUAN S, YAMAZOE T, BLACK T, SAHMOUD A, FURTH EE, BAR-SAGI D & STANGER BZ 2018. EMT Subtype Influences Epithelial Plasticity and Mode of Cell Migration. Dev Cell, 45, 681–695. - PMC - PubMed
    1. ANSIEAU S, BASTID J, DOREAU A, MOREL AP, BOUCHET BP, THOMAS C, FAUVET F, PUISIEUX I, DOGLIONI C, PICCININ S, MAESTRO R, VOELTZEL T, SELMI A, VALSESIA-WITTMANN S, CARON DE FROMENTEL C & PUISIEUX A 2008. Induction of EMT by twist proteins as a collateral effect of tumor-promoting inactivation of premature senescence. Cancer Cell, 14, 79–89. - PubMed
    1. BARON M, VERES A, WOLOCK SL, FAUST AL, GAUJOUX R, VETERE A, RYU JH, WAGNER BK, SHEN-ORR SS, KLEIN AM, MELTON DA & YANAI I 2016. A Single-Cell Transcriptomic Map of the Human and Mouse Pancreas Reveals Inter- and Intra-cell Population Structure. Cell Syst, 3, 346–360. - PMC - PubMed
    1. BARTEK J, BARTKOVA J & LUKAS J 2007. DNA damage signalling guards against activated oncogenes and tumour progression. Oncogene, 26, 7773–9. - PubMed
    1. BENJAMINI Y & HOCHBERG Y 1995. Controlling the false discovery rate: a practical and powerful approach to multiple testing. Journal of the Royal statistical society: series B (Methodological), 57, 289–300.

Publication types