. 2021 Sep 2;28(9):1516-1532.e14.
doi: 10.1016/j.stem.2021.04.002. Epub 2021 Apr 28.

Inflation-collapse dynamics drive patterning and morphogenesis in intestinal organoids

Affiliations

Inflation-collapse dynamics drive patterning and morphogenesis in intestinal organoids

Naren P Tallapragada et al. Cell Stem Cell. .

Abstract

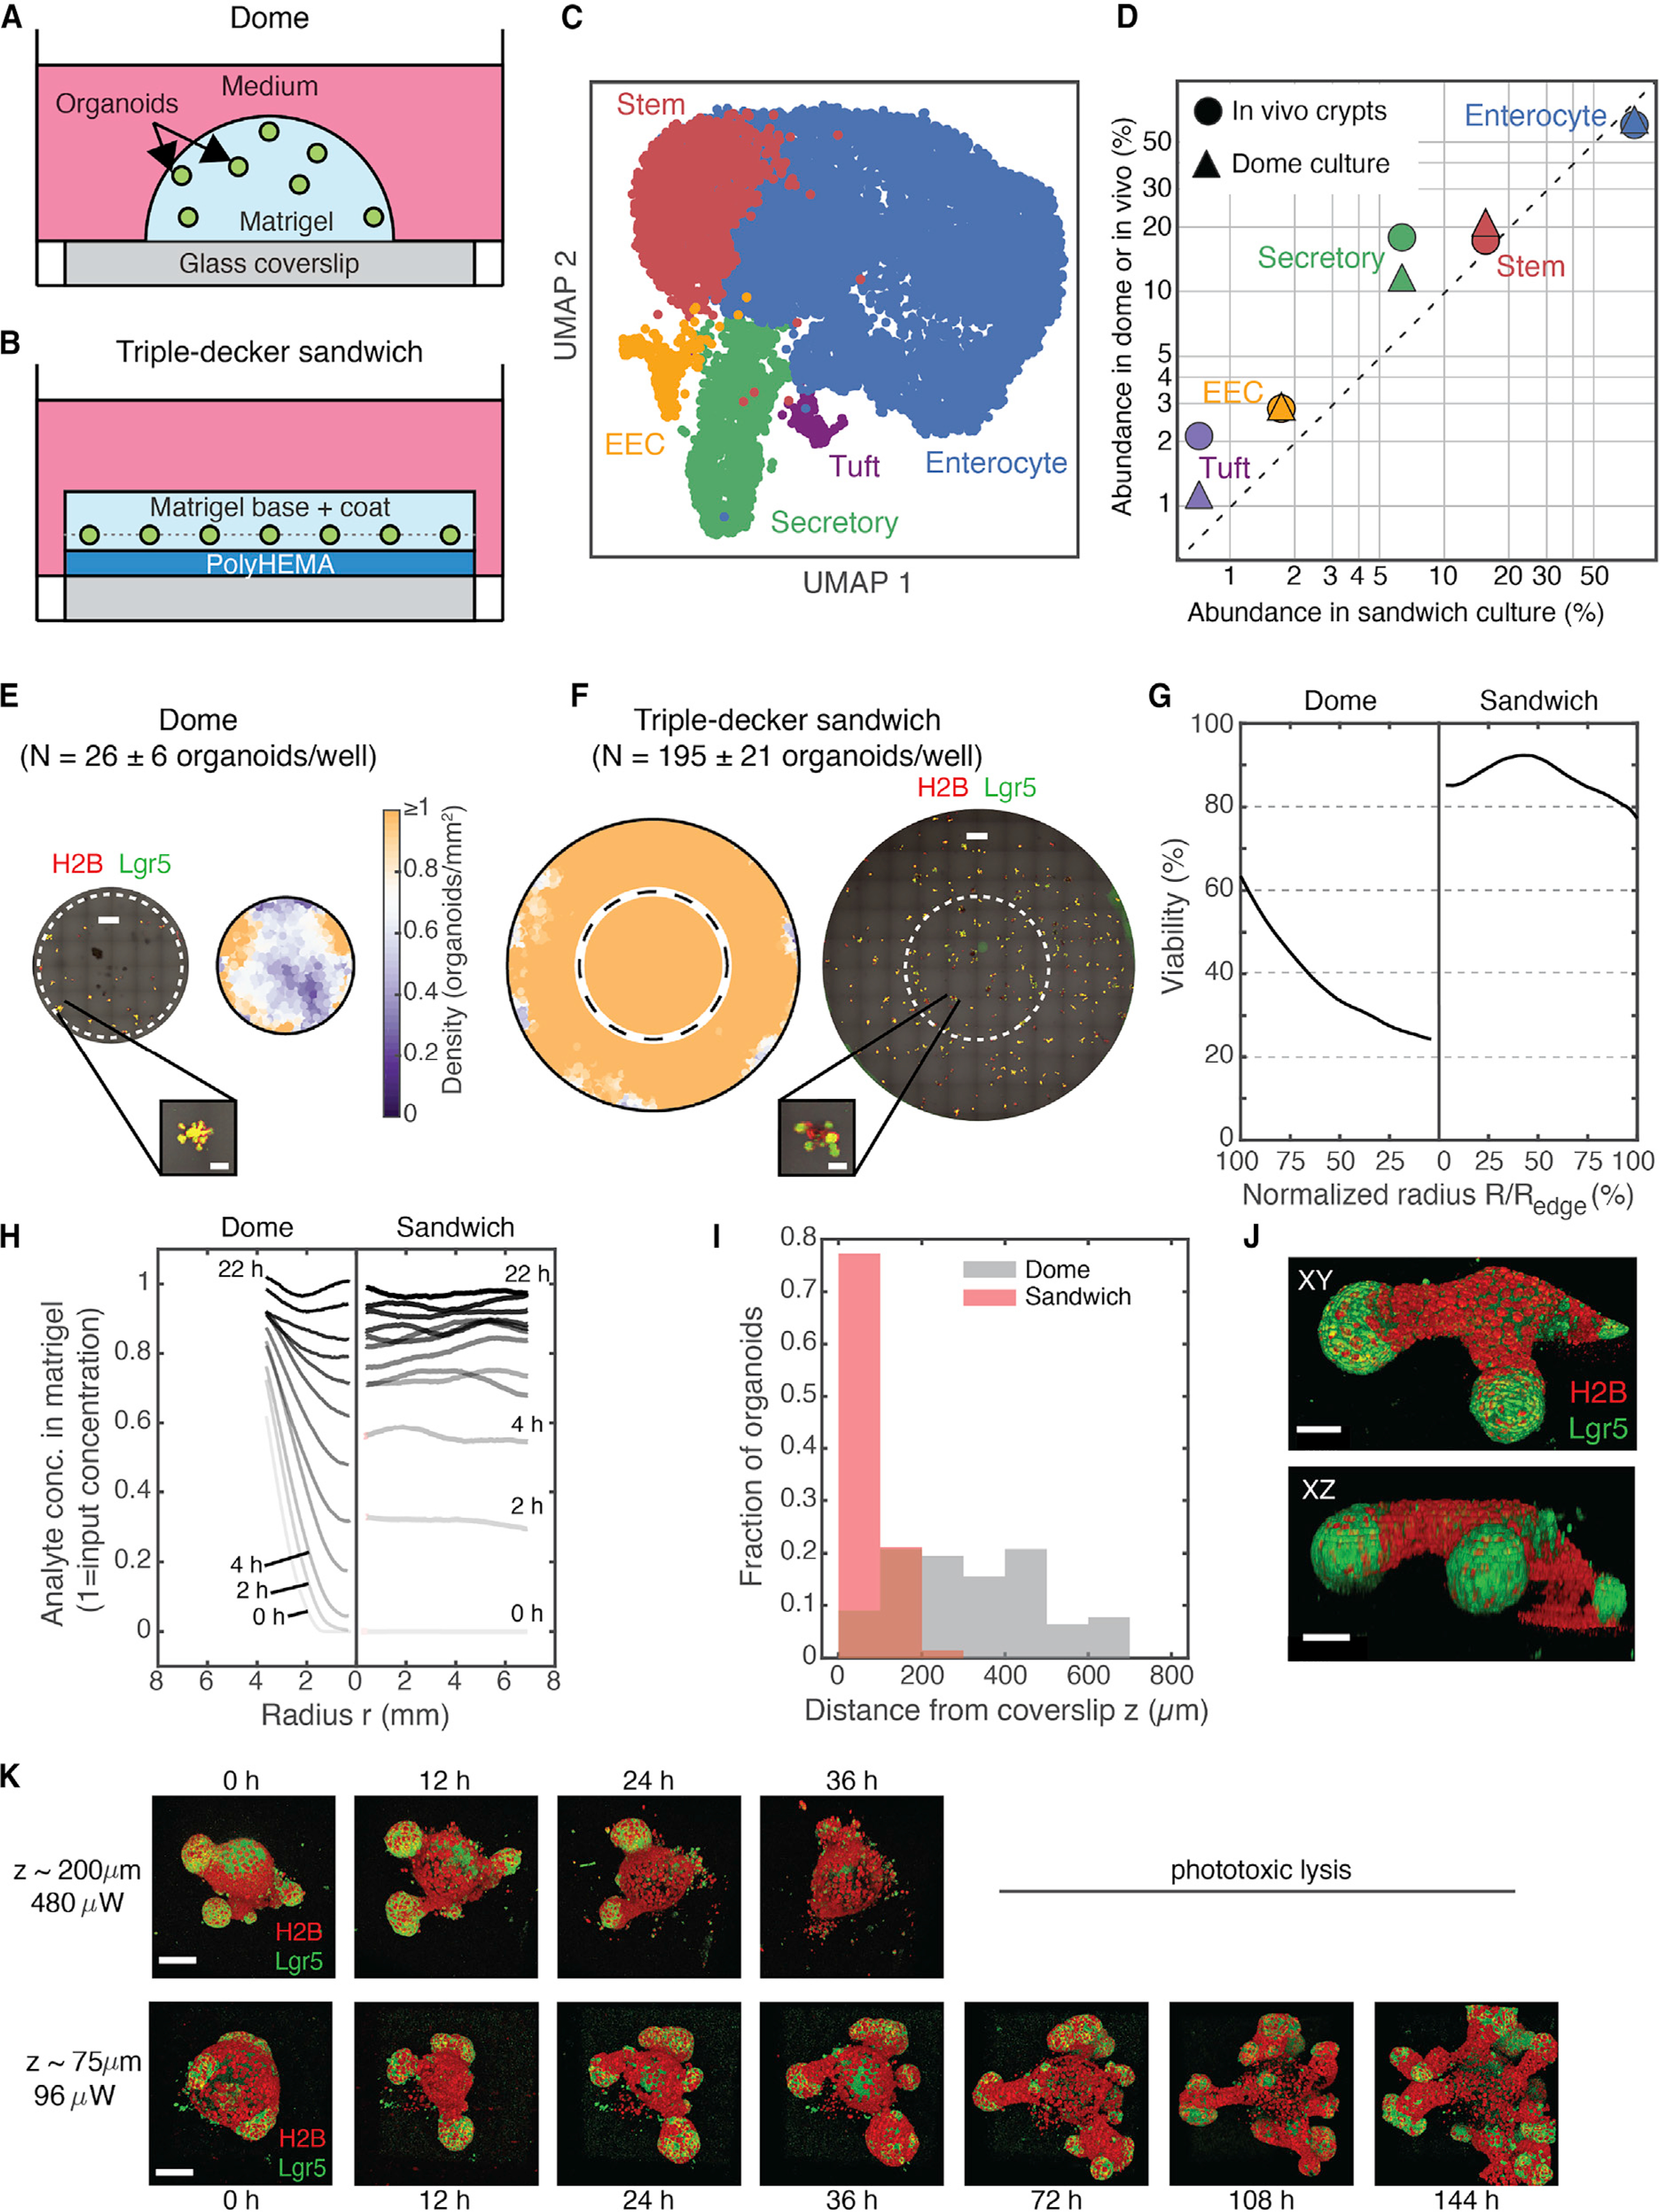
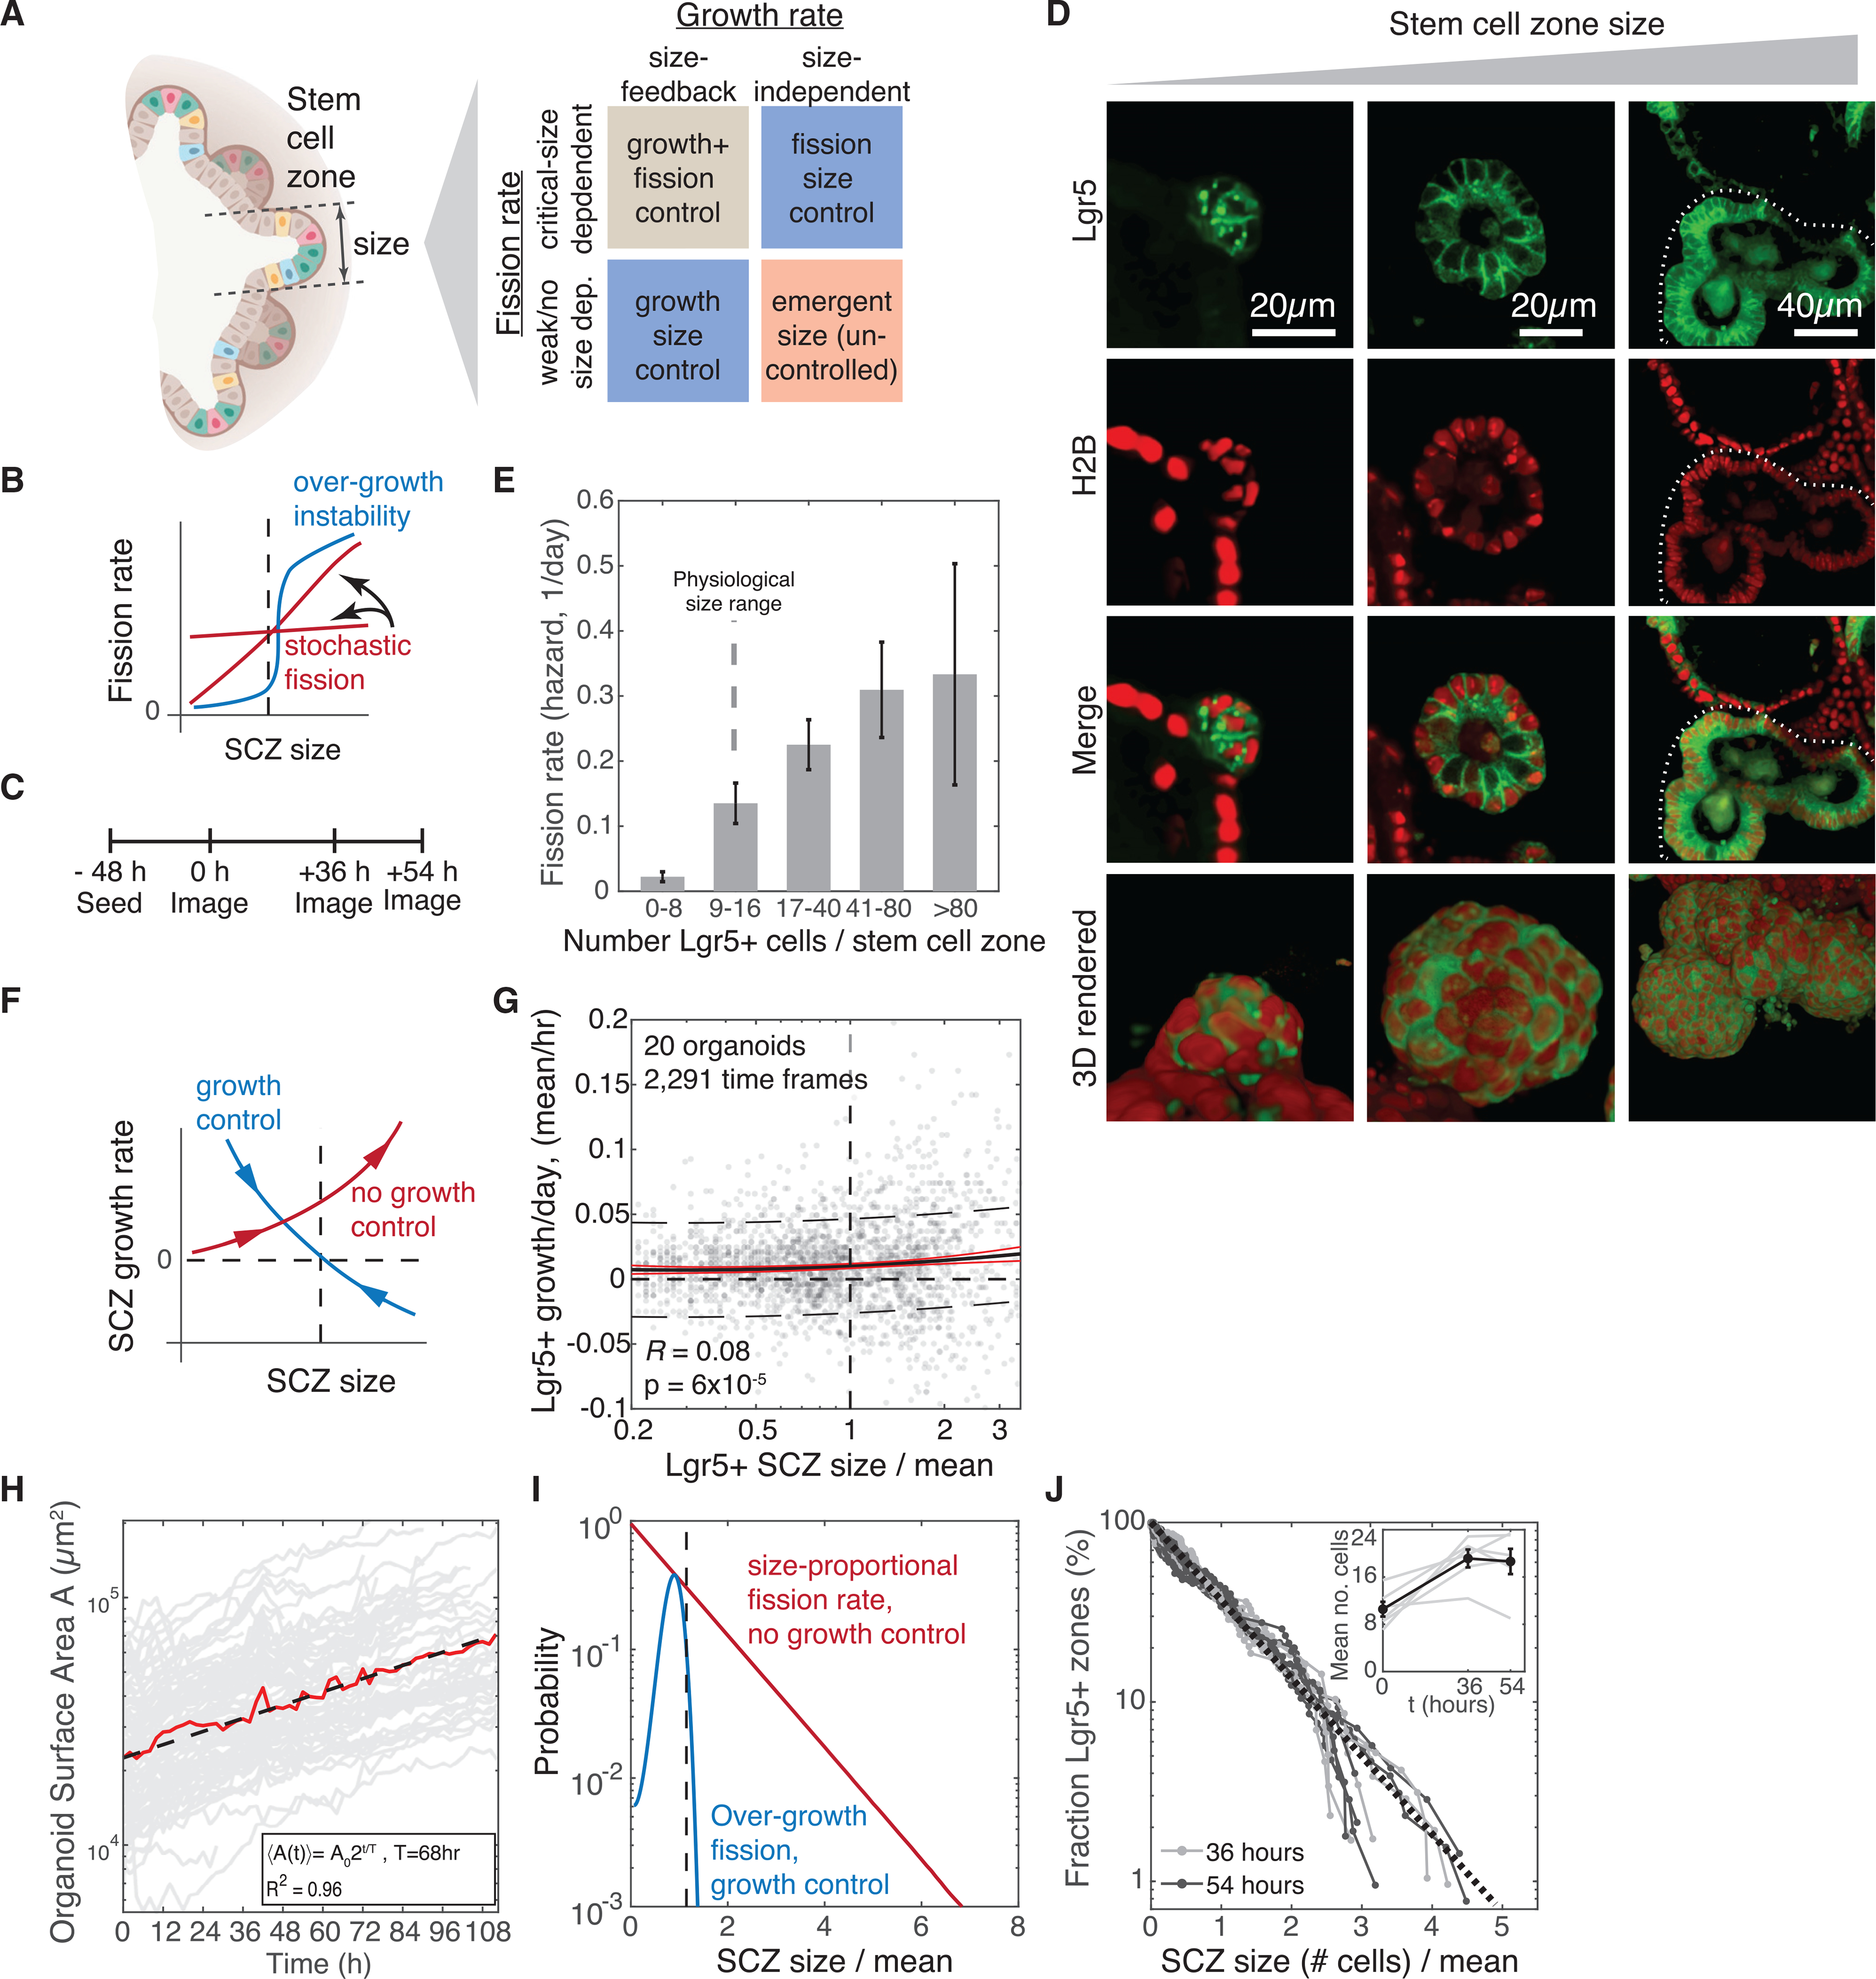
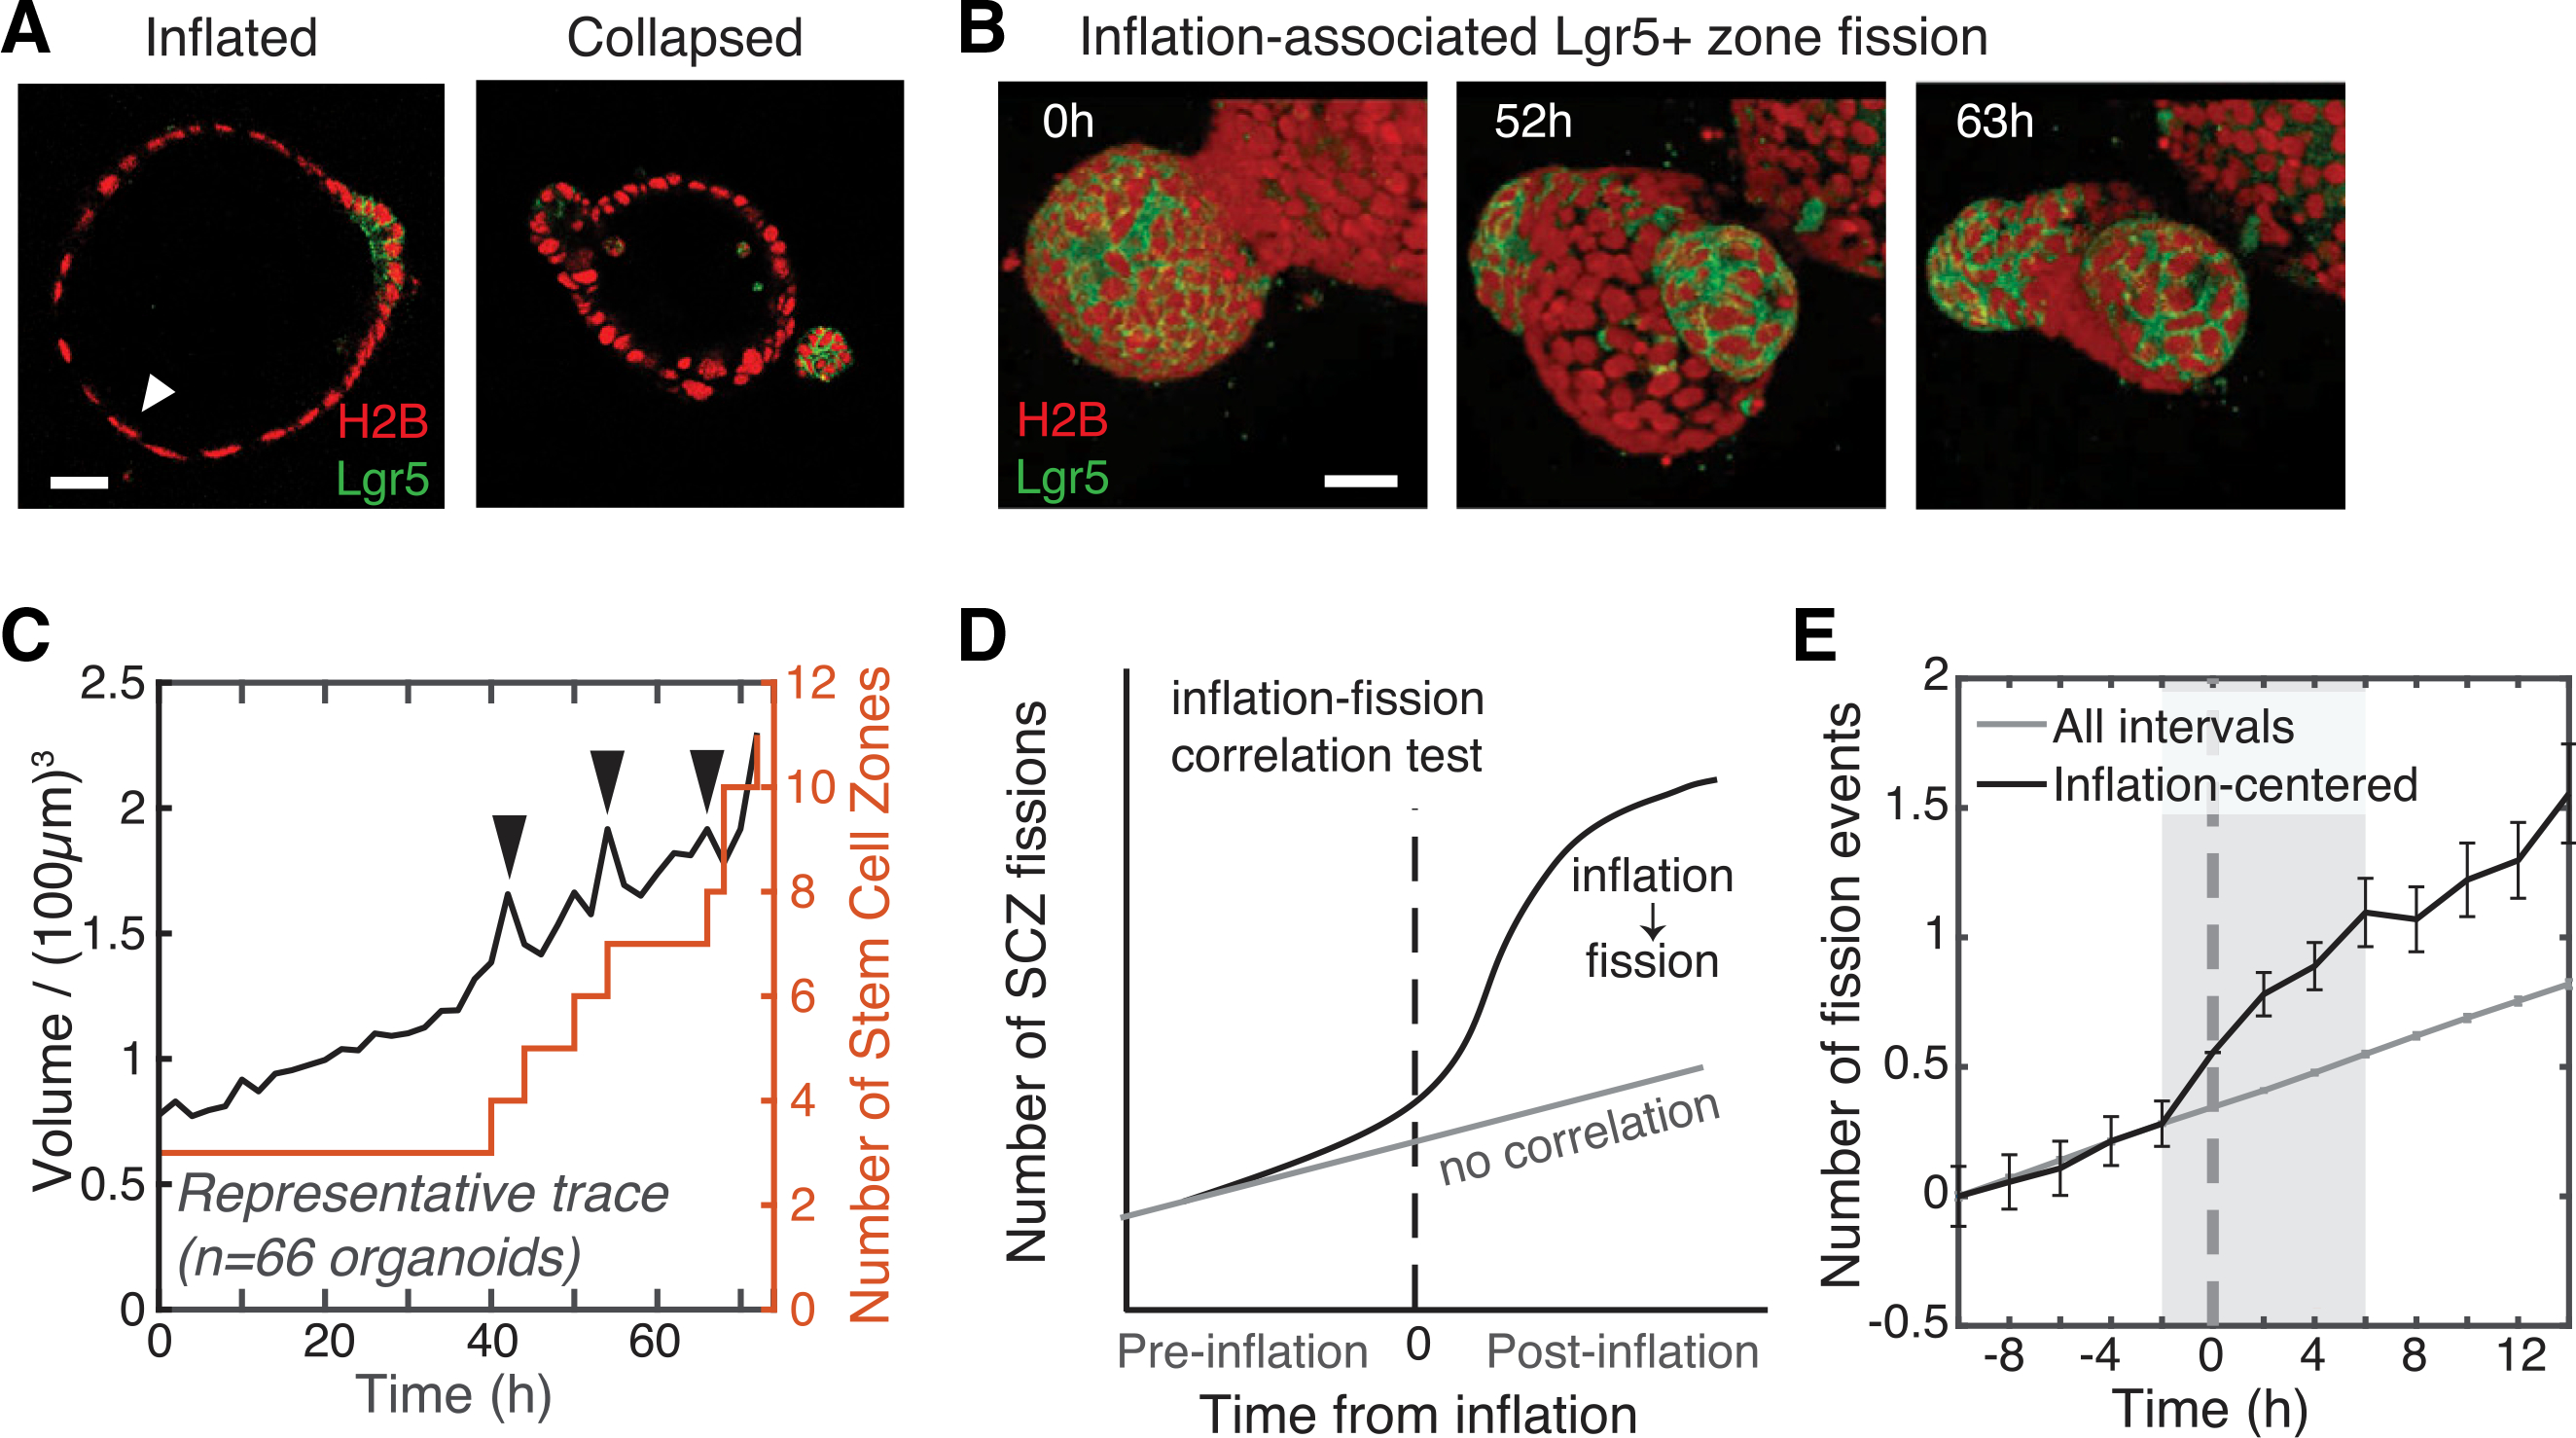
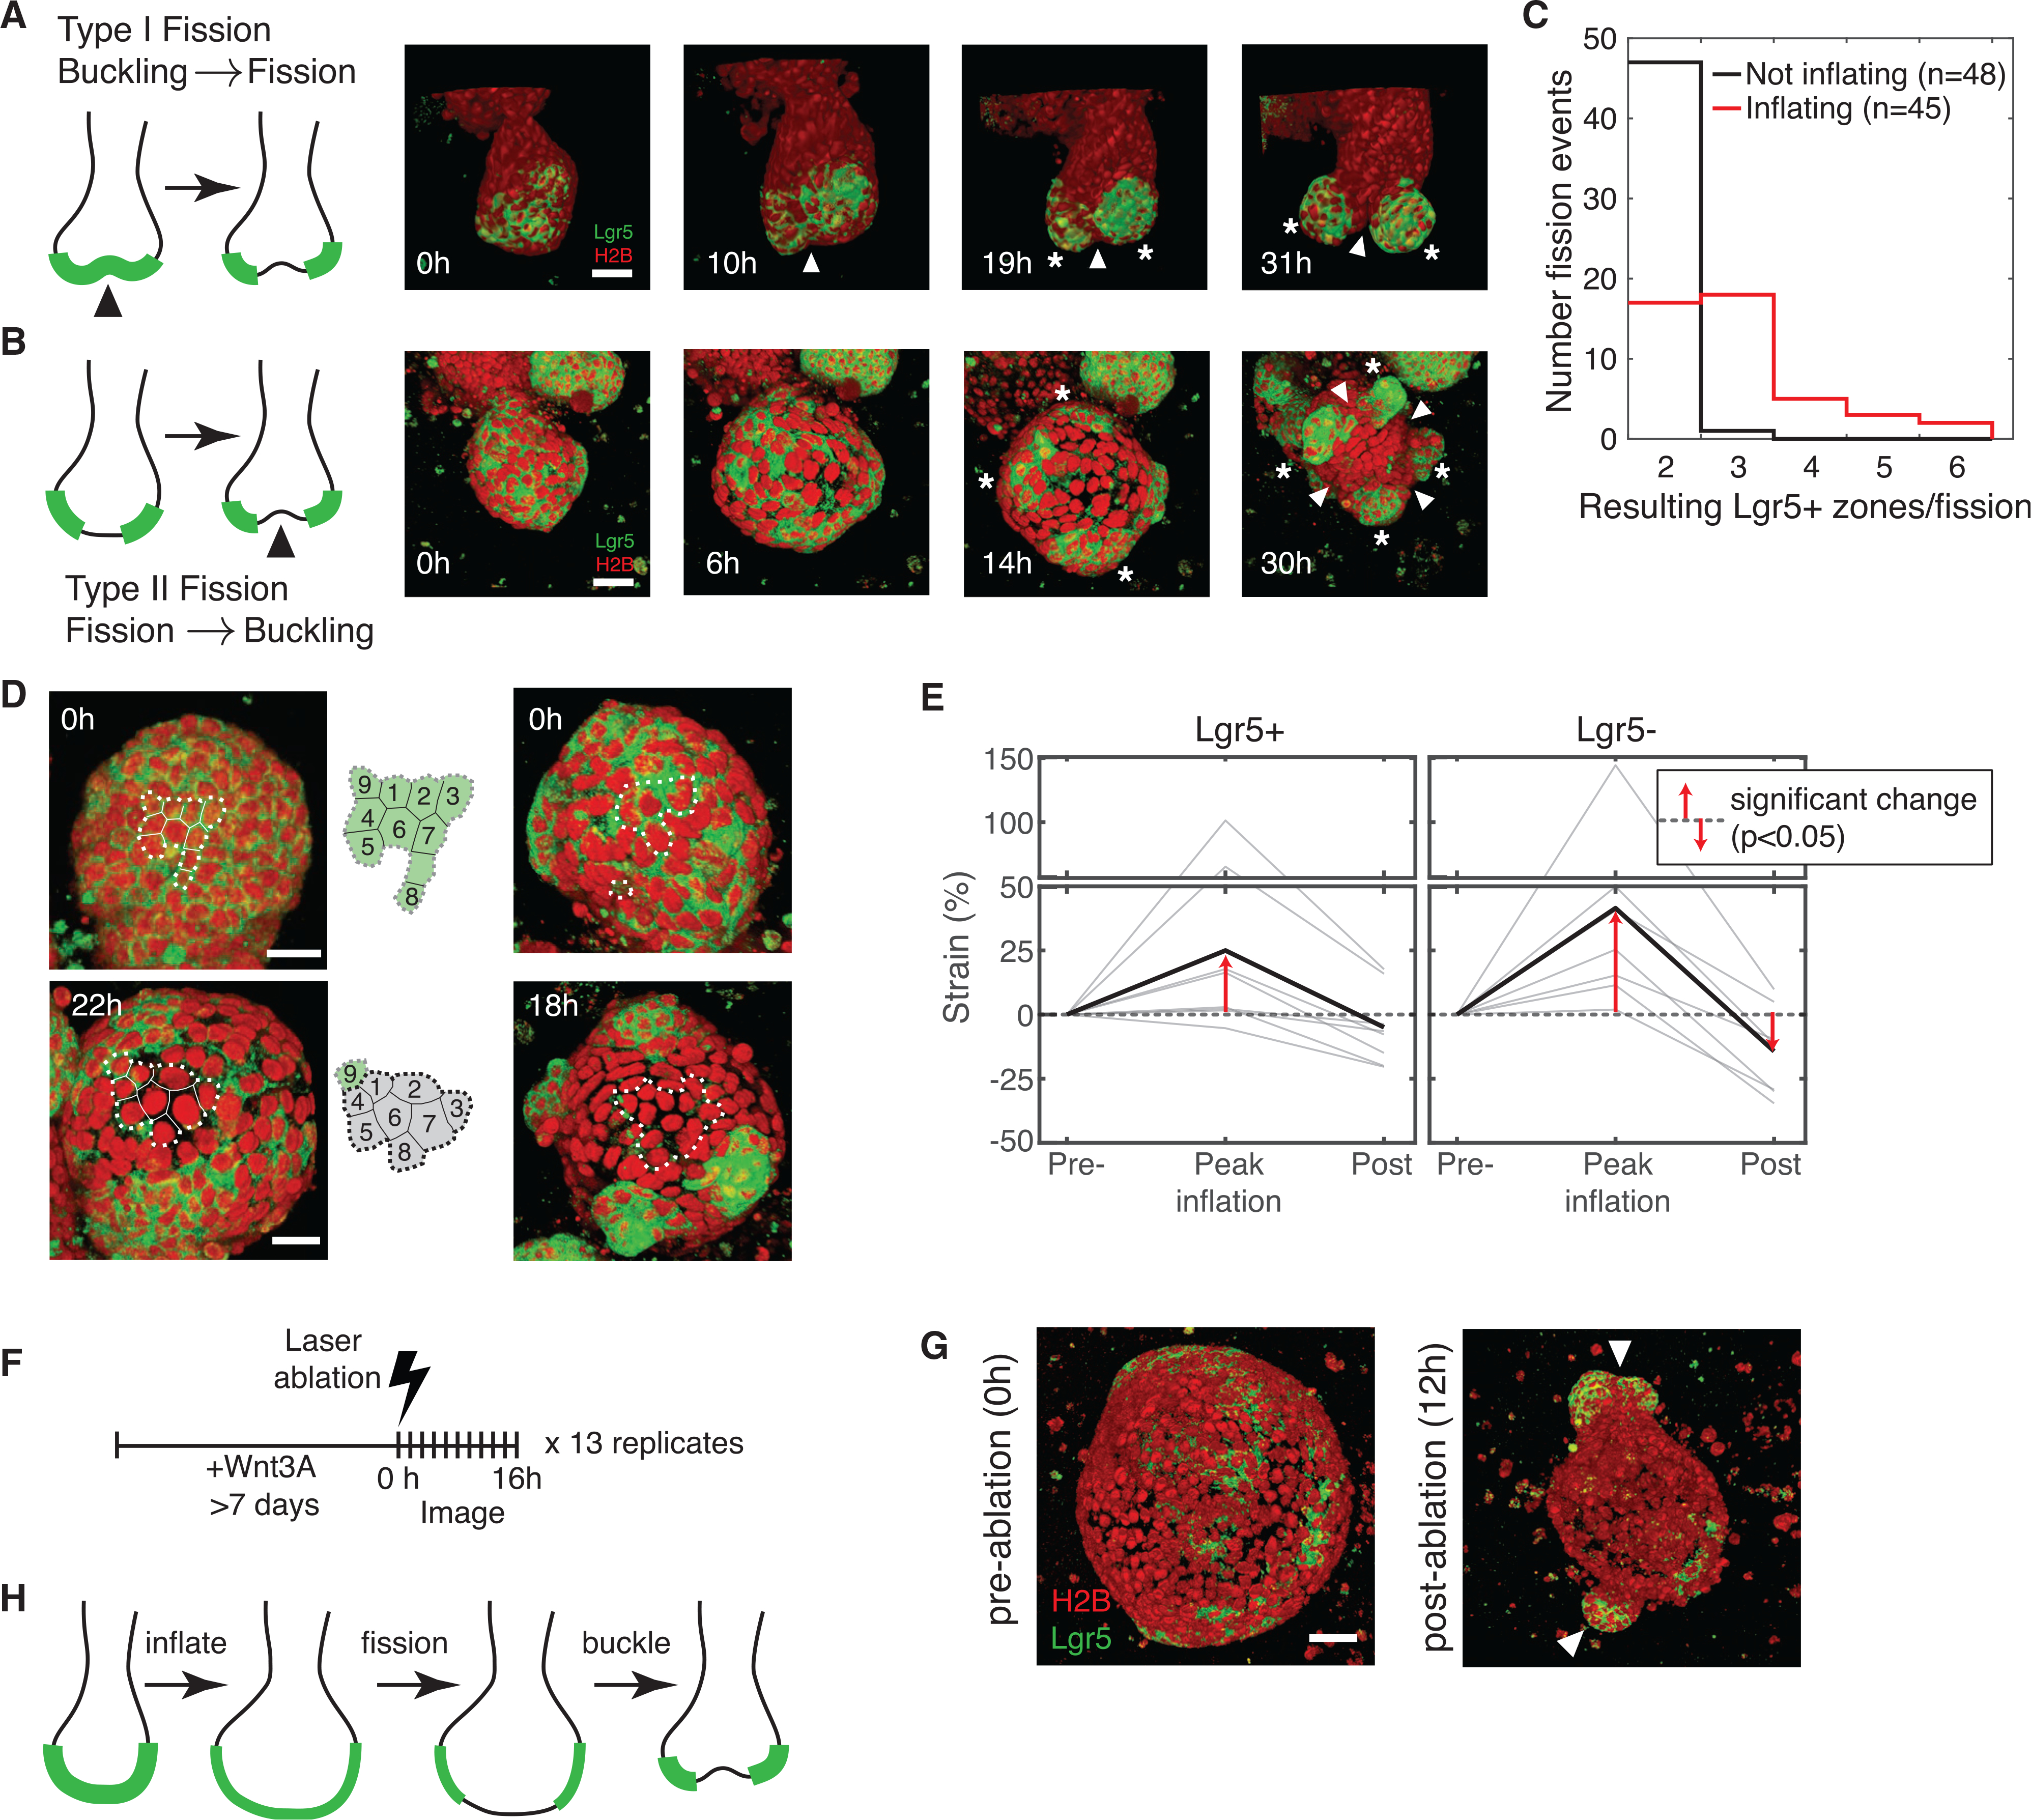
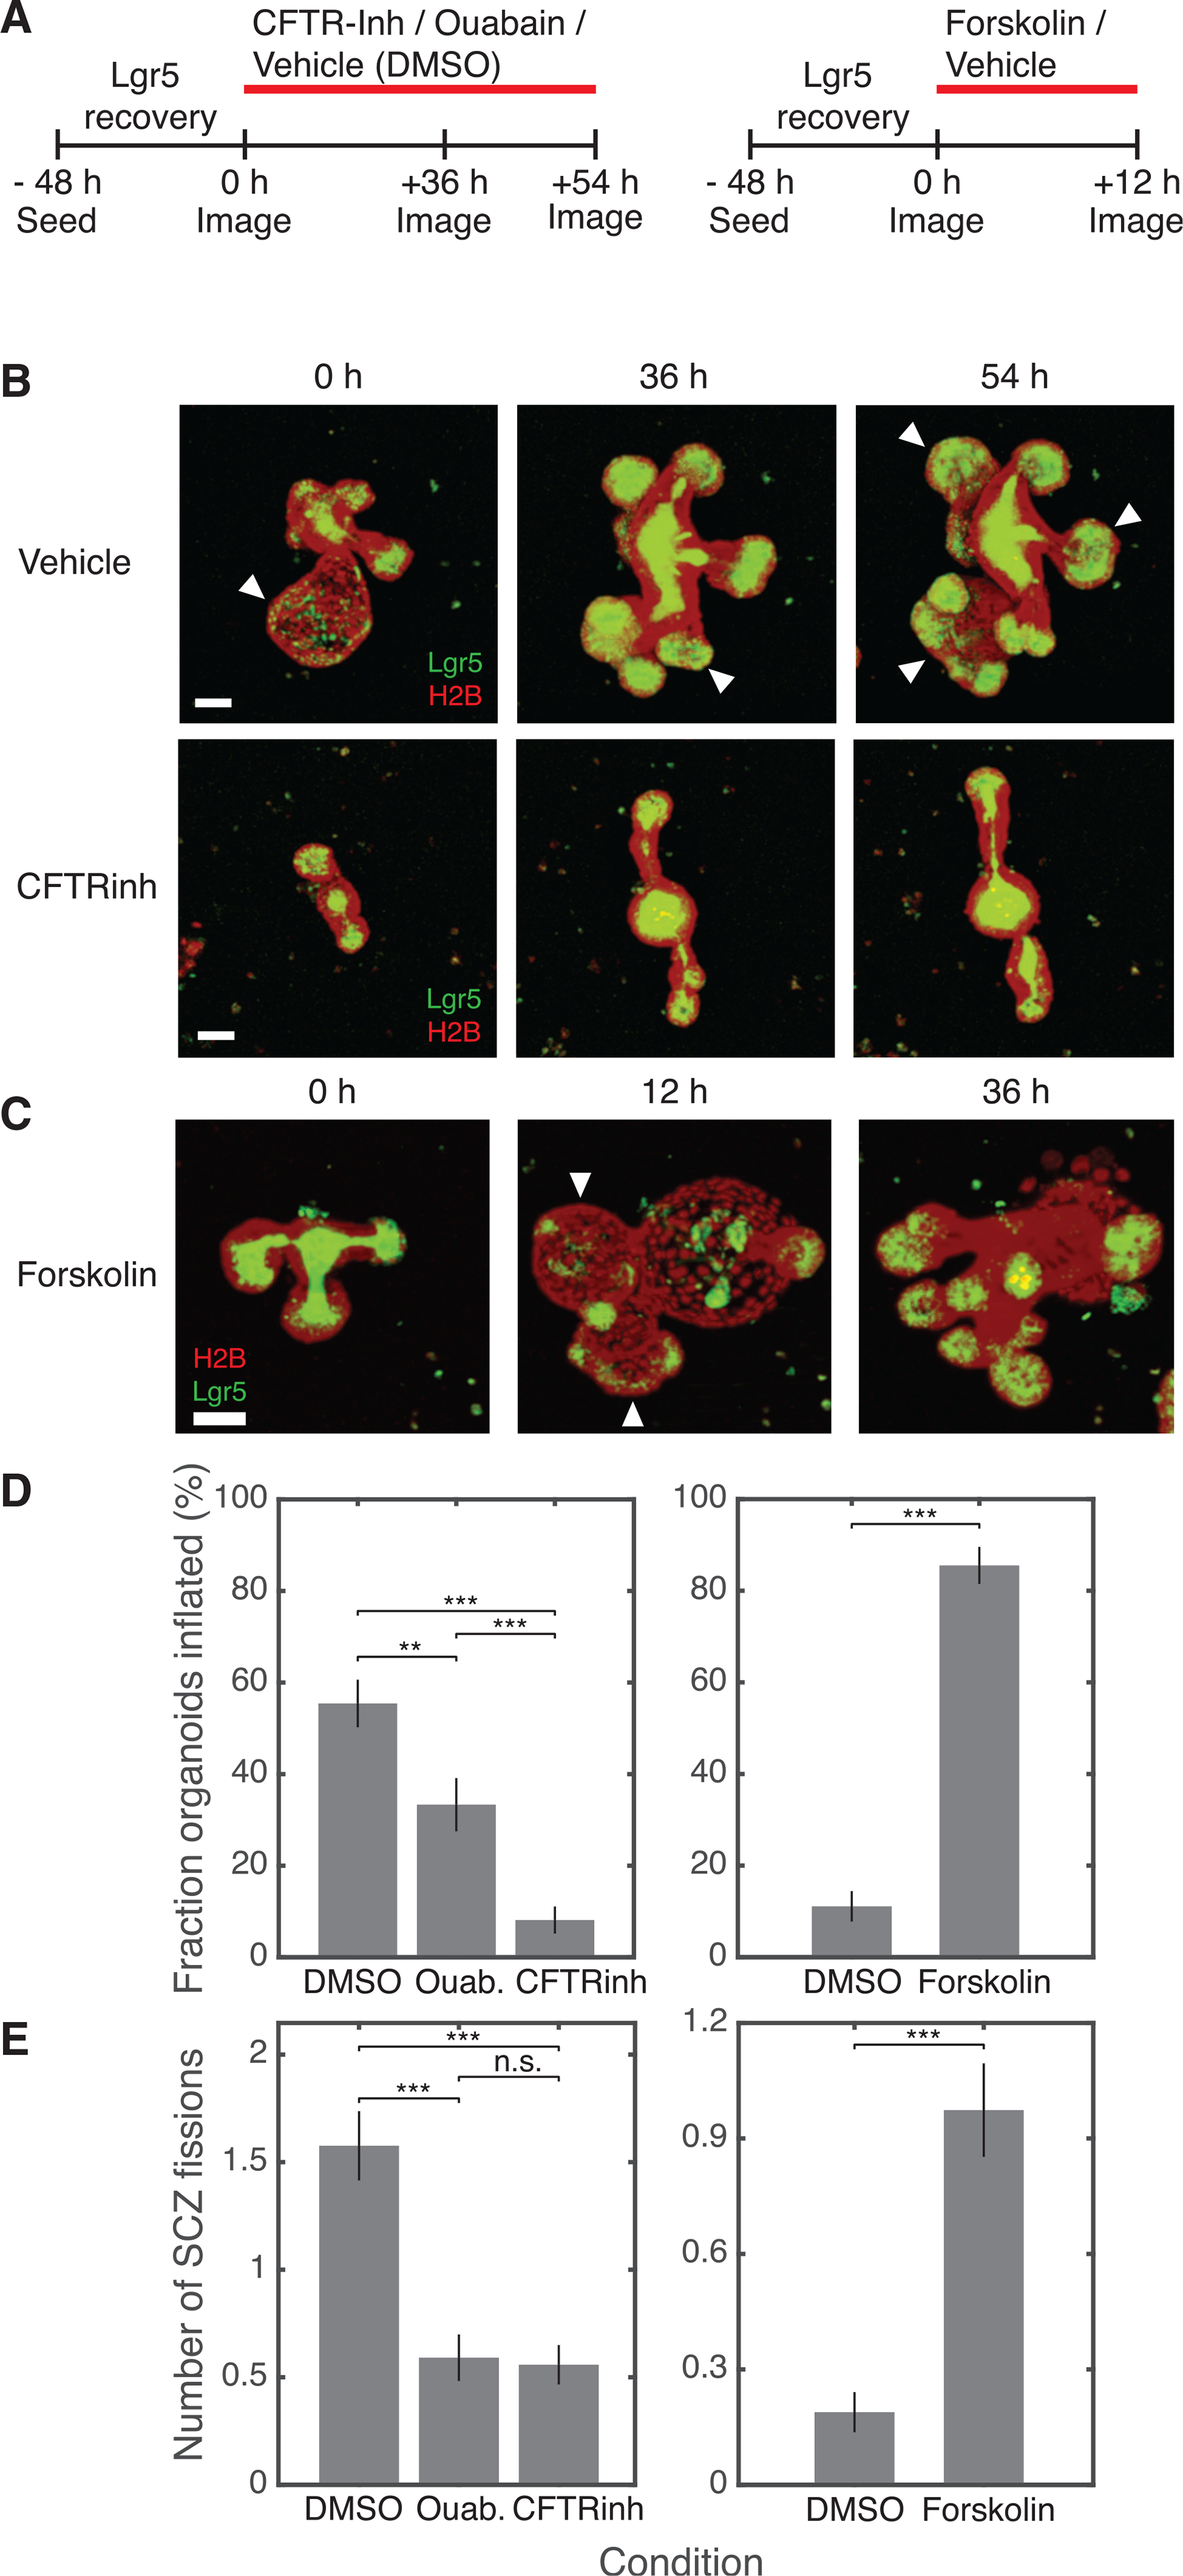
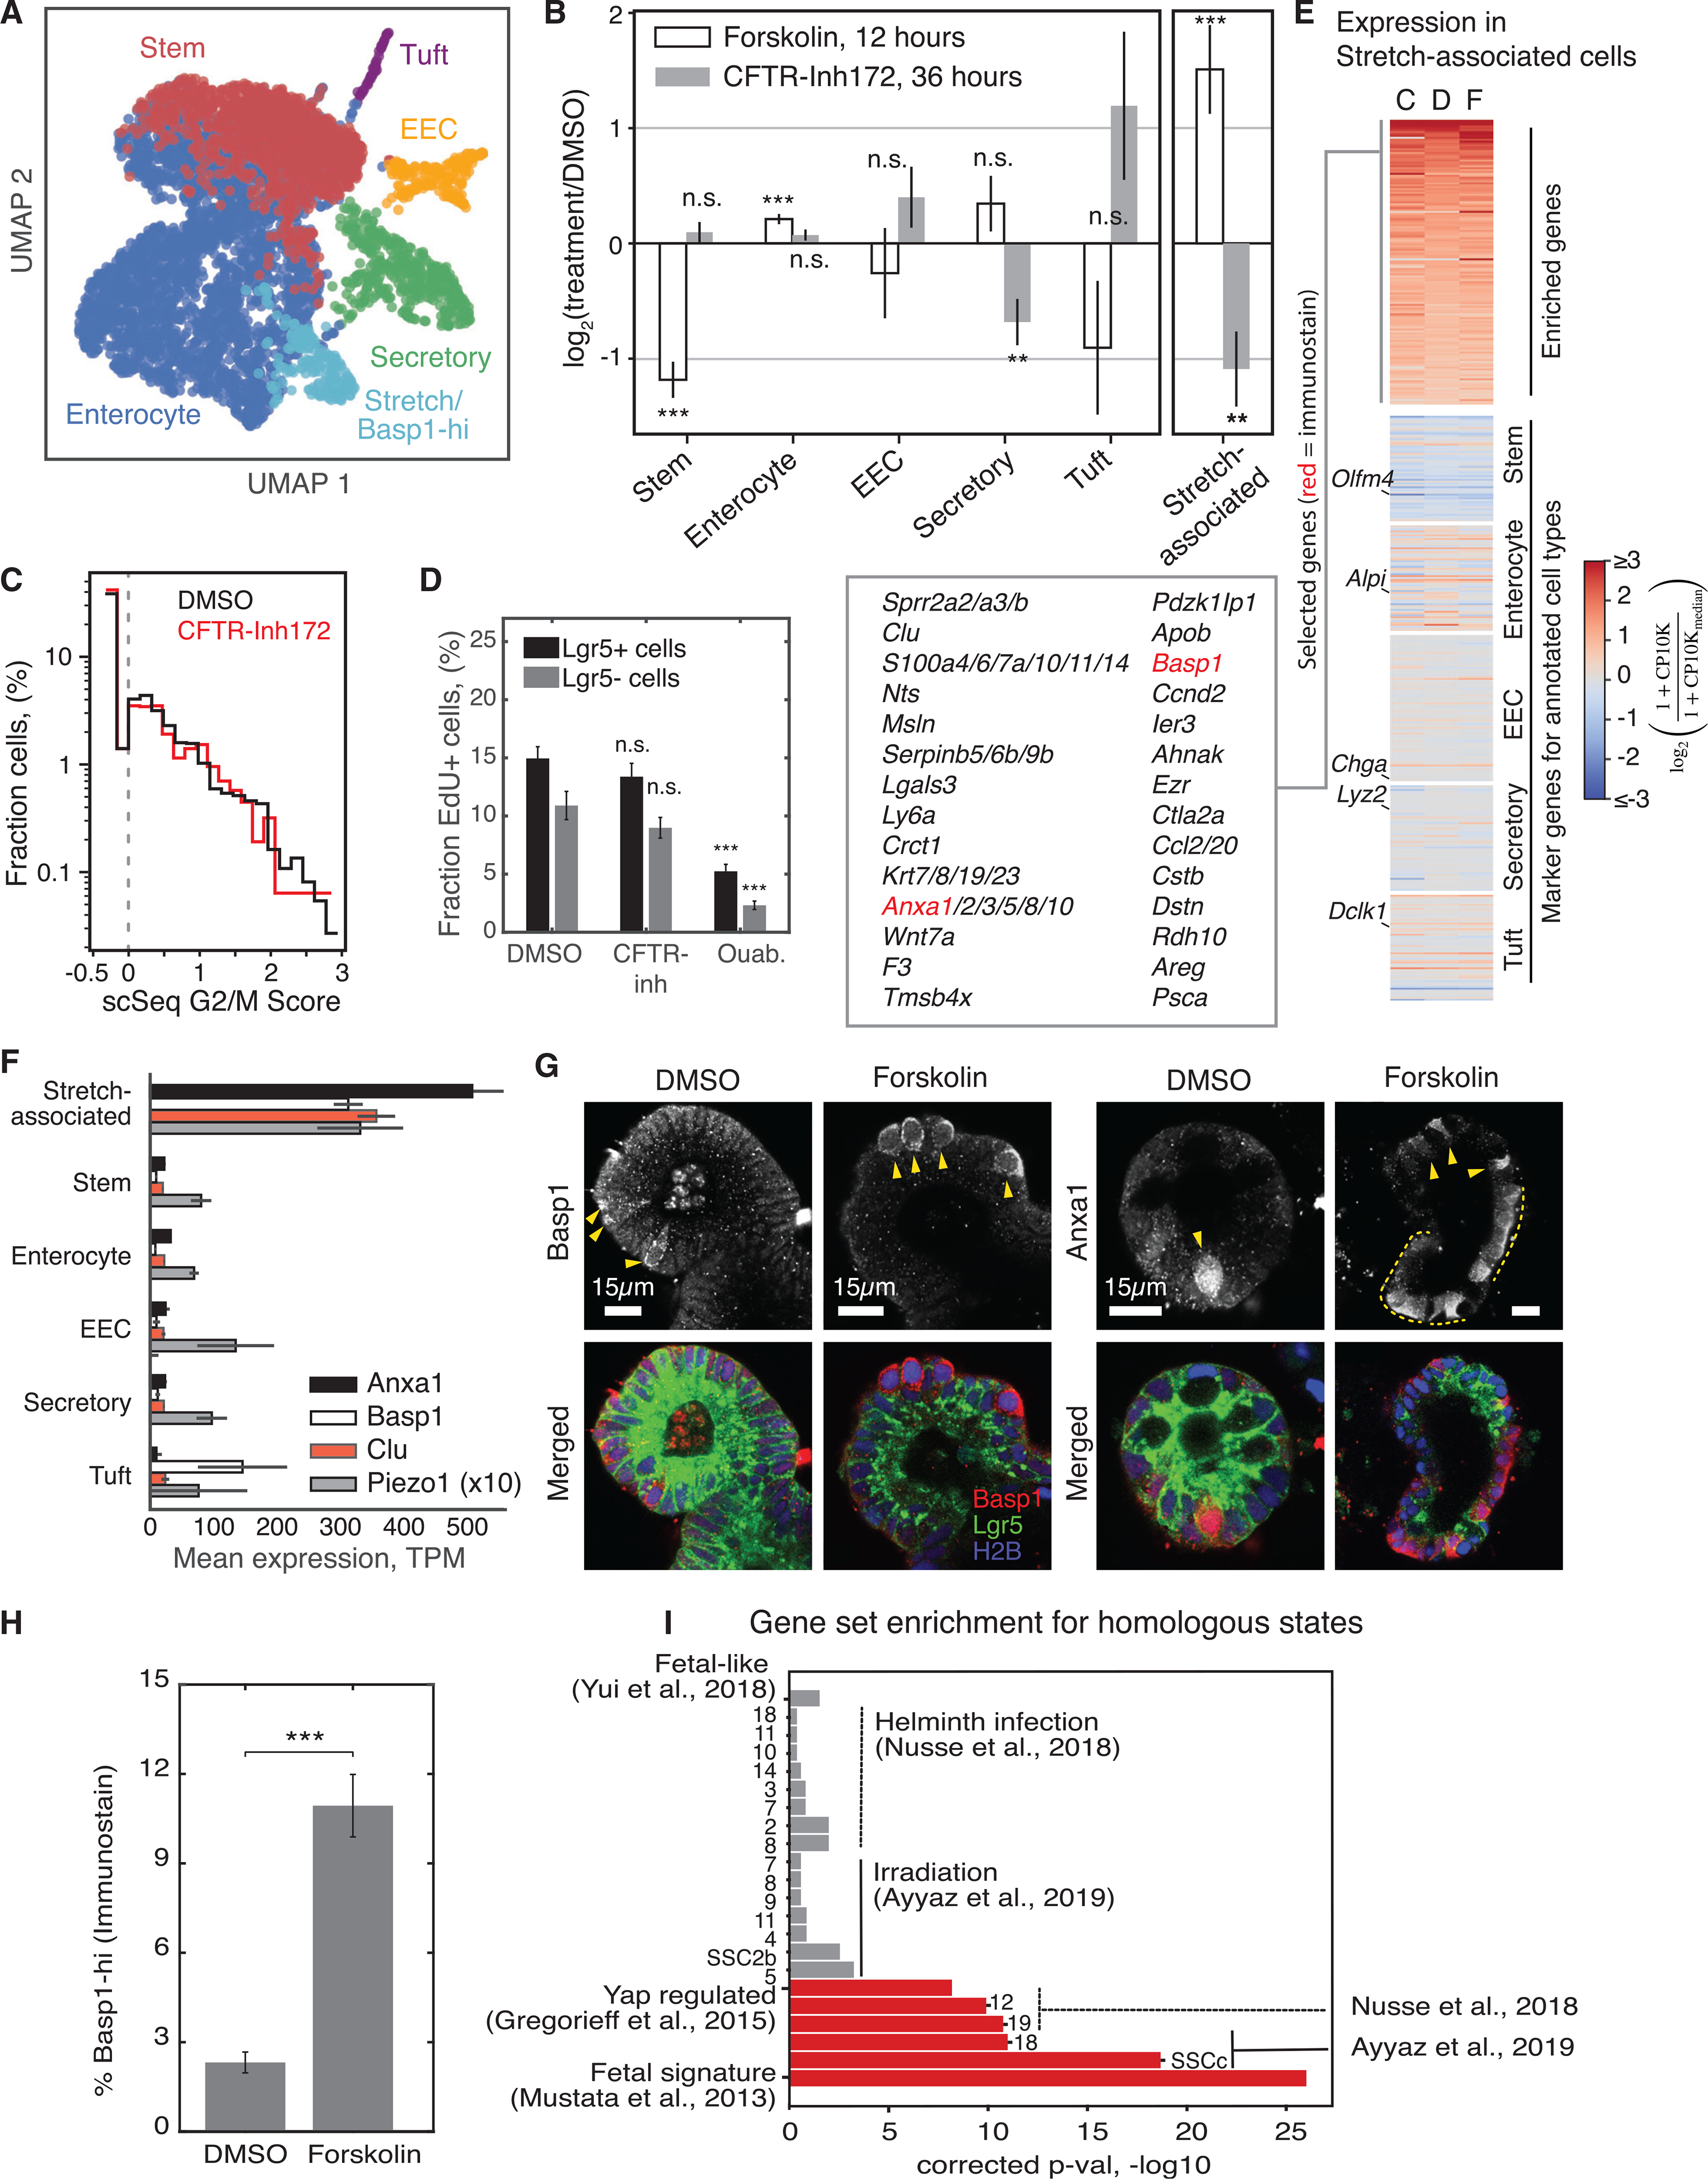
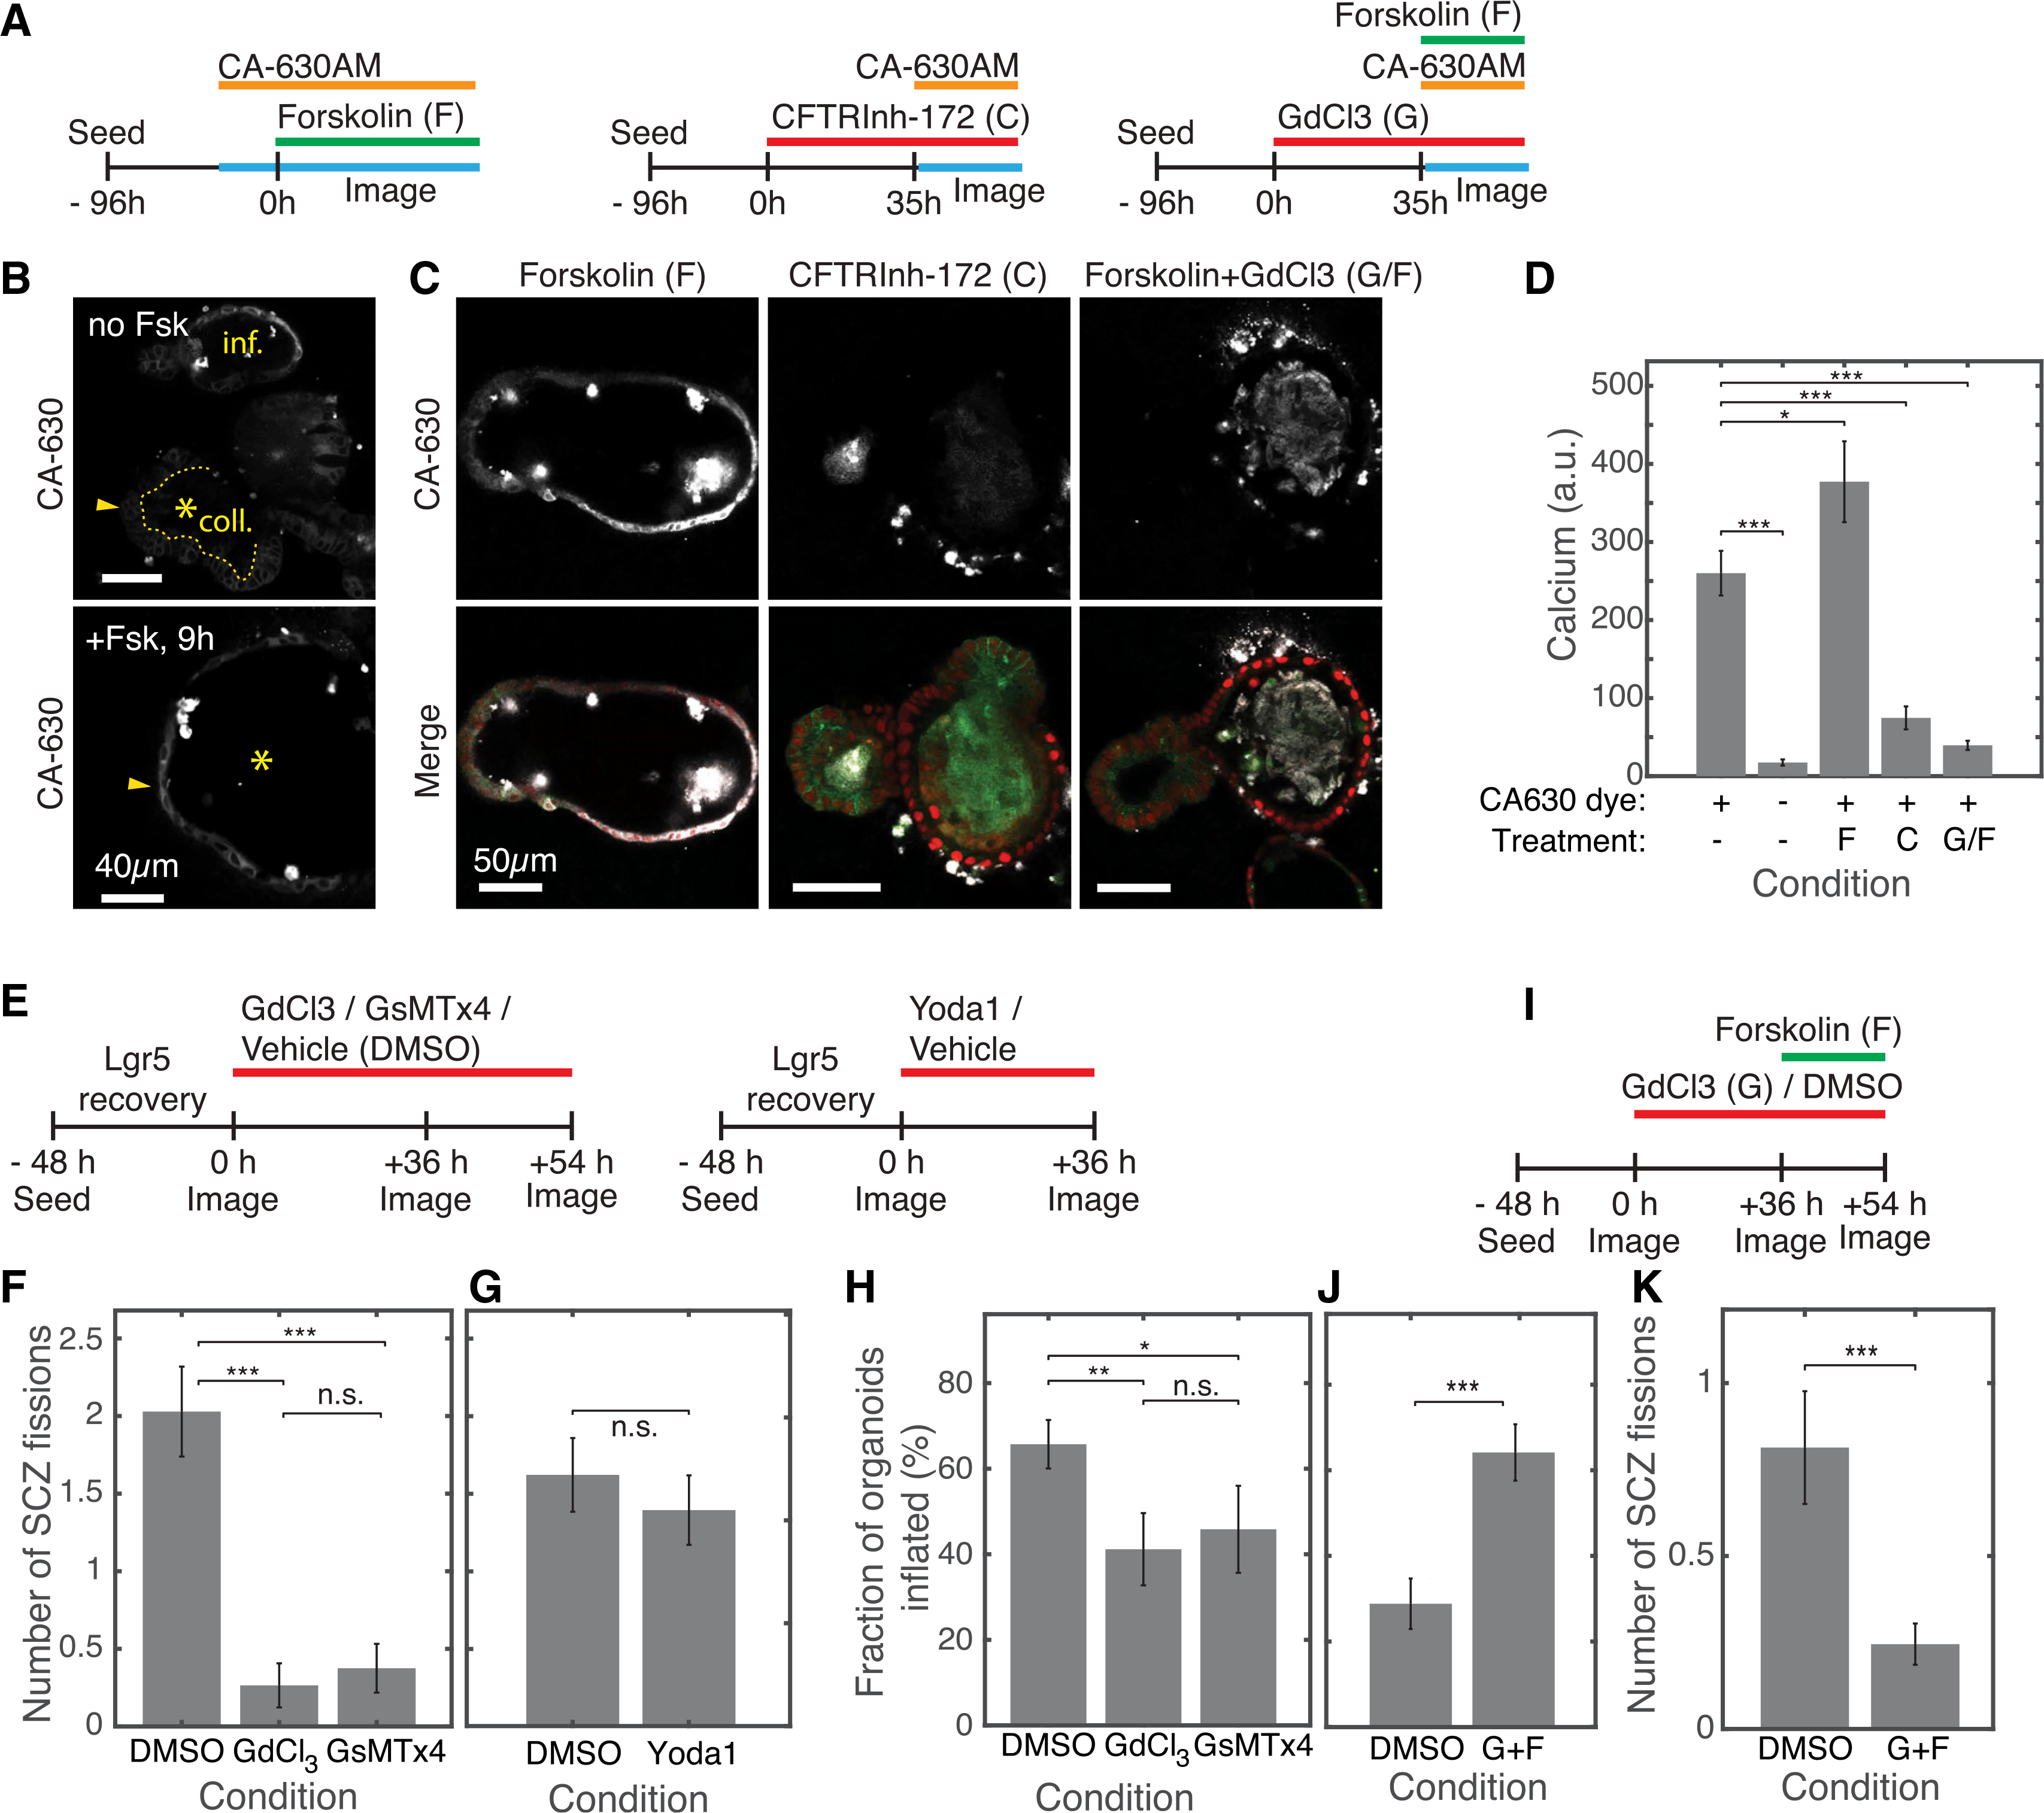
How stem cells self-organize to form structured tissues is an unsolved problem. Intestinal organoids offer a model of self-organization as they generate stem cell zones (SCZs) of typical size even without a spatially structured environment. Here we examine processes governing the size of SCZs. We improve the viability and homogeneity of intestinal organoid cultures to enable long-term time-lapse imaging of multiple organoids in parallel. We find that SCZs are shaped by fission events under strong control of ion channel-mediated inflation and mechanosensitive Piezo-family channels. Fission occurs through stereotyped modes of dynamic behavior that differ in their coordination of budding and differentiation. Imaging and single-cell transcriptomics show that inflation drives acute stem cell differentiation and induces a stretch-responsive cell state characterized by large transcriptional changes, including upregulation of Piezo1. Our results reveal an intrinsic capacity of the intestinal epithelium to self-organize by modulating and then responding to its mechanical state.

Keywords: intestinal stem cells; live imaging; mechanobiology; organoids; self-organization; size control; stretch-responsive cell.


Conflict of interest statement

Declaration of interests A.M.K. is a founder of 1CellBio, Inc.

Figures

Figure 1.
Figure 1.. Triple-decker hydrogel sandwiches for uniform organoid culture and imaging
(A and B) Configuration of organoid cultures in Matrigel droplets (domes) compared with sandwich cultures consisting of a passivating polyHEMA layer and Matrigel layers. (C) UMAP representation of scRNA-seq (13,062 cells × 30,005 genes) of dome and sandwich (n = 6 wells each) cultures, colored by annotated cell type. EEC, enteroendocrine. (D) The fraction of cells classified to each cell type in sandwich cultures compared with dome cultures and freshly isolated intestinal crypts. (E and F) Representative tiled, flattened images of mouse intestinal organoids cultured in domes or sandwiches alongside smoothed density heatmaps (average of 3 replicate wells). Dashed circles indicate the circumference of dome culture, overlaid to show the difference in available imaging area. Representative organoids are magnified. Scale bars, 1 mm and 200 μm (inset). Here and elsewhere: green, Lgr5-DTR-EGFP; red, H2B-mCherry. (G) The fraction of organoids surviving after 5 days in culture (viability), plotted against distance from the center of the dome/sandwich. (H) Fluorescence intensity time series of an analyte (dextran) as a function of radius from the center of the dome/sandwich. Other molecules are shown in Figure S1. (I) Histograms of organoid heights. Sandwich cultures (red) align organoids with the coverslip (n = 599 from 3 wells); organoids in domes (gray) are distributed over hundreds of micrometers (n = 68 organoids from 3 wells). (J) Triple-decker sandwiches enable full-thickness structures to be resolved by confocal microscopy. Shown are orthographic projections of an organoid with two SCZs. Scale bar, 30 μm. (K) 3D fluorescence time-lapse imaging using a laser-scanning confocal microscope (15-min time interval; Video S1) is phototoxic at 200 μm from the coverslip but not at the 75-μm distance typical for sandwich cultures. Scale bar, 100 μm.
Figure 2.
Figure 2.. ISCs in organoid cultures lack intrinsic size control
(A) Classes of mechanisms by which Lgr5+ stem cell zones (SCZs) in culture could spontaneously acquire characteristic mean size: by reducing growth rates of large SCZs, triggering fission of large SCZs, or both. (B) Schematic of a test for fission control by evaluating fission rates at different SCZ sizes. The dashed line indicates characteristic physiological size. (C) Experimental schematic for measuring size-dependent SCZ fission rates. The same SCZs are tracked over 3 imaging time points to assess their initial size and whether they undergo fission. See Figure S2 and STAR Methods for SCZ size segmentation and calibration. (D) Single z sections and 3D rendered projections of representative Lgr5+ SCZs varying from tens to several hundreds of cells. On the right, the dashed lines delineate the SCZ. (E) Organoid SCZs are unstable to fission even at sizes that are normally stable in vivo (n = 74). Fission rates are calculated as the number of fission events of SCZs with initial size n1 < n < n2 prior to fission (indicated in the plot), divided by the recorded duration in which any organoid is of size n1 < n < n2. Error bars indicate SEM by error propagation of volume and sampling SEMs. (F) Schematic of the test for SCZ size-dependent feedback control on net self-renewal rates of stem cells. Arrows indicate the mean dynamics associated with each case. (G) Time series measurements of SCZ size in multiple organoids indicate a weak positive correlation between SCZ size and growth rate, ruling out intrinsic feedback growth control. n = 20 organoids, 2,291 time frames. (H) The organoid surface area grows exponentially with a doubling time of 68 h, as determined by analyzing time series data from z stacks of H2B-mCherry-labeled organoids (n = 94). (I) Predicted steady-state size distributions of SCZs under assumptions of size-dependent feedback (blue) or no size control of growth and fission rates (red). Curves show numerical PBE model solutions. (J) Experimentally observed SCZ sizes are distributed exponentially at steady state, consistent with a model lacking growth and fission size control (n = 659 SCZs from 5 wells across 3 time points). Inset: average SCZ size.
Figure 3.
Figure 3.. SCZ fission correlates with inflation of the organoid lumen
(A) Micrographs of inflated and collapsed organoids. Lgr5 cells in inflated organoids (white arrow) are squamous like. Scale bar, 40 μm. (B) Time series images showing a contiguous Lgr5+ region splitting in two as the bud inflates (52 h). Scale bar, 30 μm. (C) Representative time series data of segmented organoid volume (black) and SCZ number (red) used to test for correlation between inflation-collapse and fission. The organoid was imaged every 2 h for 72 h. Black arrows indicate autodetected inflation-collapse events. (D) Schematic of the test for temporal correlation of inflation and fission. If correlated, then the number of SCZ fission events should increase immediately after inflation compared with all intervals of the same duration (gray, no correlation). (E) A correlation test (n = 66 organoids) shows that the SCZ fission rate increases significantly above the baseline rate in an 8-h window around inflation events, with maximum fission rate 6 h after peak inflation. Error bars indicate SEM.
Figure 4.
Figure 4.. Stereotyped SCZ fission dynamics in intestinal organoids
(A) Fission sequence (type I) by tissue buckling and invagination (white arrows) preceding Lgr5+ stem cell differentiation and fragmentation of SCZs (white asterisks). Red, H2B; green: Lgr5. (B) Fission sequence (type II) with fragmentation of contiguous Lgr5+ SCZs preceding tissue buckling. The organoid bud appears inflated until 14 h. (A and B), arrows indicate invagination; asterisks indicate nascent SCZs. Scale bars, 20 μm. (C) Number of nascent SCZs observed following fission from SCZs with inflated and non-inflated morphology. (D) 40×-magnification and 6-min time lapse of organoid buds reveal that Lgr5+ cells differentiate in situ as organoid buds inflate. Scale bar, 40 μm. Dashed lines delineate a group of cells at early and late time points. (E) The in-plane strain of the epithelium at three time points during luminal inflation and collapse. Gray, individual buds (n = 9); black, average. Strain is calculatedas the fractional change in mean inter-nuclear distance. Statistical significance by one-tailed t test. (F and G) Laser ablation of cyst-like organoids grown in the presence of Wnt3A induces collapse, tissue buckling, bud formation, and localization of pre-existing Lgr5+ domains to nascent buds (white arrows). Scale bar, 50 μm. (H) Summary of the model for type II SCZ fission.
Figure 5.
Figure 5.. Organoid inflation causes SCZ fission
(A) Schematic experimental designs to test the effect of sustained inhibition (left) or acute stimulation (right) of ion channels on SCZ growth and fission. (B and C) Representative organoids treated with vehicle (DMSO), CFTRinh-172, or forskolin. Images show maximum-intensity projections; white arrows indicate inflated buds. Scale bars, 50 μm. (D) The fraction of organoids with at least one visibly inflated bud reduces after 36 h and 54 h of ion channel inhibition (left; vehicle, n = 92; ouabain, n = 66; CFTRinh, n = 86; 2 biological replicates per condition) and increases after acute 12-h treatment with forskolin (right; vehicle, n = 90; forskolin, n = 76; 2 biological replicates per condition). (E) The number of fission events per organoid between 36 h and 54 h of ion channel inhibition reduces compared with vehicle control (left), and increases within 12 h of treatment with forskolin (right). Number fission events, mean increase in SCZ number in time interval. Error bars indicate SEM. One-sided t test: *p < 0.05, **p < 0.01, ***p < 0.001.
Figure 6.
Figure 6.. Dissecting epithelial stretch response by scRNA-seq
(A) UMAP representation of scRNA-seq of organoids treated with forskolin, CFTRinh-172, or DMSO (5,241 cells × 29,603 genes), colored by annotated cell type. (B) Fractional change in the abundance of annotated cell types after treatment. Fisher’s exact test after Bonferroni correction: **p < 0.01, ***p < 0.001. (C) Histogram of G2/M scores calculated from cell transcriptomes shows no change in proliferation with CFTRinh-172. (D) The fraction of cells in S phase, assessed by 2-h incubation with EdU, does not change significantly after 36 h of treatment with CFTRinh-172. Ouabain reduces the S phase fraction of Lgr5+ and Lgr5 cells. DMSO, n = 66 organoids; CFTRinh, n = 63 organoids; 3 biological replicates per condition; ouabain, n = 35 organoids, 2 biological replicates). (E) Heatmaps of gene expression in the cluster of stretch-associated cells across different experiments, showing enrichment of multiple genes specific to the state (top) and reduced expression of genes marking canonical cell types of the epithelium (remaining maps). Experiments: CFTRinh-172-treated (C), DMSO-treated (D), and forskolin-treated (F). (F) Select mean transcript abundances. Error bars indicate SEM. (G) Representative images of fixed organoids stained for Anxa1 and Basp1. (H) Fraction of cells scored as Basp1 high in fixed and stained organoids after 12-h treatment with DMSO (n = 1,811 Basp1-low cells; n = 43 Basp1-high cells) or forskolin (n = 790 Basp1-low cells; n = 97 Basp1-high cells). Error bar indicates SEM. (I) False discovery rate (FDR)-corrected p values from gene set enrichment analysis, comparing stretch-associated marker genes with gene sets enriched in cell states observed in other studies.
Figure 7.
Figure 7.. Piezo channel activity is necessary for inflation-mediated fission
(A) Experimental design for imaging intracellular calcium dynamics after stimulating or inhibiting luminal inflation or Piezo channel activity. (B) Top: the calcium dye CA-630 shows increased intensity in the epithelium surrounding an inflated (inf.) bud compared with a collapsed (coll.) bud. Bottom: after forskolin treatment, the previously coll. bud (marked by an asterisk) shows increased CA-630 intensity. (C) Representative images of calcium imaging under perturbation. (D) Quantification of mean CA-630 dye intensity under different conditions. F, C, G/F as defined in (C) (n = 29 no-drug controls, n = 64 no-dye controls, n = 29 forskolin-treated organoids, n = 31 CFTRinh-172-treated organoids, n = 33 GdCl3 + forskolin-treated organoids; 2 biological replicates per condition). Error bars indicate SEM. One-sided t test: *p < 0.05, **p < 0.01, ***p < 0.001. (E) Experimental designs to quantify SCZ fission after sustained inhibition or acute activation of Piezo ion channels. (F) Channel inhibition significantly reduces the number of fission events per organoid compared with vehicle control (n = 70 organoids in DMSO across 6 replicates, n = 34 in GdCl3 across 3 replicates, n = 24 in GsMTx4 across 3 replicates). (G) Treatment with the Piezo agonist Yoda1 does not significantly alter fission frequencies (n = 61 in DMSO across 6 replicates, n = 38 in Yoda1 across 6 replicates). (H) Piezo channel inhibition weakly suppresses inflation. Data are from same organoids as in (F). (I) Experimental design to test for epistasis between inflation and Piezo channel activity on SCZ fission rates. (J) and K) Dual treatment with the Piezo channel inhibitor GdCl3 and the CFTR agonist forskolin (G+F) increases organoid inflation, but the SCZ fission rate is reduced, consistent with Piezo channel activity acting downstream of inflation to mediate SCZ fission. Experiments were carried out separately from those in (E)–(H), using smaller organoid fragments that exhibited lower inflation and fission rates (n = 59 organoids in DMSO, n = 53 in GdCl3 + forskolin, 6 replicates each).

Comment in

References

    1. Ayyaz A, Kumar S, Sangiorgi B, Ghoshal B, Gosio J, Ouladan S, Fink M, Barutcu S, Trcka D, Shen J, et al. (2019). Single-cell transcriptomes of the regenerating intestine reveal a revival stem cell. Nature 569, 121–125. - PubMed
    1. Bagriantsev SN, Gracheva EO, and Gallagher PG (2014). Piezo proteins: regulators of mechanosensation and other cellular processes. J. Biol. Chem 289, 31673–31681. - PMC - PubMed
    1. Baker AM, Cereser B, Melton S, Fletcher AG, Rodriguez-Justo M, Tadrous PJ, Humphries A, Elia G, McDonald SA, Wright NA, et al. (2014). Quantification of crypt and stem cell evolution in the normal and neoplastic human colon. Cell Rep. 8, 940–947. - PMC - PubMed
    1. Barker N (2014). Adult intestinal stem cells: critical drivers of epithelial homeostasis and regeneration. Nat. Rev. Mol. Cell Biol 15, 19–33. - PubMed
    1. Barker N, van Es JH, Kuipers J, Kujala P, van den Born M, Cozijnsen M, Haegebarth A, Korving J, Begthel H, Peters PJ, and Clevers H (2007). Identification of stem cells in small intestine and colon by marker gene Lgr5. Nature 449, 1003–1007. - PubMed

Publication types