. 2021 May 13;184(10):2779-2792.e18.
doi: 10.1016/j.cell.2021.03.043. Epub 2021 Apr 28.

Psychedelic-inspired drug discovery using an engineered biosensor

Affiliations

Psychedelic-inspired drug discovery using an engineered biosensor

Chunyang Dong et al. Cell. .

Abstract

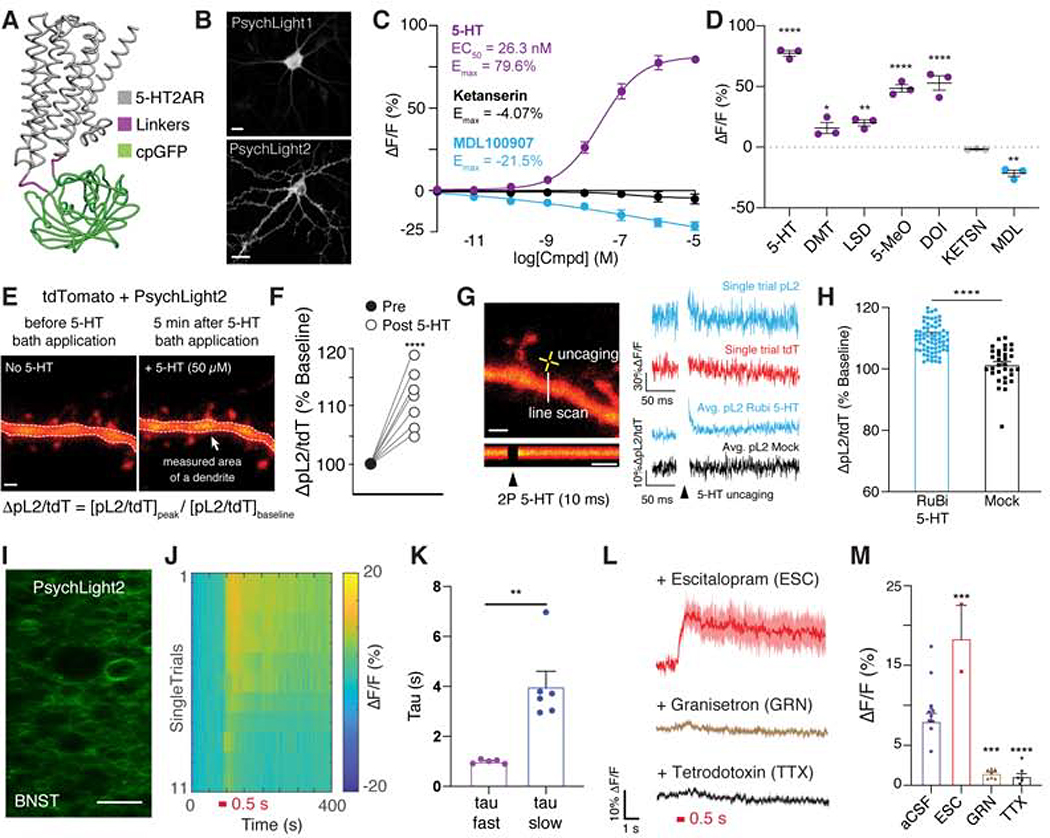
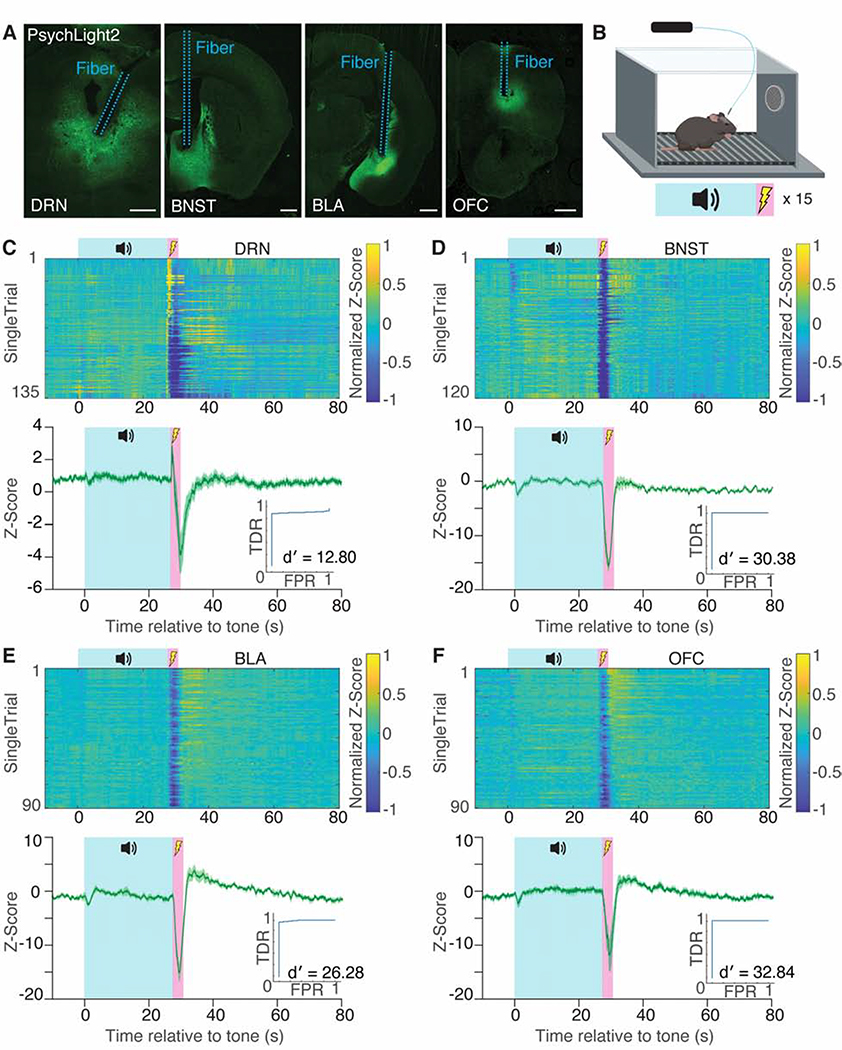
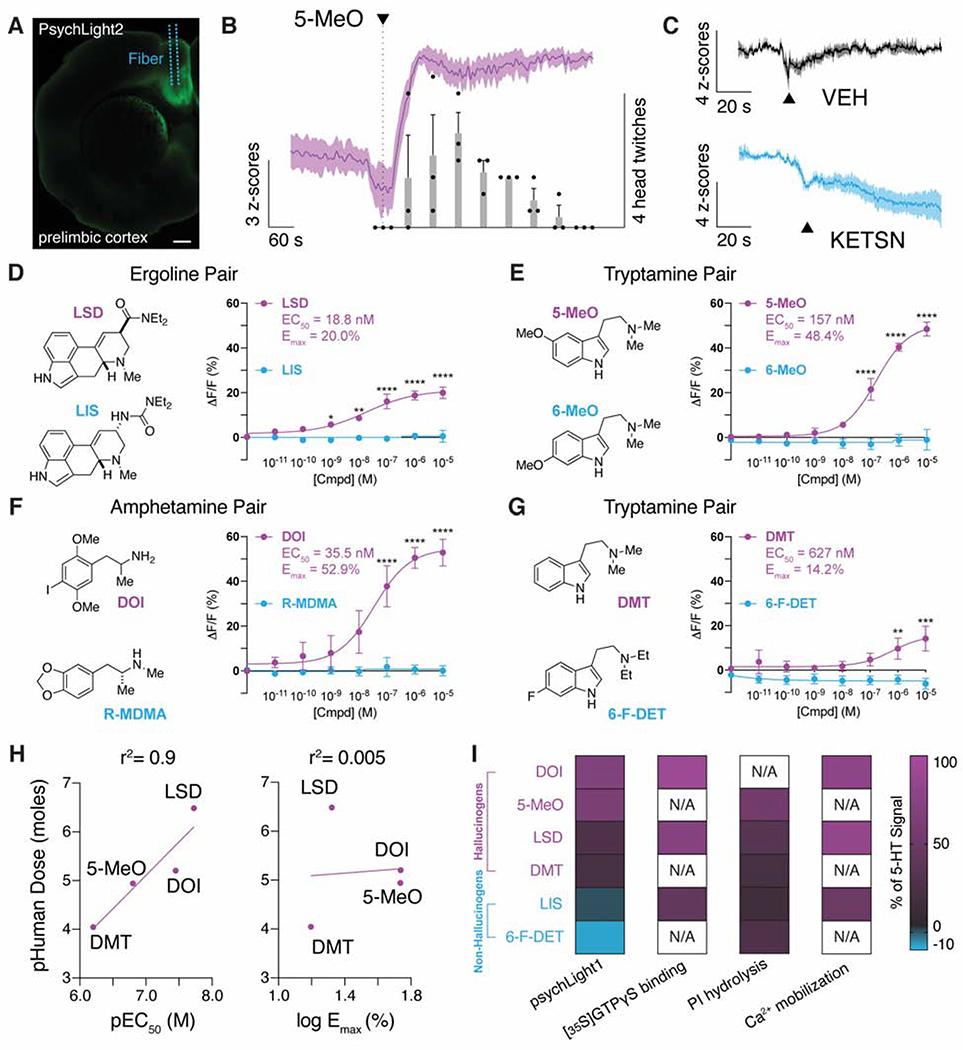
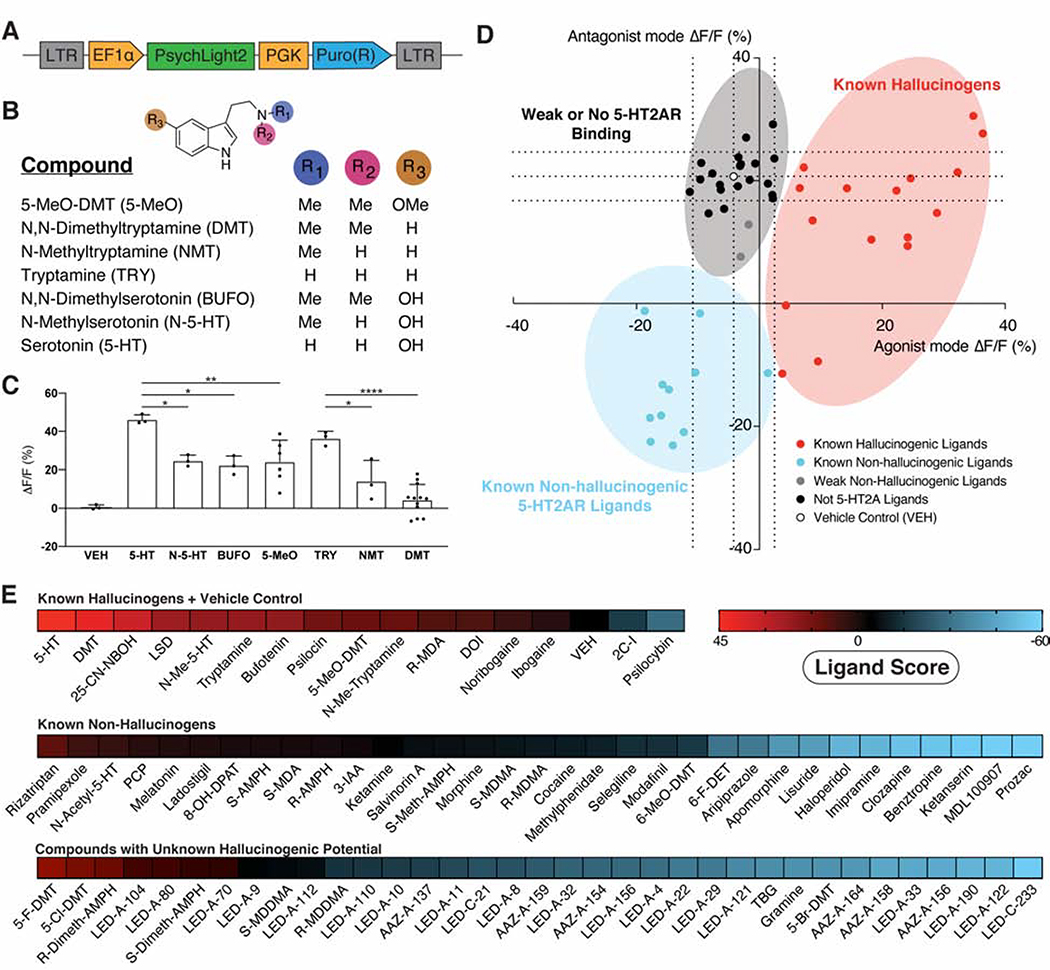
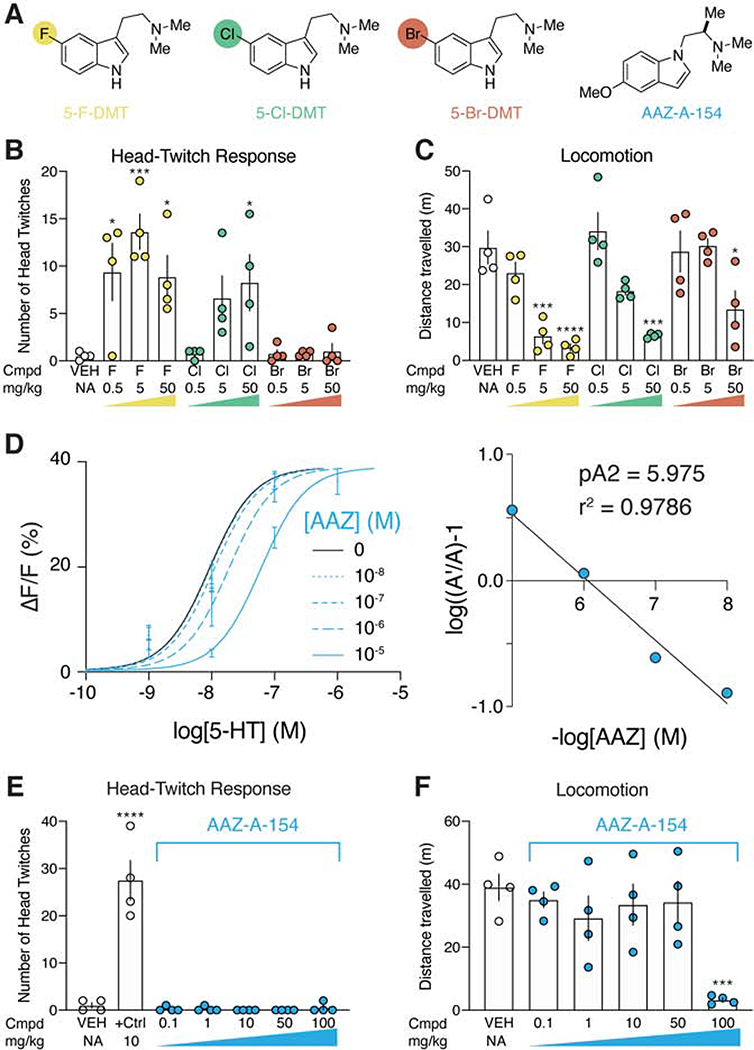
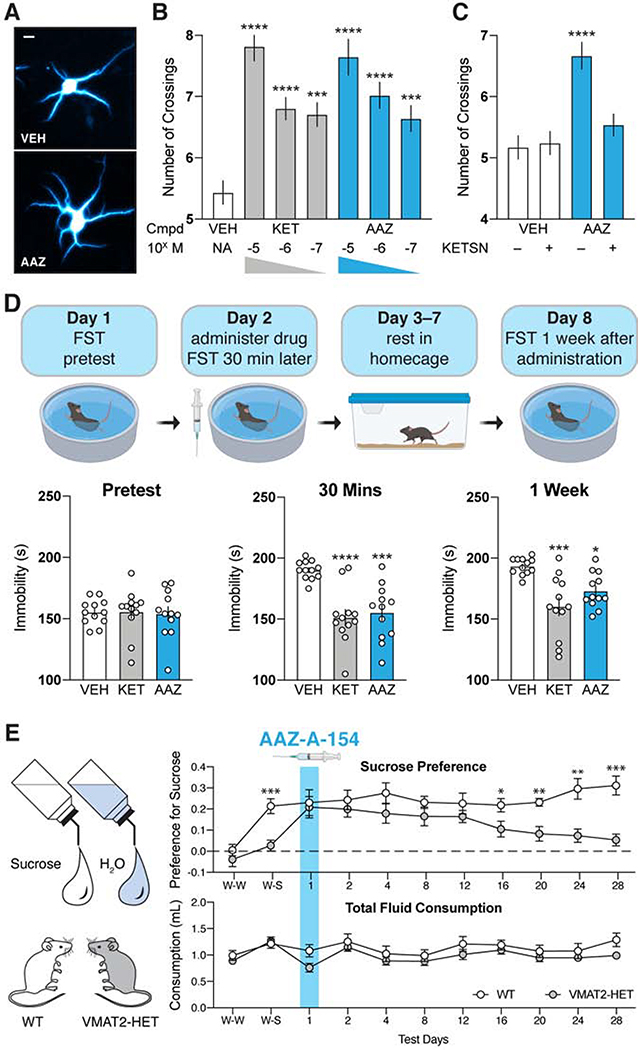
Ligands can induce G protein-coupled receptors (GPCRs) to adopt a myriad of conformations, many of which play critical roles in determining the activation of specific signaling cascades associated with distinct functional and behavioral consequences. For example, the 5-hydroxytryptamine 2A receptor (5-HT2AR) is the target of classic hallucinogens, atypical antipsychotics, and psychoplastogens. However, currently available methods are inadequate for directly assessing 5-HT2AR conformation both in vitro and in vivo. Here, we developed psychLight, a genetically encoded fluorescent sensor based on the 5-HT2AR structure. PsychLight detects behaviorally relevant serotonin release and correctly predicts the hallucinogenic behavioral effects of structurally similar 5-HT2AR ligands. We further used psychLight to identify a non-hallucinogenic psychedelic analog, which produced rapid-onset and long-lasting antidepressant-like effects after a single administration. The advent of psychLight will enable in vivo detection of serotonin dynamics, early identification of designer drugs of abuse, and the development of 5-HT2AR-dependent non-hallucinogenic therapeutics.

Keywords: depression; genetically encoded indicators; hallucinogen; psychedelic; serotonin; serotonin receptors.


Conflict of interest statement

Declaration of interests D.E.O. is a co-founder of Delix Therapeutics. L.T. is a co-founder of Seven Biosciences. C.L. was a part-time employee of Seven Biosciences. Delix Therapeutics and Seven Biosciences have licensed technology from the University of California, Davis related to this manuscript. All other authors declare no competing interests.

Figures

Figure 1.
Figure 1.. Development of a fluorescent sensor based on the 5-HT2A receptor
A. Simulated structure of psychLight consisting of 5-HT2AR (gray), a linker (magenta) and a cpGFP (green). B. Representative images of cultured dissociated hippocampal neurons transiently expressing psychLightl and psychLight2. Scale bar: 20 μm. C. PsychLightl-expressing HEK293T cells respond to ligands in a concentration-dependent manner. D. PsychLightl is activated by hallucinogenic 5-HT2A ligands, but not non-hallucinogenic compounds when treated at 10 μM. ****p<0.0001, **p<0.01 and *p<0.05, one-way ANOVA compared to KETSN with Dunnett’s test. E–F. Two-photon imaging of cultured cortical slices expressing psychLight2 (pL2) following bath application of 5-HT. E. Representative images of a dendrite expressing psychLight2 (pL2) and tdTomato (tdT) before and after bath application of 50 μM 5-HT (imaged at 920nm). F. Fluorescence intensity changes in pL2 were normalized to the tdT signal, [ΔpL2/tdT = 111.1 ± 1.8%, n = 7 region of interests (ROIs) from 4 cells; ****P<0.0001, unpaired t-test]. Scale bar: 1 μm. G–H. Two-photon 5-HT uncaging evoked psychLight responses. G. Representative apical dendrites imaged during two-photon uncaging of serotonin. Representative single-trial traces of fluorescent intensity changes (ΔF/F%) of pL2 and tdT are shown in response to single pulse uncaging (10 ms). Averaged traces of ΔpL2/tdT in response to uncaging of Rubi-5HT (bottom) and without were shown. Scale bars: 1 μm. H. Characterization of peak response of green to red ratio (ΔpL2/tdT) normalized to the baseline for pL2 in response to single-pulse uncaging with and without RuBi–5-HT (ΔpL2/tdT = 111.2 ± 0.7%, n = 76 ROIs from 11 cells (Rubi-5-HT); 101.3 ± 1.0% n = 32 ROIs from 6 cells (mock 2P)), ****P<0.0001, unpaired t-test. I–K. Two-photon imaging of endogenous 5-HT release triggered by electrical stimuli in acute slices. I. A representative two-photon image of BNST acute slice expressing psychLight2. Scale bar: 50 μm. J. Single-trial response of psychLight2 to electrical stimuli (0.5 s, 4 V, 40 Hz, 20 pulses). K. The averaged off-kinetics of two groups of ROIs exhibiting fast and slow off rates. (40 pulses: Taufast = 0.997 ± 0.0376 s, n = 5 trials; Taustow = 3.998 ± 0.6103 s, n = 6 trails), **P < 0.01, unpaired t-test. L. Averaged-trial traces of psychLight2 in response to electrical stimuli in the presence of escitalopram (ESC, 50 μM), granisetron (GRN,10 μM), and tetrodotoxin (TTX,1 μM). Shaded area represents S.E.M. M. Peak fluorescence changes in the absence (aCSF, n = 11 trials from 3 mice) and presence of compounds (ESC, n = 2 trials from 3 mice, ***P=0.0002; GRN, n = 8 trials from 3 mice, ****P<0.0001; TTX n = 9 trails from 3 mice, 40 pulses, one-way ANOVA compared to aCSF with Sidak’s test). Data are represented by mean ± S.E.M. See also Supplementary Fig. 1 and 2A–D.
Figure 2.
Figure 2.. PsychLight enables the detection of endogenous serotonin dynamics during fear conditioning using fiber photometry.
A. Expression of psychLight2 in the DRN, BNST, BLA and OFC near the location of fiber implantation. Scale bars: 500 μm B. Schematic illustrating the design of auditory fear conditioning experiments (30 s tone co-terminating with a 1.5 s foot shock, n = 15 presentations). C–F. Single-trial heatmap and averaged-trial traces of serotonin dynamics in DRN (C, n = 135 trials from 9 animals), BNST (D, n = 120 trials from 8 animals), BLA (E, n = 90 trials from 6 animals), and OFC (F, n = 90 trials from 6 animals) in response to a tone (blue) and foot shock (pink). ROC plots indicate true detection rate (TDR) against false positive rate (FPR), and d′ is calculated by avg(z-scoreshock)/std(z-scorebaseyne). Average traces indicated by solid lines; shaded area represents S.E.M. DRN = dorsal raphe nucleus; BNST = bed nucleus of the stria terminalis; BLA = basolateral amygdala; OFC = orbitofrontal cortex. See also Supplementary Fig. 2E–F.
Figure 3.
Figure 3.. PsychLight is activated by hallucinogenic drugs in vivo and in vitro.
A–C. PsychLight2 in vivo responses to drugs as measured by fiber photometry. A. Expression of psychLight2 in the prelimbic cortex near the site of fiber implantation. Scale bar: 500 μm. B. Averaged-trial traces of psychLight2 responses shown as z-score following injection of 50 mg/kg 5-MeO (magenta, i.p.). The number of head-twitch responses (bars) were also recorded and binned into 1-min intervals (n = 3 animals). C. Averaged-trial traces of psychLight2 responses following the injection either of the saline (VEH; top black) or an antagonist (4 mg/kg KETSN, bottom blue, i.p.) (n = 3 animals). Average traces indicated by solid lines; shaded area represents S.E.M. D–G. Concentration-response studies using HEK293T cells transiently expressing psychLight1. Hallucinogens of the ergoline, tryptamine, and amphetamine classes of psychedelics (magenta) were tested along with their non-hallucinogenic congeners (blue). Hallucinogens activated psychLight1 while their non-hallucinogenic congeners did not. n = 3 cells from 3 different cell passages; Error bars represent S.E.M., *P<0.05, **P<0.01, ***P<0.001, ****P<0.0001, compared to the non-psychedelic drug, two-way ANOVA. H. PsychLightl EC50 values, but not Emax values, correlate with hallucinogen potencies in humans. I. PsychLightl Emax values differentiate hallucinogens and non-hallucinogens, but other measures of 5-HT2AR activation (e.g., phosphoinositide (PI) hydrolysis, Ca2+ mobilization, [35S]GTPγS binding) do not. Data represented by the heatmap with a double color gradient from values above 0 (magenta to black) and data below 0 (black to blue). Data are normalized to 5-HT values within each experiment. Data for PI hydrolysis, Ca2+ mobilization, and [35S]GTPγS binding were obtained from previous reports (Cussac et al., 2008; Rabin et al., 2002). PI hydrolysis data for 6-F-DET were estimated based on graphical data presented in Rabin, et al. 2002. N/A indicates that the data are not available. See also Supplementary Fig. 3A–B.
Figure 4.
Figure 4.. Development of a medium-throughput psychLight-based pharmacological assay.
A. A lentivirus expressing psychLight2 under the EF1α promoter was used to engineer a HEK293T cell line stably expressing psychLight2 (PSYLI2, see Methods for details). B–C. Structure-function studies using a variety of structurally related tryptamines. B. Structures of compounds. C. PSYLI2 fluorescence in response to compound treatments (10 μM). Data are represented by mean ± S.E.M, ****p<0.0001, **p<0.01 and *p<0.05, one-way ANOVA multiple comparison with Tukey’s test. D. A series of hallucinogenic and non-hallucinogenic compounds with known 5-HT2AR affinities were tested in agonist (abscissa) and antagonist (ordinate) modes. Dotted lines represent 1 standard deviation from the VEH control (white). Hallucinogenic and non-hallucinogenic 5-HT2AR ligands are shown in red and blue, respectively. Compounds with weak affinity for the 5-HT2AR (~1–10 μM) are shown in gray, while compounds that are known to not bind to the 5-HT2AR are shown in black. Dots indicate averaged ΔF/F values (n = 3 replicates from 3 passages of cells). E. Heat map of ligand scores (see Methods for details). Ligand scores greater than 0 indicate compounds more likely to be hallucinogenic while scores less than 0 indicate compounds that are more likely to be non-hallucinogenic ligands of the 5-HT2AR. See also Supplementary Fig. 3C–D, Supplementary Fig. 4, 5 and 6A–D.
Figure 5.
Figure 5.. PsychLight accurately predicts hallucinogenic potentials of previously untested compounds.
A. Structures of 5-halo-DMT derivatives and AAZ-A-154. Colored circles indicate the relative size of the halogen atom compared to each other. B. Both 5-F-DMT and 5-Cl-DMT produce positive ligand scores and induce head-twitches in mice. In contract, 5-Br-DMT produces a negative ligand score and does not induce a HTR (n = 4 mice). C. All 5-halo-DMTs produce dose-dependent decreases in locomotion (n= 4 mice). D. Schild regression analysis reveals that AAZ-A-154 is a psychLight competitive antagonist (n = 3 replicates from 1 passage of cells). E. AAZ-A-154 does not trigger a HTR at any dose compared to that triggered by 5-MeO-DMT (n= 4 mice). F. AAZ-A-154 only decreases locomotion at a very high dose (100 mg/kg) (n = 4 mice). Data are represented as mean ± SEM. ****p<0.0001, ***p<0.001, and *p<0.05, vs. the vehicle control, one-way ANOVA with Dunnett’s test. See also Supplementary Fig. 6E.
Figure 6.
Figure 6.. A predicted non-hallucinogenic compound with antidepressant potential.
A. Representative images demonstrating that AAZ-A-154 promotes dendritic branching. Scale bar: 20 μm B. Maximal number of crossings (Nmax) from Sholl plots (n = 51–60 neurons). ****p<0.0001, ***p<0.001, one-way ANOVA with Dunnett’s test. C. The effects of AAZ (100 nM) on dendritic growth can be blocked by the 5-HT2R antagonist ketanserin (KETSN, 1 μM, n= 39–58 neurons). ****p<0.0001, one-way ANOVA with Dunnett’s test. D. Schematic depicting the forced swim test design. AAZ-A-154 (20 mg/kg) produces fast (30 min) and long-lasting (1 week) antidepressant-like effects in the FST comparable to ketamine (KET) (n= 12). ****p<0.0001, ***p<0.001, and *p<0.05, one-way ANOVA with Dunnett’s test. E. Sucrose preference test reveals that AAZ (15 mg/kg) reduces anhedonia in VMAT2-HET mice for at least 12 days. Water-water pairing = W-W, water-sucrose (1%) pairing = W-S. When given the choice between water and a 1% sucrose solution (W-S), only WT mice displayed a sucrose preference. Total fluid consumption was not different between genotypes at any time point. N = 11 mice/genotype; data are represented as means and SEMs, **p<0.01 and *p<0.05, WT vs. VMAT2-HET, repeated measures ANOVA with Bonferroni corrected pair-wise comparisons.

References

    1. Aghajanian GK, and Marek GJ (1999). Serotonin and Hallucinogens. Neuropsychopharmacology 21, 16–23. - PubMed
    1. Benes H, Deissler A, Rodenbeck A, Engfer A, and Kohnen R (2006). Lisuride treatment of restless legs syndrome: first studies with monotherapy in de novo patients and in combination with levodopa in advanced disease. J Neural Transm (Vienna) 113, 87–92. - PubMed
    1. Berg KA, Maayani S, Goldfarb J, Scaramellini C, Leff P, and Clarke WP (1998). Effector pathway-dependent relative efficacy at serotonin type 2A and 2C receptors: evidence for agonist-directed trafficking of receptor stimulus. Mol Pharmacol 54, 94–104. - PubMed
    1. Blair JB, Kurrasch-Orbaugh D, Marona-Lewicka D, Cumbay MG, Watts VJ, Barker EL, and Nichols DE (2000). Effect of ring fluorination on the pharmacology of hallucinogenic tryptamines. J Med Chem 43, 4701–4710. - PubMed
    1. Broussard GJ, Unger EK, Liang R, McGrew BP, and Tian L (2018). Imaging Glutamate with Genetically Encoded Fluorescent Sensors. In Biochemical Approaches for Glutamatergic Neurotransmission, Parrot S, and Denoroy L, eds. (New York, NY: Springer New York; ), pp. 117–153.

Publication types

MeSH terms