. 2021 Jun 8;54(6):1186-1199.e7.
doi: 10.1016/j.immuni.2021.04.002. Epub 2021 Apr 28.

Notch4 signaling limits regulatory T-cell-mediated tissue repair and promotes severe lung inflammation in viral infections

Affiliations

Notch4 signaling limits regulatory T-cell-mediated tissue repair and promotes severe lung inflammation in viral infections

Hani Harb et al. Immunity. .

Abstract

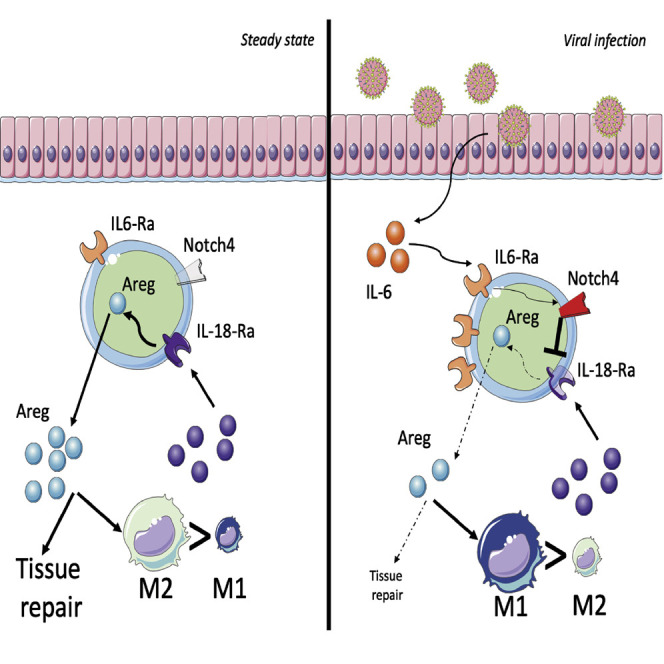
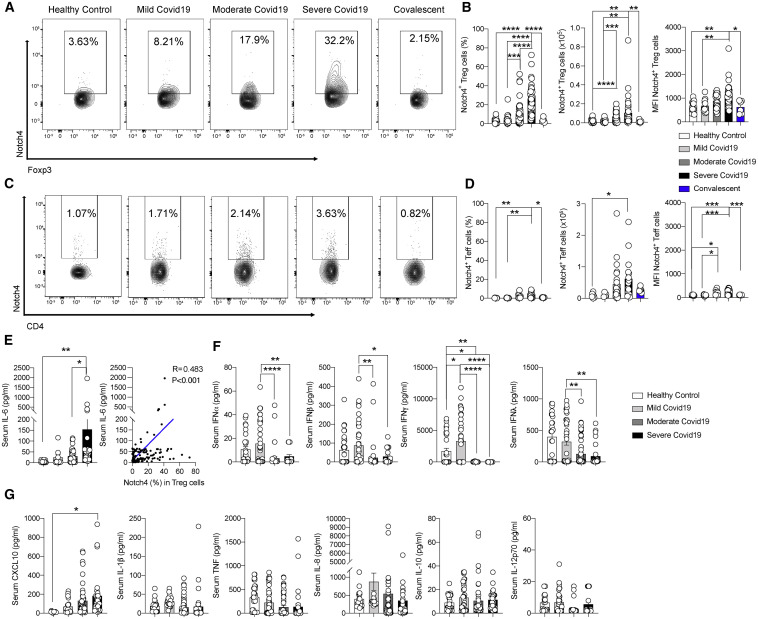
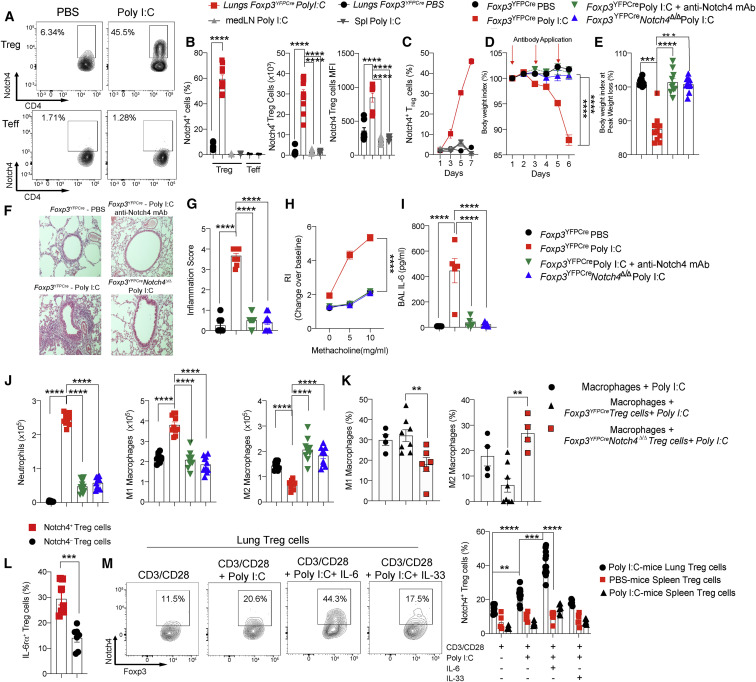
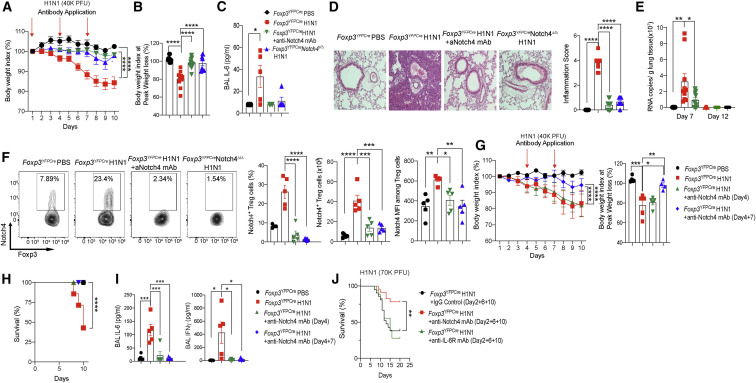
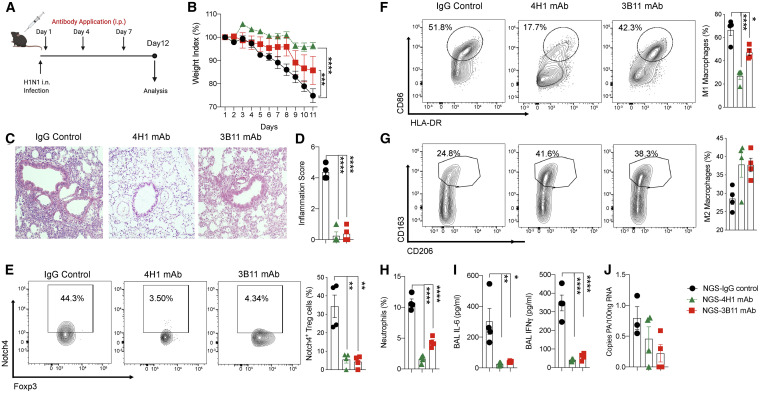
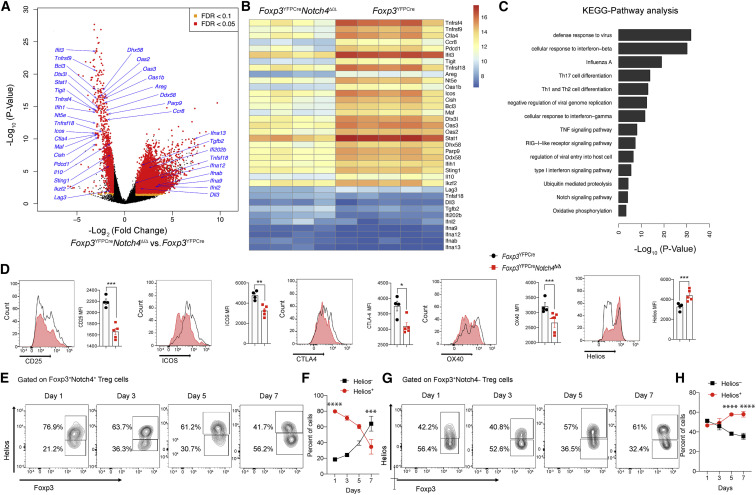
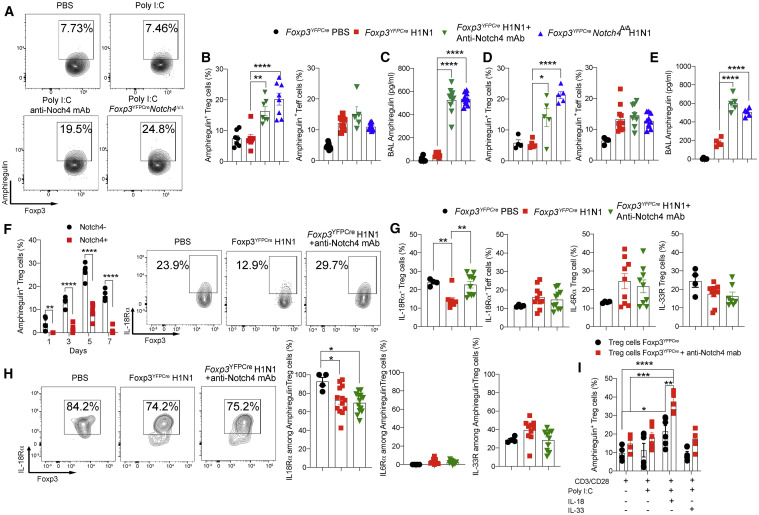
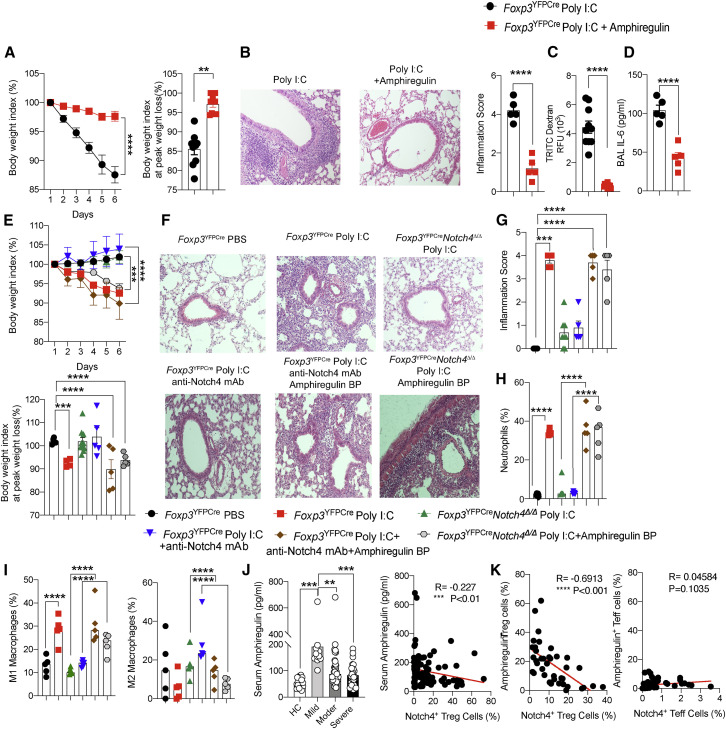
A cardinal feature of COVID-19 is lung inflammation and respiratory failure. In a prospective multi-country cohort of COVID-19 patients, we found that increased Notch4 expression on circulating regulatory T (Treg) cells was associated with disease severity, predicted mortality, and declined upon recovery. Deletion of Notch4 in Treg cells or therapy with anti-Notch4 antibodies in conventional and humanized mice normalized the dysregulated innate immunity and rescued disease morbidity and mortality induced by a synthetic analog of viral RNA or by influenza H1N1 virus. Mechanistically, Notch4 suppressed the induction by interleukin-18 of amphiregulin, a cytokine necessary for tissue repair. Protection by Notch4 inhibition was recapitulated by therapy with Amphiregulin and, reciprocally, abrogated by its antagonism. Amphiregulin declined in COVID-19 subjects as a function of disease severity and Notch4 expression. Thus, Notch4 expression on Treg cells dynamically restrains amphiregulin-dependent tissue repair to promote severe lung inflammation, with therapeutic implications for COVID-19 and related infections.

Keywords: COVID-19; IL-18; IL-6; Notch4; SARS-CoV-2; amphiregulin; influenza; regulatory T cells.


Conflict of interest statement

Declaration of interests T.A.C., H.H., M.B., P.S.L., P.C., and R.D.P. are inventors on provisional patent application US 63/038,186 titled “Methods and Compositions for treating coronavirus infectious disease.” H.H. and T.A.C. are co-founders of and hold equity in Alcea Therapeutics.

Figures

None
Graphical abstract
Figure 1
Figure 1
Increased expression of Notch4 on circulating Treg cells of subjects with COVID-19 (A–D) Flow cytometry analysis, cell frequencies, absolute numbers, and MFI of Notch4 expression in Treg cells (A and B) and Teff cells (C and D) of control subjects and subjects with mild, moderate, severe, or resolved COVID-19 (healthy control subjects, n = 37; mild disease, n = 20; moderate disease, n = 54; severe disease, n = 36; convalescent subjects, n = 6). (E) Serum concentrations of IL-6 in the different subject groups (healthy control subjects, n = 37; mild disease, n = 18; moderate disease, n = 45; severe disease, n = 21). (F) Correlation analysis of Notch4 expression on Treg cells of affected and control subjects as a function of serum IL-6 concentrations (n = 121). (G) Serum concentrations of IFNα, IFNβ, IFNγ IFNλ, CXCL10, IL-1β, IL-8, IL-10, IL-12, and TNF in control and affected subjects (healthy control subjects, n = 37; mild disease, n = 18; moderate disease, n = 45; severe disease, n = 21). Each symbol represents one subject. Numbers in flow plots indicate percentages. Error bars indicate SEM. Statistical tests: p < 0.05, ∗∗p < 0.01, ∗∗∗∗p < 0.0001 by one-way ANOVA with Dunnett’s post hoc analysis (A–E and G) and Pearson correlation analysis (D). Data represent a pool of two or three independent experiments.
Figure 2
Figure 2
Protective effect of Notch4 inhibition in poly(I:C)-induced lung injury (A and B) Flow cytometry analysis (A) and cell frequencies, absolute numbers, and MFI (B) of Notch4 expression in lung, mediastinal lymph node (medLN), and spleen Treg and Teff cells of Foxp3YFPCre mice treated with PBS or poly(I:C) once daily for 6 days. (C) Notch4 expression on lung, medLN, and spleen Treg cells of Foxp3YFPCre mice. (D and E) Weight index (D) and peak weight loss (E) of Foxp3YFPCre and Foxp3YFPCreNotch4Δ/Δ mice treated with PBS or poly(I:C) together with an isotype control or anti-Notch4 mAb. (F) Hematoxylin and eosin-stained sections of lung tissues (200× magnification). (G) Inflammation scores. (H) AHR in response to methacholine. RI, responsiveness index (a measure of airway resistance). (I and J) BAL fluid IL-6 concentrations (I) and graphical representation of lung tissue neutrophils and M1 and M2 macrophages. (K) M1 and M2 macrophage frequencies in cultures of poly(I:C)-treated lung macrophages incubated with Treg cells from the indicated poly(I:C)-treated mice. (L) Flow cytometry analysis of IL-6Rα expression in lung Notch4+ or Nottch4 Treg cells of Foxp3YFPCre mice treated with poly(I:C). (M) In vitro induction of Notch4 expression in Treg cells from the lungs or spleens of poly(I:C) or PBS-treated Foxp3YFPCre mice. Each symbol represents one mouse (n = 5–15 per group). Numbers in flow plots indicate percentages. Error bars indicate SEM. Statistical tests: Student’s t test (B), one-way ANOVA with Dunnett’s post hoc analysis (E, G, and I–K), and two-way ANOVA with Sidak’s post hoc analysis (C, D, H, and L). ∗∗∗p < 0.001, ∗∗∗∗p < 0.0001. Data were pooled from two or three independent experiments.
Figure 3
Figure 3
Protective effect of Notch4 inhibition in influenza A H1N1 virus infection (A and B) Weight index (A) and peak weight loss (B) of Foxp3YFPCre and Foxp3YFPCreNotch4Δ/Δ mice that were sham treated or infected with a 40,000-PFU dose of H1N1 virus alone or together with an anti-Notch4 mAb, as indicated. Arrows indicate the time of antibody treatment. (C) BAL fluid IL-6 concentrations in the indicated groups. (D) Hematoxylin and eosin-stained sections and inflammation score of lung tissue isolated from the indicated mouse groups (200× magnification). (E) Viral load (viral copies per gram of tissue) in the respective mouse groups (n = 5 per group). (F) Flow cytometry analysis and graphical representation of Notch4 expression in lung tissue Treg cells of the respective Foxp3YFPCre and Foxp3YFPCreNotch4Δ/Δ mouse groups. (G and H) Weight index and peak weight loss (G) and survival (H) of Foxp3YFPCre mice that were sham treated or infected with a 40,000-PFU dose of H1N1 virus alone or together with an anti-Notch4 mAb, as indicated. Arrows indicate the time of antibody treatment. (I) BAL fluid IL-6 and IFNγ concentrations. (J) Survival curve of Foxp3YFPCre mice that were sham treated or infected with a lethal dose of H1N1 virus alone or together with an anti-Notch4 or anti-IL-6Rα mAb, as indicated. Each symbol represents one mouse (n = 5–23). Numbers in flow plots indicate percentages. Error bars indicate SEM. Statistical tests: one-way ANOVA with Dunnett’s post hoc analysis (B, C, F, I, and J) and two-way ANOVA with Sidak’s post hoc analysis (A, D, E, G, and K). p < 0.05, ∗∗∗p < 0.001, ∗∗∗∗p < 0.0001. Data were pooled from two or three independent experiments.
Figure 4
Figure 4
Notch4 licenses viral lung inflammation in humanized mice (A) Schematic of humanized mouse infection with H1N1 influenza virus and treatment with neutralizing anti-human Notch4 mAbs. (B) Weight index of mice that were infected with a sublethal dose of H1N1 virus and treated with an isotype control mAb or anti-Notch4 mAb 3B11 or 4H1, as indicated. (C and D) Hematoxylin and eosin-stained sections and inflammation score of lung tissue isolated from the indicated mouse groups (200× magnification). (E) Flow cytometry analysis and frequencies of Notch4 expression in lung Treg cells of the respective groups. (F and G) Flow cytometry analysis and graphical representation of lung tissue M1 (F) and M2 macrophages (G). (H) Neutrophil infiltration in the lungs of the respective mouse groups. (I) BAL fluid IL-6 and IFNγ concentrations. (J) Viral load in the respective mouse groups, measured as viral copies per 100 ng lung tissue RNA. Each symbol represents one mouse (n = 4–5 per group). Numbers in flow plots indicate percentages. Error bars indicate SEM. Statistical tests: two-way ANOVA with Sidak’s post hoc analysis (B) and one-way ANOVA with Dunnett’s post hoc analysis (D–J). p < 0.05, ∗∗p < 0.01, ∗∗∗∗p < 0.0001.
Figure 5
Figure 5
Notch4 deficiency reprograms the lung Treg cell transcriptome of poly(I:C)-treated mice (A–C) Volcano plot (A), heatmap (B), and pathway analysis (C) of gene transcripts of lung Treg cells isolated from Foxp3YFPCre and Foxp3YFPCreNotch4Δ/Δ mice treated with poly(I:C) (n = 4 and n = 5, respectively). (D) Flow cytometry histograms and graphical representation of lung tissue Treg cell expression of CD25, Helios, CTLA4, ICOS, and OX40 in Foxp3YFPCre and Foxp3YFPCreNotch4Δ/Δ mice sampled on day 7 after poly(I:C) treatment (n = 5 for each time point). (E–H) Flow cytometry analysis (E and G) and graphical representation (F and H) of Helios expression in Foxp3+Notch4+ and Foxp3+Notch4 lung tissue Treg cells in Foxp3YFPCre mice sampled at the indicated dates after poly(I:C) treatment (n = 5 for each time point). Each symbol represents one mouse. Numbers in flow plots indicate percentages. Error bars indicate SEM. Statistical tests: pairwise comparisons of differential gene expression were computed using DESeq2 (A–C); Student’s unpaired two-tailed t test (D) and two-way ANOVA with Sidak’s post hoc analysis (F and H). p < 0.05, ∗∗p < 0.01, ∗∗∗p < 0.001, ∗∗∗∗p < 0.0001.
Figure 6
Figure 6
Notch4 inhibition promotes an amphiregulin-dependent immunoregulatory program (A) Flow cytometry analysis of amphiregulin expression in Treg cells from the lungs of Foxp3YFPCre and Foxp3YFPCreNotch4Δ/Δ mice sham treated or treated with poly(I:C) alone or together with an anti-Notch4 mAb, as indicated. (B) Graphical representation of amphiregulin expression in lung tissue Treg and Teff cells. (C) BAL fluid amphiregulin concentrations. (D) Amphiregulin expression in lung tissue Treg and Teff cells of Foxp3YFPCre and Foxp3YFPCreNotch4Δ/Δ mice sham treated or infected with H1N1 influenza virus alone or together with an anti-Notch4 mAb, as indicated. (E) BAL fluid amphiregulin concentrations. (F) Flow cytometric analysis and graphical representation of amphiregulin expression in Notch4+ or Notch4 Treg cells from the lungs of Foxp3YFPCre mice treated with PBS or poly(I:C) at the indicated time points. (G and H) Flow cytometry analysis and graphical representation of IL18Rα, IL6Rα, and ST2 expression in total (G) or amphiregulin+ (H) Treg cells from the lungs of PBS- or poly(I:C)-treated Foxp3YFPCre mice with an isotype control or an anti-Notch4 mAb, as indicated. (I) In vitro induction of amphiregulin expression in Treg cell from the lungs or spleens of poly(I:C)- or PBS-treated Foxp3YFPCre mice. Each symbol represents one mouse (n = 5–8 per group). Numbers in flow plots indicate percentages. Error bars indicate SEM. Statistical tests: one-way ANOVA with Dunnett’s post hoc analysis (B–D, F, and G) and two-way ANOVA with Sidak’s post hoc analysis (E and H). p < 0.05, ∗∗p < 0.01, ∗∗∗p < 0.001, ∗∗∗∗p < 0.0001.
Figure 7
Figure 7
Lung protection by Notch4 antagonism is amphiregulin dependent (A) Weight index and peak weight loss of Foxp3YFPCre mice sham treated or treated with poly(I:C) alone or together with recombinant amphiregulin. (B) Hematoxylin and eosin-stained sections and inflammation score of lung tissue isolated from the indicated mouse groups (200× magnification. (C) Serum TRITC dextran in poly(I:C) + recombinant amphiregulin-treated Foxp3YFPCre mice 1 h after intratracheal instillation. (D) BAL fluid concentration of IL-6. (E) Weight index and peak weight loss of Foxp3YFPCre and Foxp3YFPCreNotch4Δ/Δ mice sham treated or treated with poly(I:C), anti-Notch4 mAb, and/or amphiregulin-blocking peptide (bp), as indicated. (F) Hematoxylin and eosin-stained lung sections (200× magnification). (G) Inflammation scores (n = 5 per group). (H and I) Lung neutrophils (H) and M1 and M2 macrophages (I). (J) Left panel: serum amphiregulin concentrations in healthy control subjects and COVID-19 subject groups (control subjects, n = 17; mild disease, n = 20; moderate disease, n = 49; severe disease, n = 32). Right panel: Pearson correlation of Treg cell Notch4 expression and serum amphiregulin concentration in affected and control subjects (n = 99). (K) Pearson correlation of Notch4 and amphiregulin expression in Treg cells (right panel) and Teff cells (left panel) of individuals with COVID-19 (n = 39). Each symbol represents one mouse (n = 5–10 per group). Numbers in flow plots indicate percentages. Error bars indicate SEM. Statistical tests: one-way ANOVA with Dunnett’s post hoc analysis (B–E and G–J) and two-way ANOVA with Sidak’s post hoc analysis (A and E). ∗∗p < 0.01, ∗∗∗p < 0.001, ∗∗∗∗p < 0.0001.

References

    1. Arpaia N., Green J.A., Moltedo B., Arvey A., Hemmers S., Yuan S., Treuting P.M., Rudensky A.Y. A Distinct Function of Regulatory T Cells in Tissue Protection. Cell. 2015;162:1078–1089. - PMC - PubMed
    1. Berlin D.A., Gulick R.M., Martinez F.J. Severe Covid-19. N. Engl. J. Med. 2020;383:2451–2460. - PubMed
    1. Blanco-Melo D., Nilsson-Payant B.E., Liu W.C., Uhl S., Hoagland D., Møller R., Jordan T.X., Oishi K., Panis M., Sachs D., et al. Imbalanced Host Response to SARS-CoV-2 Drives Development of COVID-19. Cell. 2020;181:1036–1045.e9. - PMC - PubMed
    1. Broggi A., Ghosh S., Sposito B., Spreafico R., Balzarini F., Lo Cascio A., Clementi N., De Santis M., Mancini N., Granucci F., Zanoni I. Type III interferons disrupt the lung epithelial barrier upon viral recognition. Science. 2020;369:706–712. - PMC - PubMed
    1. Burzyn D., Kuswanto W., Kolodin D., Shadrach J.L., Cerletti M., Jang Y., Sefik E., Tan T.G., Wagers A.J., Benoist C., Mathis D. A special population of regulatory T cells potentiates muscle repair. Cell. 2013;155:1282–1295. - PMC - PubMed

Publication types

MeSH terms