. 2021:20:100085.
doi: 10.1016/j.mcpro.2021.100085. Epub 2021 Apr 27.

Calculating Sample Size Requirements for Temporal Dynamics in Single-Cell Proteomics

Affiliations

Calculating Sample Size Requirements for Temporal Dynamics in Single-Cell Proteomics

Hannah Boekweg et al. Mol Cell Proteomics. 2021.

Abstract

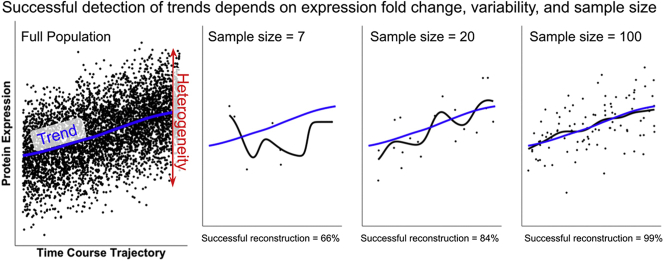
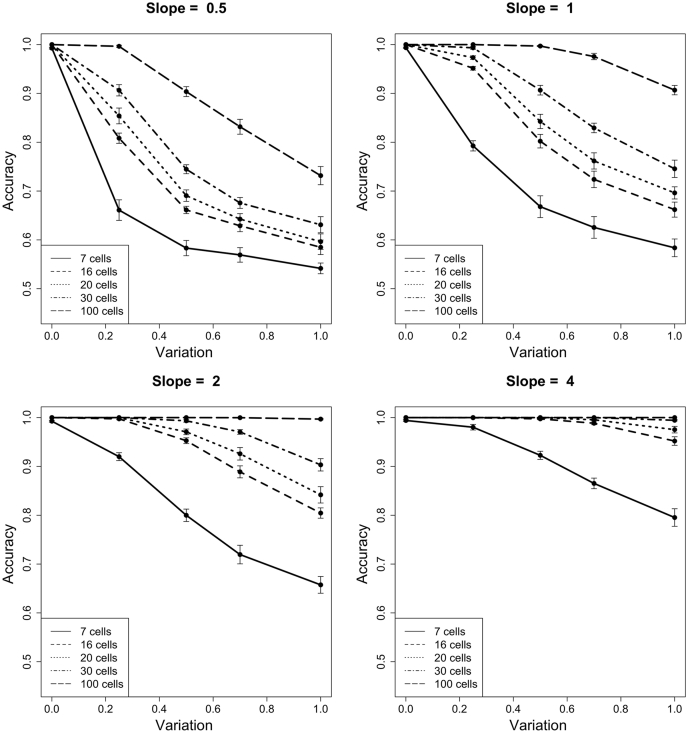
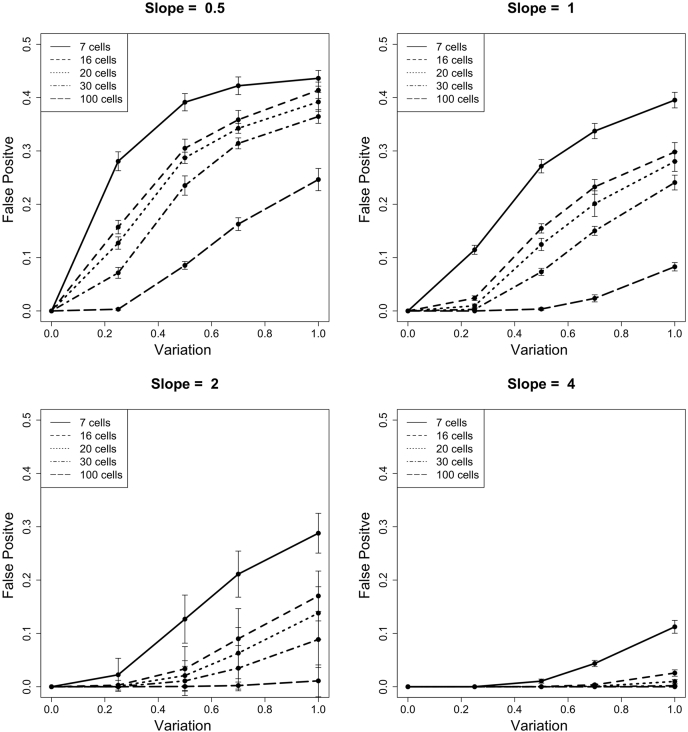
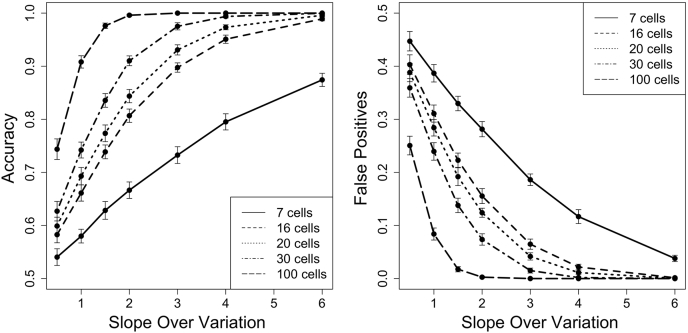
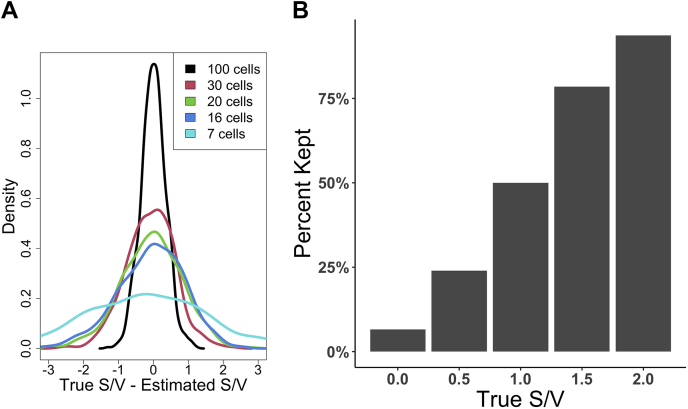
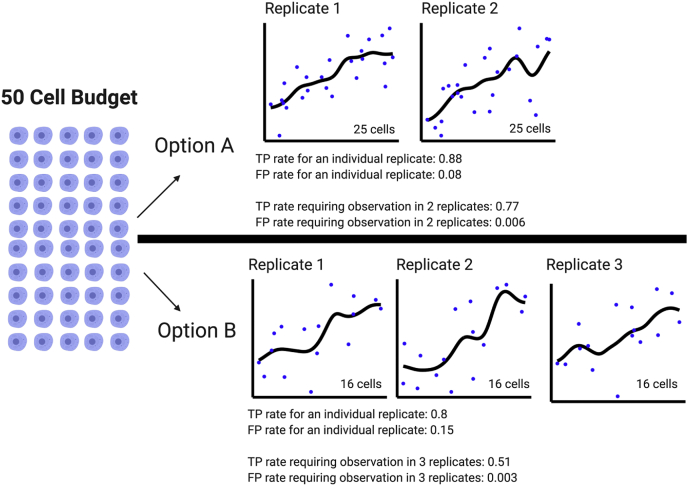
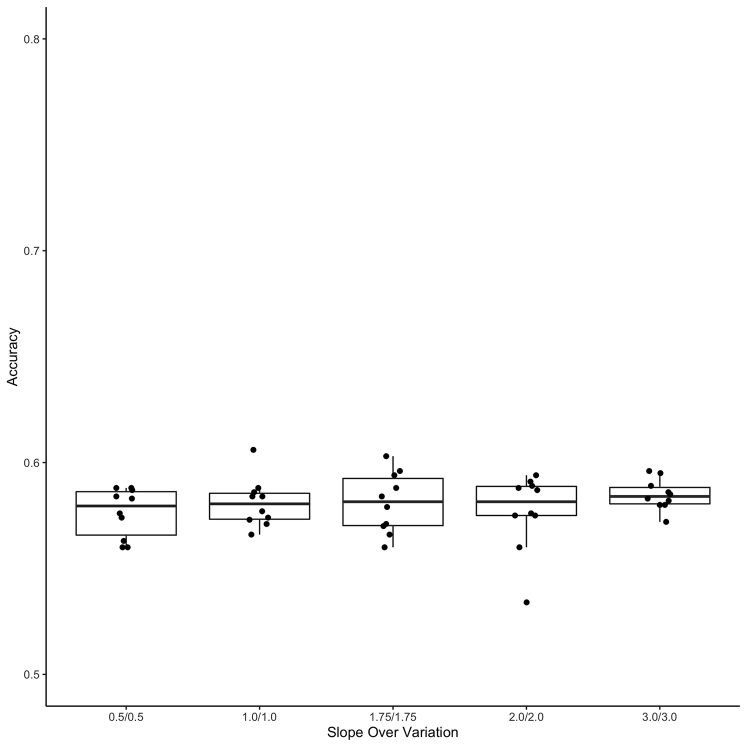
Single-cell measurements are uniquely capable of characterizing cell-to-cell heterogeneity and have been used to explore the large diversity of cell types and physiological functions present in tissues and other complex cell assemblies. An intriguing application of single-cell proteomics is the characterization of proteome dynamics during biological transitions, like cellular differentiation or disease progression. Time-course experiments, which regularly take measurements during state transitions, rely on the ability to detect dynamic trajectories in a data series. However, in a single-cell proteomics experiment, cell-to-cell heterogeneity complicates the confident identification of proteome dynamics as measurement variability may be higher than expected. Therefore, a critical question for these experiments is how many data points need to be acquired during the time course to enable robust statistical analysis. We present here an analysis of the most important variables that affect statistical confidence in the detection of proteome dynamics: fold change, measurement variability, and the number of cells measured during the time course. Importantly, we show that datasets with less than 16 measurements across the time domain suffer from low accuracy and also have a high false-positive rate. We also demonstrate how to balance competing demands in experimental design to achieve a desired result.

Keywords: bioinformatics; experimental design; single-cell proteomics.


Conflict of interest statement

Conflict of interest The authors declare no competing interests.

Figures

None
Graphical abstract
Fig. 1
Fig. 1
Accuracy in the identification of temporal dynamics. For various parameter sets of slope, variability, and number of cells, the accuracy of correctly identifying temporal dynamics is shown. For comparison, each of the four subpanels is organized by slope and shows a parameter sweep over equivalent measurement variabilities and cell numbers. Error bars are derived from ten independent simulations.
Fig. 2
Fig. 2
False-positive rate in the identification of temporal dynamics. The rate of false-positive identification was calculated for the same set of parameters seen in Figure 1. False-positive is defined as the misclassification of a non-changing protein, falsely reporting it as changing. As seen in Figure 1, panels are organized by slope, and show the parameter sweep across variation and number of cells.
Fig. 3
Fig. 3
Scale invariant trends. Accuracy and false-positive rates are shown for a scale-free ratio of S/V. As described for Figures 1 and 2, simulations are used to determine the true-positive and false-positive rates of various parameter combinations of slope, variation, and number of cells. A specific S/V data point is derived from multiple different combinations of slope and variation. For example, values plotted for S/V = 0.5 were derived from six simulations using S/V = (0.5/1.0; 0.75/1.5; 1.0/2.0; 1.5/3.0; 2.0/4.0; and 3.0/6.0). Note the y-axis scale is zoomed to allow better visualization of the data. S/V, slope/variation.
Fig. 4
Fig. 4
Estimating accuracy of S/V approximation of data.A, we estimated the S/V from a subsampling of cells, where the true population S/V = 1. The density plot shows the difference between the approximated S/V and the true S/V, using subsample sizes of 7, 16, 20, 30, and 100. B, the effect of using an estimated S/V as a cutoff. Data were simulated to contain proteins with an S/V of 0, 0.5, 1, 1.5, and 2. After removing data with S/Vest <1, the graph shows the percentage of proteins kept according to their true S/V. S/V, slope/variation.
Fig. 5
Fig. 5
Scenarios for allocating a limited number of cells. With a total budget of 50 cells, two different options are demonstrated. True-positive and false-positive rates for each individual time course and the overall rate with replicates are shown. Option A depicts an experiment with two replicates and 25 cells characterized during each time course. Option B shows an experiment with three replicates and 16 cells characterized during each time course. When considering replicates, option A has a higher TP rate but option B has fewer false positives.
Supplemental Figure S1
Subsample interpolation and ABC calculation. Both panels show a 16-cell subsampling from a larger population of measurements made with slope = 1 and SD = 0.5. The trajectory of these 16 data points is interpolated with cellAlign and shown in a black line. In the left panel, the subsample’s interpolated trajectory is compared with the true trajectory derived from the original population (blue line). The area between these two lines is calculated as the ABC_true (shaded in gray). In the right panel, a null model of no change is evaluated. The subsample’s trajectory is compared with a flat line equivalent to the average intensity value; this metric is called ABC_null.
Supplemental Figure S2
Fold change versus variability of proteins in a single-cell proteomics dataset. Using quantitative proteome abundance data (20), we calculated the SD of within-group replicates and compared this with the fold change between cell types. Each dot on the graph is a different protein, and red indicated that the protein would have passed a t-test for differential expression (FDR corrected p < 0.05); proteins not passing a t-test are shown in black. For convenience, we have drawn lines indicating a 1:1 ratio between fold change and variation (solid line), a 2:1 ratio (dashed line), and a 4:1 ratio (dotted line). FDR, false-discovery rate
Supplemental Figure S3
Comparing accuracy between different combinations of S/V. The accuracy of each S/V in Figure 3 was calculated using five different combinations of slope and variation, where each combination was replicated ten times. This figure illustrates an instance of this, where we sampled seven cells from data that have an S/V of 1. The five different ratios used to calculate the average accuracy were S/V = .5/.5, 1/1, 1.75/1.75, 2/2, and 3/3. Each combination has ten replicates. An ANOVA test shows that there is no significant difference between the combinations (FDR corrected p < 0.05). FDR, false-discovery rate; S/V, slope/variation.

References

    1. Mahdessian D., Cesnik A.J., Gnann C., Danielsson F., Stenström L., Arif M., Zhang C., Le T., Johansson F., Shutten R., Bäckström A., Axelsson U., Thul P., Cho N.H., Carja O. Spatiotemporal dissection of the cell cycle with single-cell proteogenomics. Nature. 2021;590:649–654. - PubMed
    1. Specht H., Slavov N. Transformative opportunities for single-cell proteomics. J. Proteome Res. 2018;17:2565–2571. - PMC - PubMed
    1. Doerr A. Single-cell proteomics. Nat. Methods. 2019;16:20. - PubMed
    1. Macosko E.Z., Basu A., Satija R., Nemesh J., Shekhar K., Goldman M., Tirosh I., Bialas A.R., Kamitaki N., Martersteck E.M., Trombetta J.J., Weitz D.A., Sanes J.R., Shalek A.K., Regev A. Highly parallel genome-wide expression profiling of individual cells using nanoliter droplets. Cell. 2015;161:1202–1214. - PMC - PubMed
    1. Klein A.M., Mazutis L., Akartuna I., Tallapragada N., Veres A., Li V., Peshkin L., Weitz D.A., Kirschner M.W. Droplet barcoding for single-cell transcriptomics applied to embryonic stem cells. Cell. 2015;161:1187–1201. - PMC - PubMed

Publication types

LinkOut - more resources