. 2021 Aug 15:237:118068.
doi: 10.1016/j.neuroimage.2021.118068. Epub 2021 Apr 26.

Longitudinal infant fNIRS channel-space analyses are robust to variability parameters at the group-level: An image reconstruction investigation

Affiliations

Longitudinal infant fNIRS channel-space analyses are robust to variability parameters at the group-level: An image reconstruction investigation

Liam H Collins-Jones et al. Neuroimage. .

Abstract

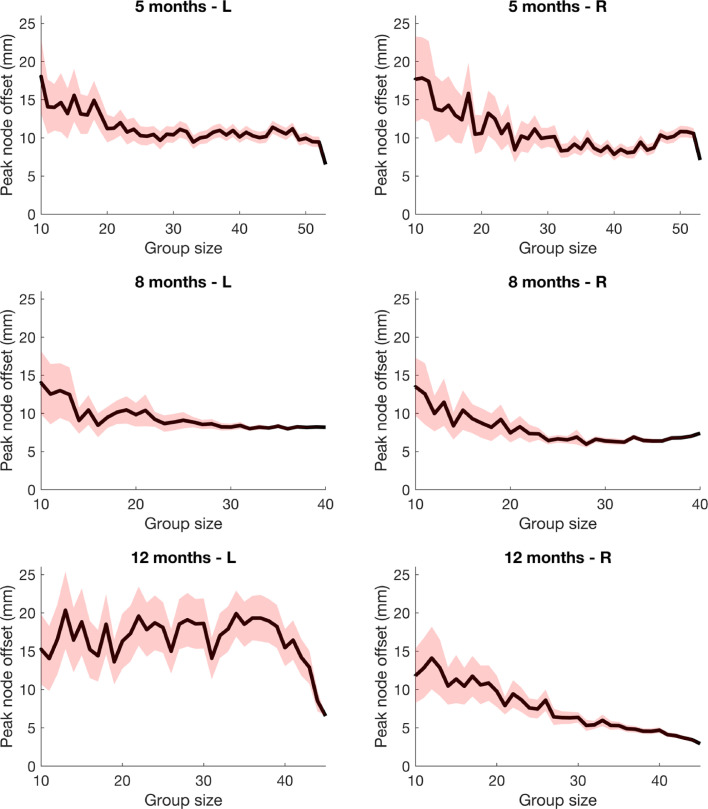
The first 1000 days from conception to two-years of age are a critical period in brain development, and there is an increasing drive for developing technologies to help advance our understanding of neurodevelopmental processes during this time. Functional near-infrared spectroscopy (fNIRS) has enabled longitudinal infant brain function to be studied in a multitude of settings. Conventional fNIRS analyses tend to occur in the channel-space, where data from equivalent channels across individuals are combined, which implicitly assumes that head size and source-detector positions (i.e. array position) on the scalp are constant across individuals. The validity of such assumptions in longitudinal infant fNIRS analyses, where head growth is most rapid, has not previously been investigated. We employed an image reconstruction approach to analyse fNIRS data collected from a longitudinal cohort of infants in The Gambia aged 5- to 12-months. This enabled us to investigate the effect of variability in both head size and array position on the anatomical and statistical inferences drawn from the data at both the group- and the individual-level. We also sought to investigate the impact of group size on inferences drawn from the data. We found that variability in array position was the driving factor between differing inferences drawn from the data at both the individual- and group-level, but its effect was weakened as group size increased towards the full cohort size (N = 53 at 5-months, N = 40 at 8-months and N = 45 at 12-months). We conclude that, at the group sizes in our dataset, group-level channel-space analysis of longitudinal infant fNIRS data is robust to assumptions about head size and array position given the variability in these parameters in our dataset. These findings support a more widespread use of image reconstruction techniques in longitudinal infant fNIRS studies.

Keywords: Functional near-infrared spectroscopy; Image reconstruction; Infant cognitive development; Infant functional neuroimaging; Longitudinal imaging; Neurodevelopment.


Conflict of interest statement

Declaration of Competing Interest R.J.C. has financial interests in Gowerlabs Ltd, a manufacturer of fNIRS technologies.

Figures

Fig. 1:
Fig. 1
a) Representation of the BRIGHT array, outlining the positions of sources and detectors (see legend). b) Anterior headgear placement of three infants included in the study. The horizontal dotted line denotes the level of the top of the eyebrows, and the vertical dotted line denotes the midline. A: vertical line denoting middle of the headband is uncentered relative to the midline, but the bottom of the headband is not displaced relative to the top of the eyebrows. B: bottom of headband is displaced superiorly with respect to the top of the eyebrows, but is centred relative to the midline. C: headgear is centred relative to the midline and is in line with the top of the eyebrows. c) Lateral assessment of headgear placement. The displacement of a reference optode, highlighted by a dotted circled, in directions parallel to the x- and y-axes is measured (denoted by “x-disp.” and “y-disp.”). Displacement in the anterior or superior directions were taken to be positive, while displacement in the posterior or inferior directions were taken to be negative.
Fig. 2:
Fig. 2
Outline of the different processing streams compared in this study.
Fig. 3:
Fig. 3
Top row: example sagittal, axial and coronal sections of the four-layer infant head model showing the distribution of white matter (WM), grey matter (GM), cerebrospinal fluid (CSF) and extra-cerebral tissue (ECT). Bottom row: the position of the cranial landmarks and 10-5 positions (in black) and cranial landmarks (in magenta) on the scalp surface.
Fig. 4:
Fig. 4
The array registration process for the subject parameter reconstruction pipeline. A) Photograph of the lateral placement of the array on an example infant, with the x- and y-axes overlaid. B) The x- and y-axes approximated on the head model warped on the basis of the infant's head measurements. C) Curves (in green) parallel to the Iz-FPz curve which were used to register optodes in relation to the reference optode, shown as a red circle. D) All optodes registered to the head model, where detectors are represented by blue circles and sources are represented by red circles.
Fig. 5:
Fig. 5
Group-level T-statistic images of changes in oxy-haemoglobin concentration in response to the auditory vocal condition relative to baseline for two approaches to analysing fNIRS data. Top row: subject parameter reconstruction pipeline. Bottom row: channel-space analysis. The significance level of displayed T-statistic values is p < 0.05, Bonferroni corrected on the basis of number of nodes in the grey matter surface mesh.
Fig. 6:
Fig. 6
Group-level T-statistic images of changes in deoxy-haemoglobin concentration in response to the auditory vocal condition relative to baseline for two approaches to analysing fNIRS data. Top row: subject parameter reconstruction pipeline. Bottom row: channel-space analysis. The significance level of displayed T-statistic values is p < 0.05, Bonferroni corrected on the basis of number of nodes in the grey matter surface mesh.
Fig. 7:
Fig. 7
Differences in absolute maximum T-statistic values of the channel-space analysis relative to the subject parameter reconstruction for (a) oxy-haemoglobin and (b) deoxy-haemoglobin concentration changes across four cortical areas where activation is consistently seen in the oxy-haemoglobin channel-space analysis. For each pair of bars grouped by colour, the left bar represents the difference in that region in the left hemisphere and the right bar (with a more faded colour) represents the difference in that region in the right hemisphere. Note: at 8-months in the right hemisphere, no activation was seen in the inferior frontal gyrus in either the channel-space analysis or subject parameter group-level image. The cortical areas are shown in (c).
Fig. 8:
Fig. 8
Group-level T-statistic images of changes in oxy-haemoglobin concentration in response to the auditory vocal condition relative to baseline for the four processing streams. From top row to bottom row: subject parameter reconstruction, constant head warp reconstruction, constant array position reconstruction, constant parameter reconstruction. The significance level of displayed T-statistic values is p < 0.05, Bonferroni corrected on the basis of number of nodes in the grey matter surface mesh.
Fig. 9:
Fig. 9
Top: normalised and thresholded group-level T-statistic images of changes in oxy-haemoglobin concentration in response to the auditory vocal condition relative to baseline for subject parameter (top row) and constant parameter (middle row) pipelines. Each image is thresholded at values between 50% and 90% of its maximum T-statistic value. Bottom row: cumulative area of activation as a function of T-statistic value. At larger T-statistic values, the area covered in subject parameter group-level images is consistently lower than is the case in the constant parameter group-level images, suggesting greater focality in images resulting from the subject parameter pipeline.
Fig. 10:
Fig. 10
Peak node offset at the individual-level for each processing stream relative to subject parameter reconstructions. Peak node offset values were calculated in the space of the constant head warp model for each age. Significance levels were computed using paired t-tests. * represents p < 0.05 (corrected), ** represents p < 0.01 (corrected), *** represents p < 0.001 (corrected).
Fig. 11:
Fig. 11
Group-level T-statistic images of changes in oxy-haemoglobin concentration in response to the auditory vocal condition relative to baseline for a sub-cohort of 10 randomly chosen infants at each age. Top row: subject parameter reconstruction pipeline. Bottom row: constant parameter reconstruction pipeline. The significance level of displayed T-statistic values is p < 0.05, Bonferroni corrected on the basis of number of nodes in the grey matter surface mesh.
Fig. 12:
Fig. 12
Peak node offset as a function of group size. Mean ± standard error is shown by the red shaded area. An increase in group size leads to a decrease in peak node offset and, by extension, a decrease in the likelihood of different inferences being drawn from the results at the group-level. Note: this effect is less evident at 12-months in the left hemisphere, but this likely relates to the fact that the constant parameter approach appears to yield two disparate peaks (one in the temporal lobe and one in the inferior frontal gyrus, see Fig. 8).
Fig. 13:
Fig. 13
Cortical label mismatch between subject parameter and constant parameter reconstruction pipelines as a function of group size.

References

    1. Aasted C.M., Yücel M.A., Cooper R.J., Dubb J., Tsuzuki D., Becerra L., Petkov M.P., Borsook D., Dan I., Boas D.A. Anatomical guidance for functional near-infrared spectroscopy: atlasViewer tutorial. Neurophotonics. 2015;2(2) doi: 10.1117/1.nph.2.2.020801. - DOI - PMC - PubMed
    1. Akiyama L.F., Richards T.R., Imada T., Dager S.R., Wroblewski L., Kuhl P.K. Age-specific average head template for typically developing 6-month-old infants. PLoS One. 2013;8(9):e73821. doi: 10.1371/journal.pone.0073821. - DOI - PMC - PubMed
    1. Arridge, S., & Cooper, R. J. (2015). Optical Image Reconstruction. In A. W. Toga (Ed.), Brain Mapping: an Encyclopedic Reference (1, pp. 217–222). Elsevier Science. https://doi.org/10.1016/B978-0-12-397025-1.00288-8
    1. Azhari A., Truzzi A., Neoh M.J.-Y., Balagtas J.P.M., Tan H.H., Goh P.P., Ang X.A., Setoh P., Rigo P., Bornstein M.H., Esposito G. A decade of infant neuroimaging research: what have we learned and where are we going? Infant Behav. Dev. 2020;58 doi: 10.1016/j.infbeh.2019.101389. - DOI - PubMed
    1. Begus K., Lloyd-Fox S., Halliday D., Papademetriou M., Darboe M.K., Prentice A.M., Moore S.E., Elwell C.E. Using fNIRS to study working memory of infants in rural Africa. Adv. Exp. Med. Biol. 2016;876:273–279. doi: 10.1007/978-1-4939-3023-4_34. - DOI - PubMed

Publication types

MeSH terms