Comparative Study
. 2021 May:69:102576.
doi: 10.1016/j.healthplace.2021.102576. Epub 2021 Apr 19.

SARS-CoV-2 testing in North Carolina: Racial, ethnic, and geographic disparities

Affiliations
Comparative Study

SARS-CoV-2 testing in North Carolina: Racial, ethnic, and geographic disparities

Katerina Brandt et al. Health Place. 2021 May.

Abstract

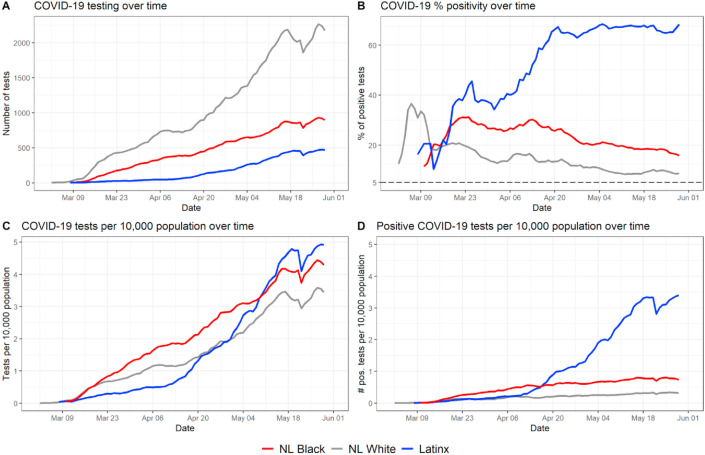
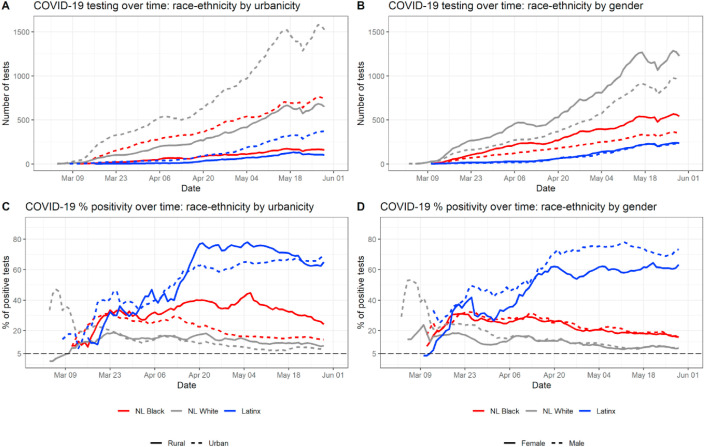
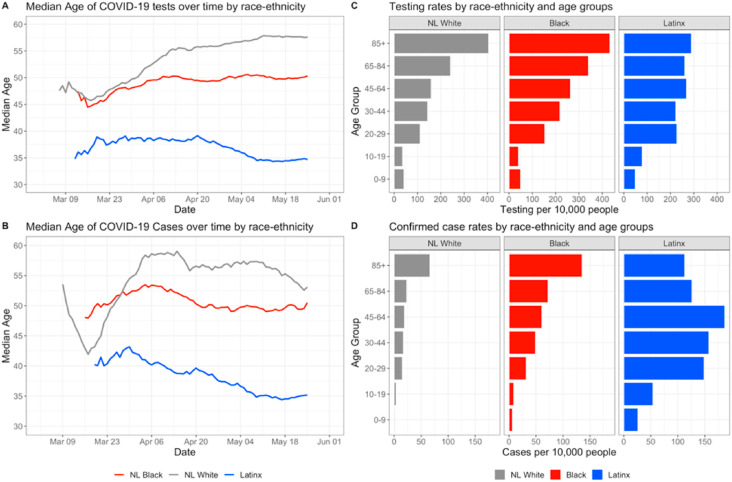
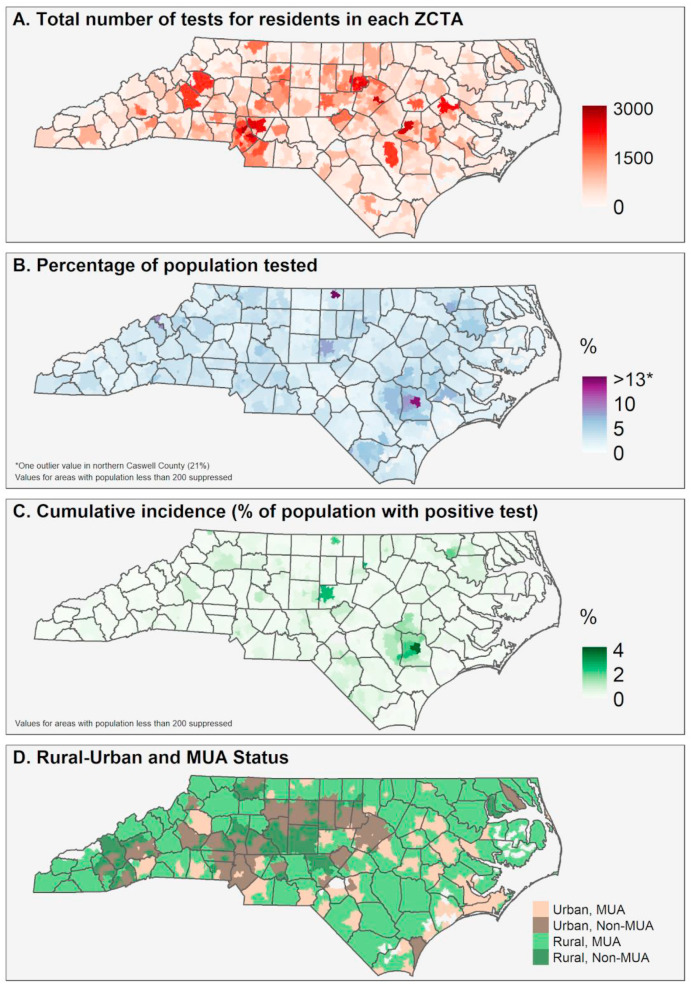
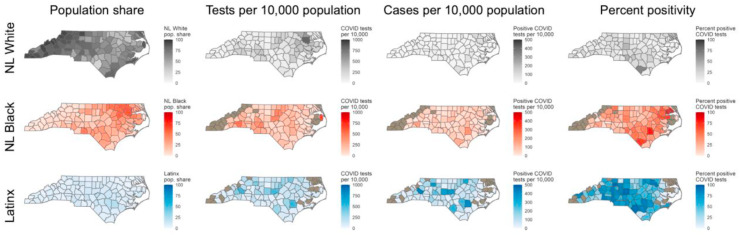
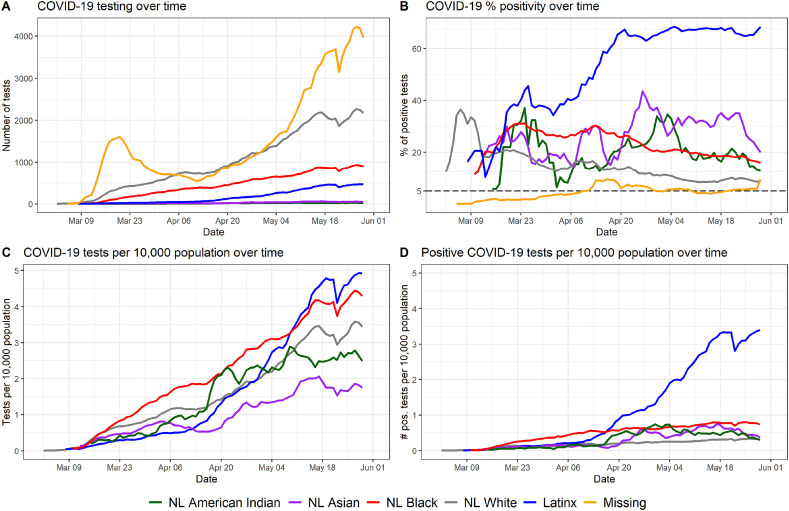
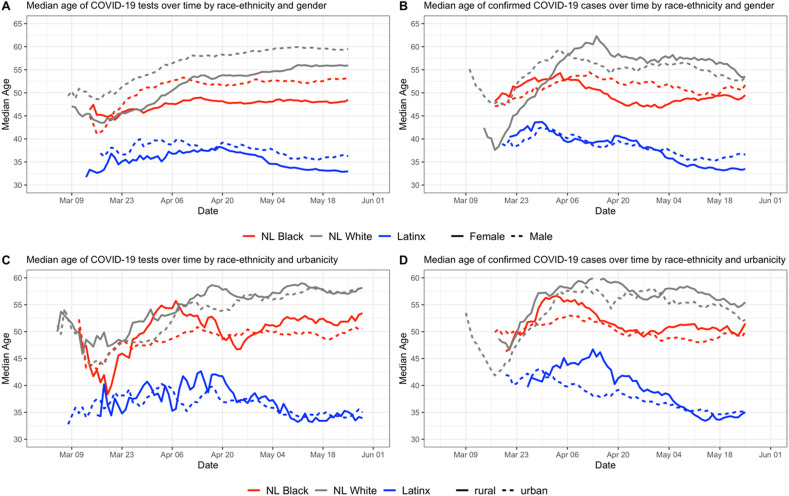
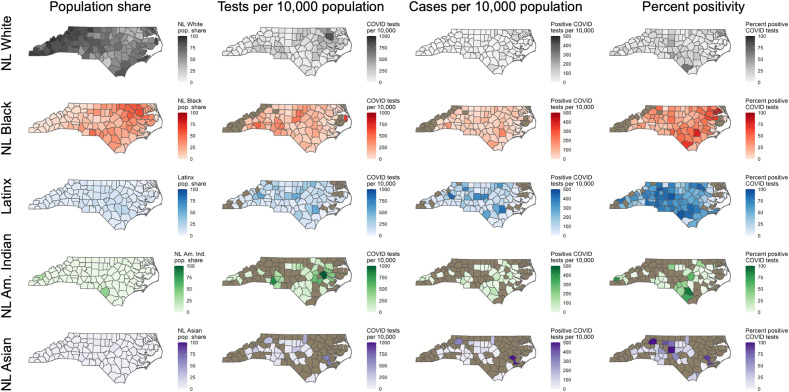
SARS-CoV-2 testing data in North Carolina during the first three months of the state's COVID-19 pandemic were analyzed to determine if there were disparities among intersecting axes of identity including race, Latinx ethnicity, age, urban-rural residence, and residence in a medically underserved area. Demographic and residential data were used to reconstruct patterns of testing metrics (including tests per capita, positive tests per capita, and test positivity rate which is an indicator of sufficient testing) across race-ethnicity groups and urban-rural populations separately. Across the entire sample, 13.1% (38,750 of 295,642) of tests were positive. Within racial-ethnic groups, 11.5% of all tests were positive among non-Latinx (NL) Whites, 22.0% for NL Blacks, and 66.5% for people of Latinx ethnicity. The test positivity rate was higher among people living in rural areas across all racial-ethnic groups. These results suggest that in the first three months of the COVID-19 pandemic, access to COVID-19 testing in North Carolina was not evenly distributed across racial-ethnic groups, especially in Latinx, NL Black and other historically marginalized populations, and further disparities existed within these groups by gender, age, urban-rural status, and residence in a medically underserved area.

Keywords: COVID-19; Healthcare disparity; North Carolina; Public health surveillance; Rural communities; SARS-CoV-2.


Conflict of interest statement

The authors have no conflicts of interest to report.

Figures

Fig. 1
Fig. 1
Temporal trend in testing and percent positive tests by race-ethnicity. The three largest race-ethnicity groups in North Carolina are represented here (NL White, NL Black, and Latinx). Fig. S1 in the Supplement shows the same metrics with all race-ethnicity categories represented in the data.
Fig. 2
Fig. 2
Temporal trend in testing and percent positive tests within race-ethnicity groups by urban-rural status and gender. These are broken down by urban-rural (left column) and by gender (right column) subgroups.
Fig. 3
Fig. 3
Intersections between race and age in COVID-19 testing and positivity. Fig. S2 in the Supplement extends the findings of Fig. 3A and B by showing median ages of individuals tested and individuals testing positive among sub-groups stratified by race-ethnicity and rural-urban status or gender.
Fig. 4
Fig. 4
Spatial patterns in testing and confirmed cases in North Carolina through June 1. Note: Empirical Bayesian smoothed values are mapped for Fig. 1B and C, to account for rates with small population denominators.
Fig. 5
Fig. 5
Spatial patterns in tests per capita, positive tests per capita, and percent positive at the county level, stratified by race-ethnicity. Fig. S3 in the Supplement shows these metrics for NL American Indian and NL Asian populations. The tan color indicates that data in that county was suppressed due to identifiability concerns for a given race-ethnic group.
Fig. S1
Fig. S1
Trends in testing by race-ethnicity, for all groups in the combined race-ethnicity categorization. Fig. S1 displays the temporal trends in testing and percent positive tests by race-ethnicity for all race-ethnicity groups in the data. The rate of testing is based on the day the specimen was collected, from March 1 to June 1, 2020. Fig. S1A shows the overall number of COVID-19 tests performed for each of the major race-ethnicity groups in North Carolina and for observations with missing race-ethnicity information. Fig. S1B shows the percentage of positive COVID-19 tests, by race-ethnicity group. Fig. S1C shows the rate of testing per 10,000 population for each race-ethnicity group, and Fig. S1D shows the rate of positive tests per 10,000 population for each race-ethnicity group. These time series graphs extend Fig. 1 to contain information about three additional groups: NL American Indians (green lines), NL Asians (purple lines), and people with missing race and ethnicity data (orange lines). The numbers of tests among NL American Indians and NL Asians was limited until mid-April and then increased over time in absolute numbers (Fig. S1A) as well as per capita (Fig. S1C). We observe a high level of temporal variation in test positivity rate among both NL American Indians and NL Asians, but the test positivity rate remained above the percent positive rate among NL Whites (gray line) from mid-April and through May (Fig. S1B) for both groups, with the per capita number of cases within these groups also remaining higher than the per-capita number of cases among NL Whites (Fig. S1D). Additionally, at no point during the study period did the percent positivity rate in either of these race-ethnicity groups reach the policy goal of 5% (Fig. S1B). Fig. S1C and Fig. S1D do not contain information for the group that was missing race-ethnicity data because there was no comparable census group to provide a denominator when calculating per-capita rates of testing and positive tests.
Fig. S2
Fig. S2
Temporal trend in median age of COVID-19 tests and median age of positive COVID-19 tests by race-ethnicity, gender, and urban-rural status. Fig. S2 extends the results of Fig. 3 by showing temporal trends in the median age of people receiving COVID-19 tests and positive COVID-19 tests by race-ethnicity stratified by gender and urban-rural status. The methods for the creation of Fig. S2 are the same used to create Fig. 3A and B using further stratified sub-groups. Fig. S2A and Fig. S2B represent the temporal trend in median age by race-ethnicity and gender for all tests (Fig. S2A) and for all positive tests (Fig. S2B). Fig. S2C and Fig. S2D show the trend in median age over time for all tests (Fig. S2C) and for all positive tests (Fig. S2D) within each of the three largest race-ethnic groups in North Carolina, stratified by urban-rural status. The median age of testing is higher for men across all race-ethnicity groups, and throughout the testing period. NL White men had the highest median age for testing ranging from 55 to 60 years since April, and Latinx women had the lowest median age ranging from 32 to 38 years since mid-April. Age differences in those who tested positive, however, among different race-ethnicity groups are less prominent. One exception is the consistently higher median age of NL White women that tested positive compared to NL White men starting in early April. The age of testing was usually older in rural areas than in urban areas for all three race-ethnic groups. People with positive tests were usually older in rural areas for all three groups; the median age difference of those with a positive test was much more pronounced between the rural and urban Latinx populations from late March to May.
Fig. S3
Fig. S3
Spatial patterns in tests per capita, positive tests per capita, and percent positive at the county level, stratified by race-ethnicity, for the 5 largest race-ethnicity groups in NC. Data were suppressed for NL American Indians and NL Asians in many counties due to small numbers, so it is difficult to interpret a spatial pattern for COVID-19 testing and test positivity within these groups; however, in the counties that did have sufficient data to examine county-level patterns, percent positivity among both NL American Indians and NL Asians was most often higher than percent positivity among NL Whites.

References

    1. Ajilore O. Rural America is starting to feel the impact of the coronavirus. Center for American Progress. April 28, 2020 https://www.americanprogress.org/issues/economy/reports/2020/04/28/48401...
    1. American Community Survey . US Census Bureau; 2019. 2014-2018 American Community Survey 5-year Estimates.https://www.census.gov/data/developers/data-sets/acs-5year.html
    1. Anselin Luc, Syabri Ibnu, Kho Youngihn. GeoDa: an introduction to spatial data analysis. Geogr. Anal. 2006;38(1):5–22.
    1. Bai Y., Yao L., Wei T., et al. Presumed asymptomatic carrier transmission of COVID-19. J. Am. Med. Assoc. 2020;323(14):1406–1407. doi: 10.1001/jama.2020.2565. - DOI - PMC - PubMed
    1. Bailey Z.D., Moon J.R. Racism and the political economy of COVID-19: will we continue to resurrect the past? J. Health Polit. Pol. Law. 2020:8641481. doi: 10.1215/03616878-8641481. - DOI - PubMed

Publication types

MeSH terms