. 2021 Jul;595(7865):114-119.
doi: 10.1038/s41586-021-03569-1. Epub 2021 Apr 29.

A molecular single-cell lung atlas of lethal COVID-19

Affiliations

A molecular single-cell lung atlas of lethal COVID-19

Johannes C Melms et al. Nature. 2021 Jul.

Erratum in

  • Author Correction: A molecular single-cell lung atlas of lethal COVID-19.
    Melms JC, Biermann J, Huang H, Wang Y, Nair A, Tagore S, Katsyv I, Rendeiro AF, Amin AD, Schapiro D, Frangieh CJ, Luoma AM, Filliol A, Fang Y, Ravichandran H, Clausi MG, Alba GA, Rogava M, Chen SW, Ho P, Montoro DT, Kornberg AE, Han AS, Bakhoum MF, Anandasabapathy N, Suárez-Fariñas M, Bakhoum SF, Bram Y, Borczuk A, Guo XV, Lefkowitch JH, Marboe C, Lagana SM, Del Portillo A, Tsai EJ, Zorn E, Markowitz GS, Schwabe RF, Schwartz RE, Elemento O, Saqi A, Hibshoosh H, Que J, Izar B. Melms JC, et al. Nature. 2021 Oct;598(7882):E2. doi: 10.1038/s41586-021-03921-5. Nature. 2021. PMID: 34625743 Free PMC article. No abstract available.

Abstract

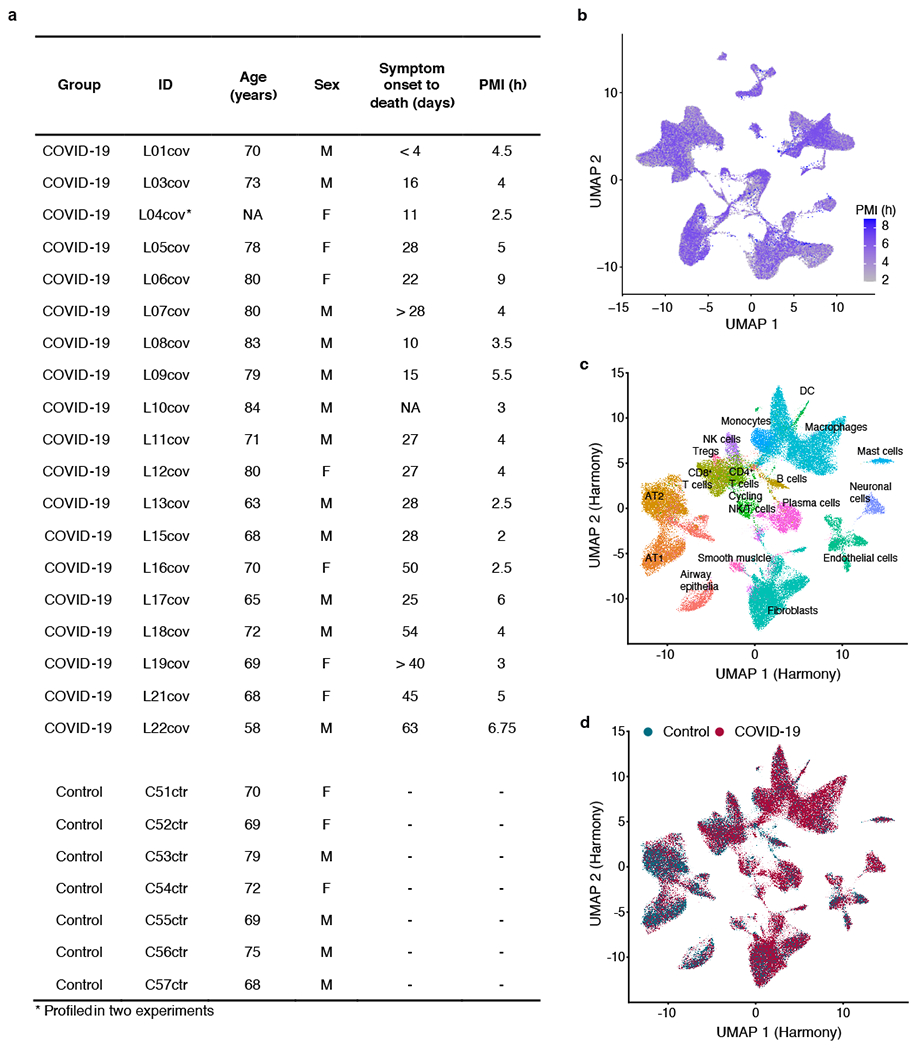
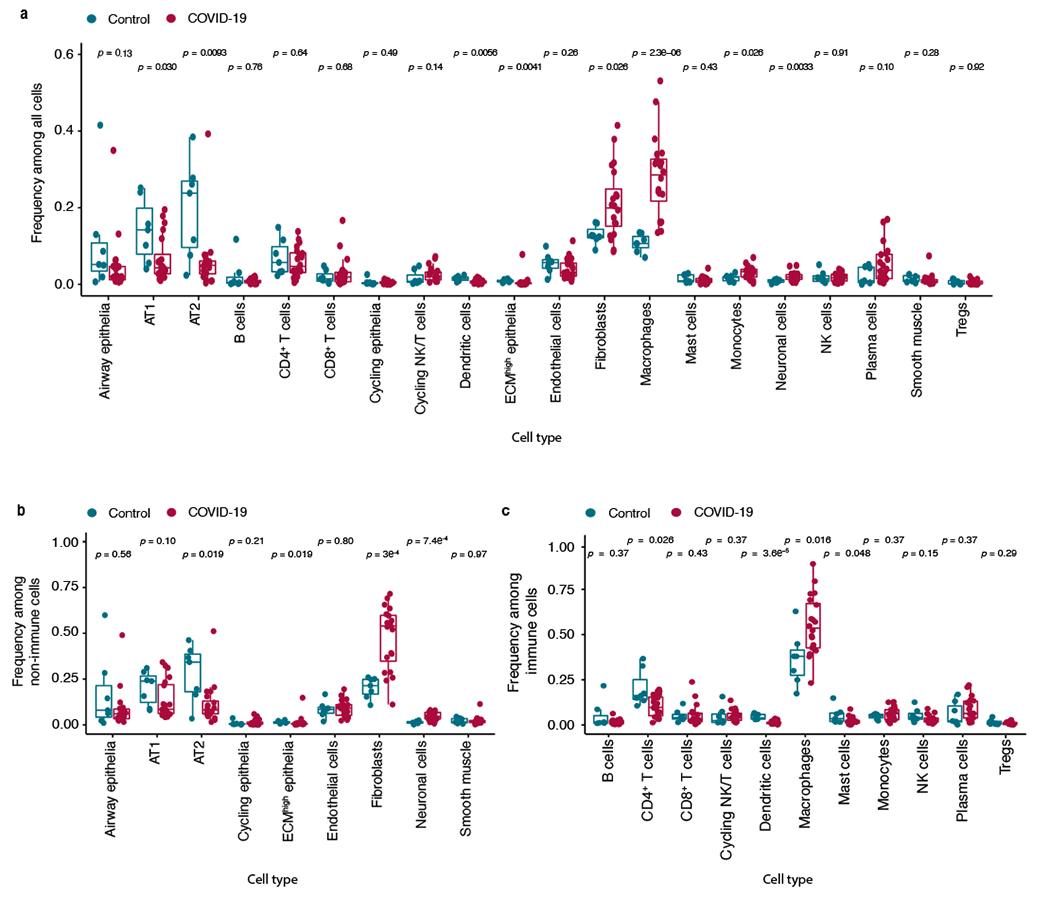
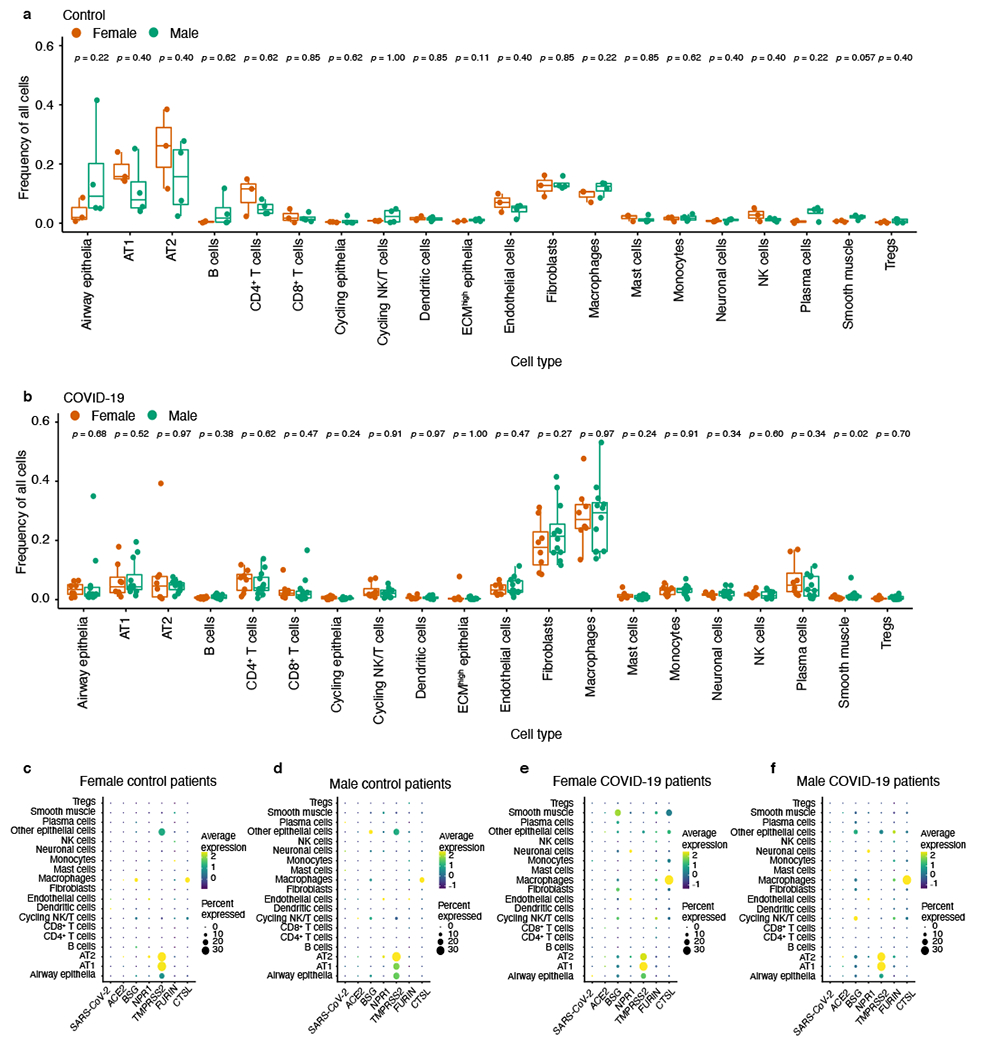
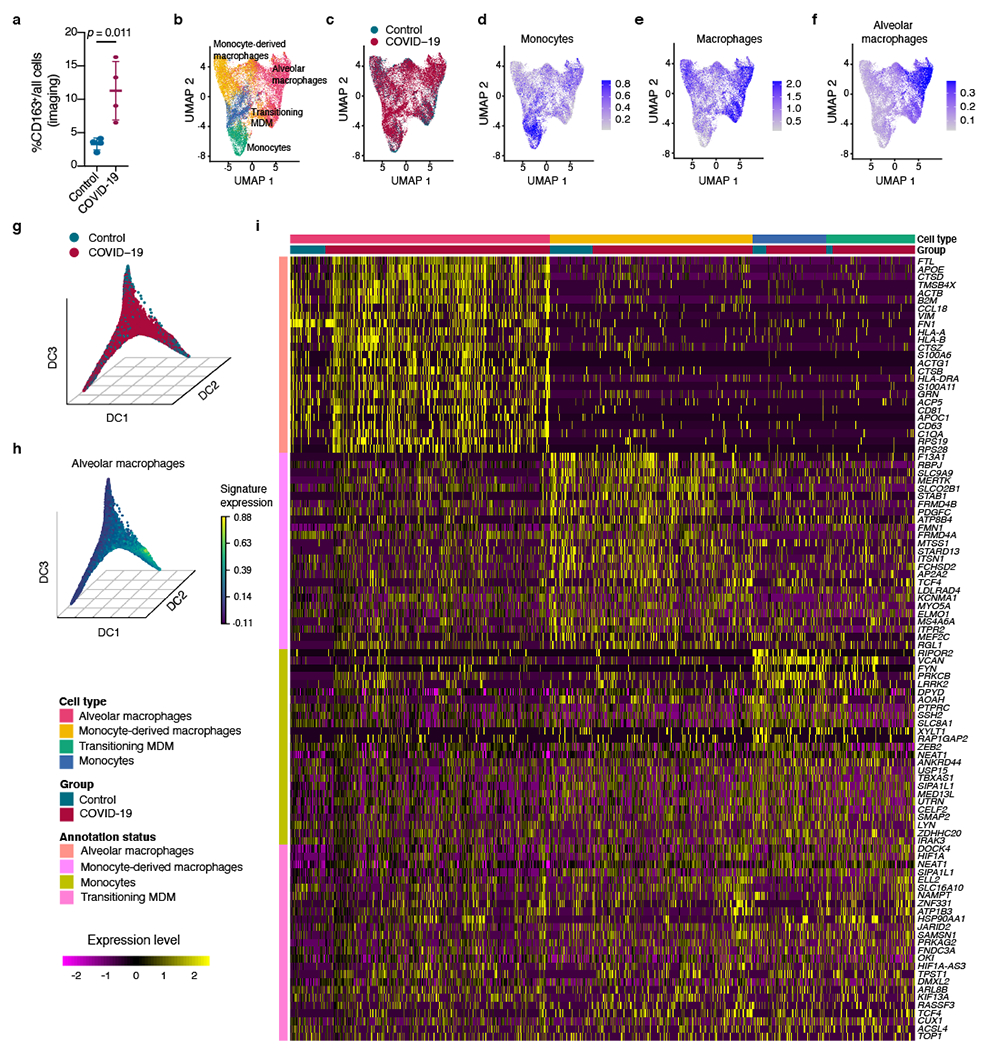
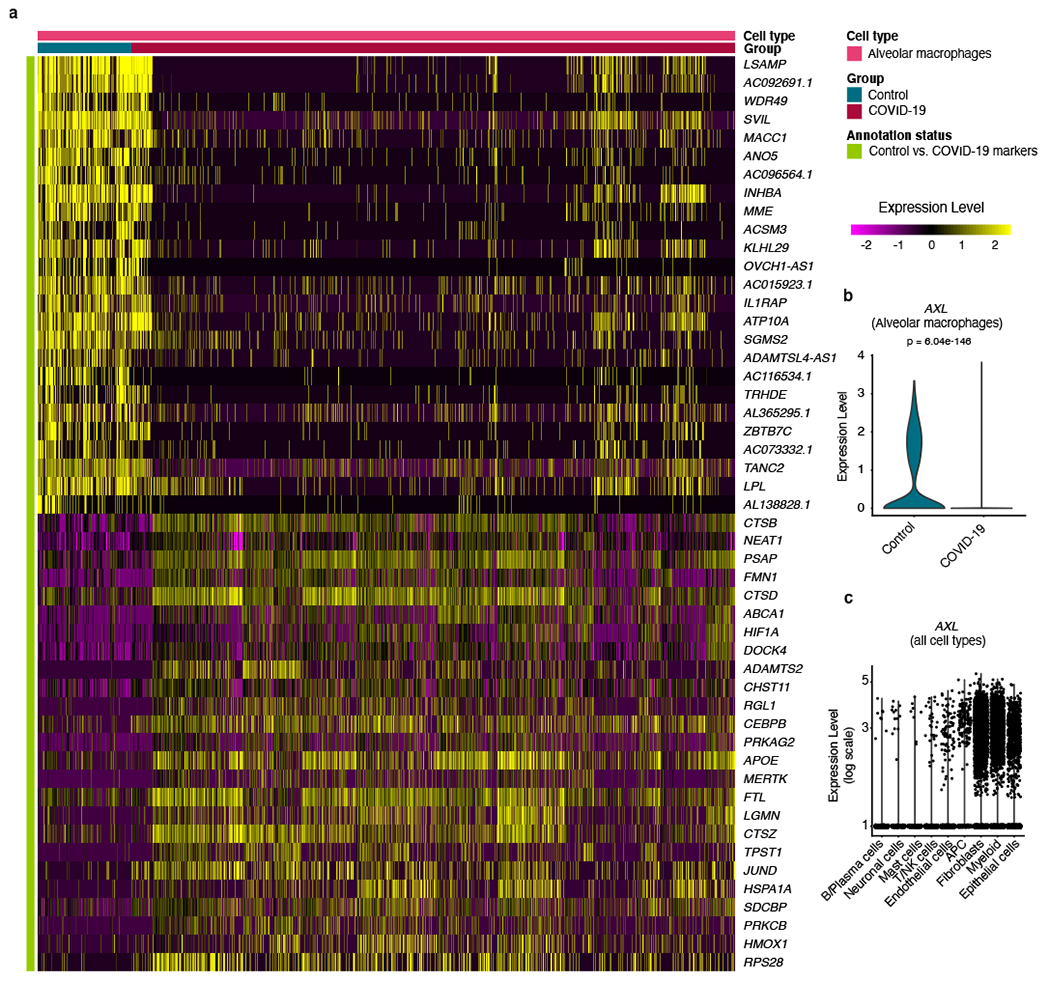
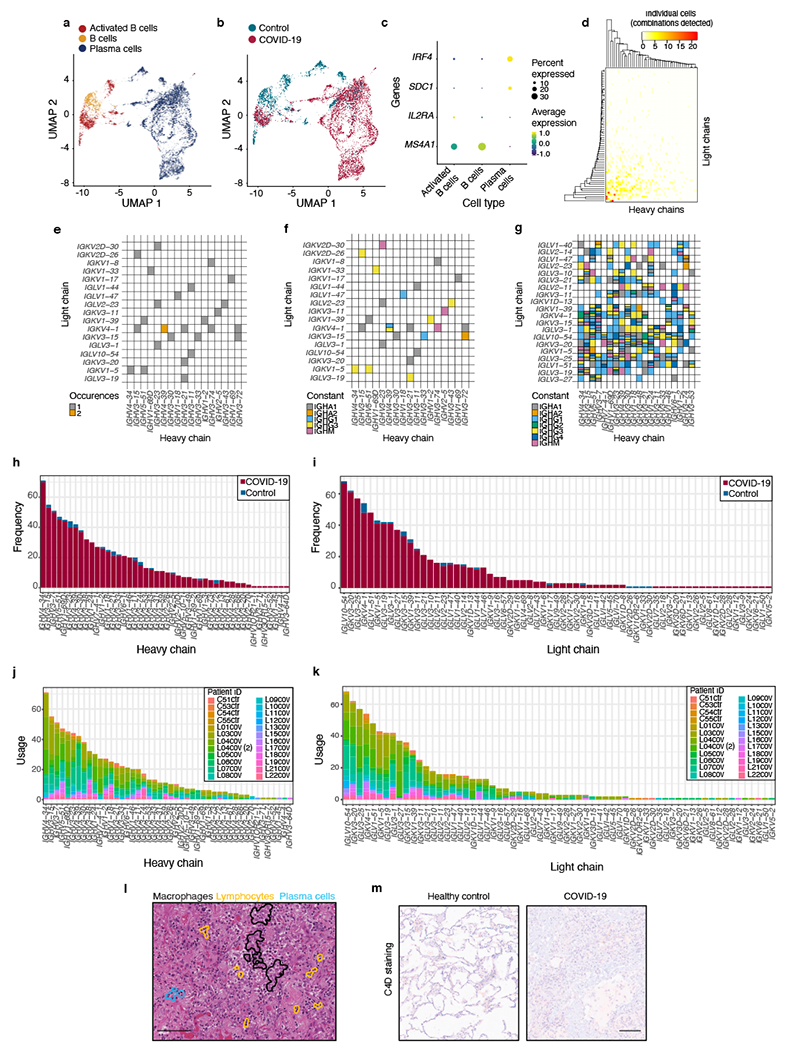
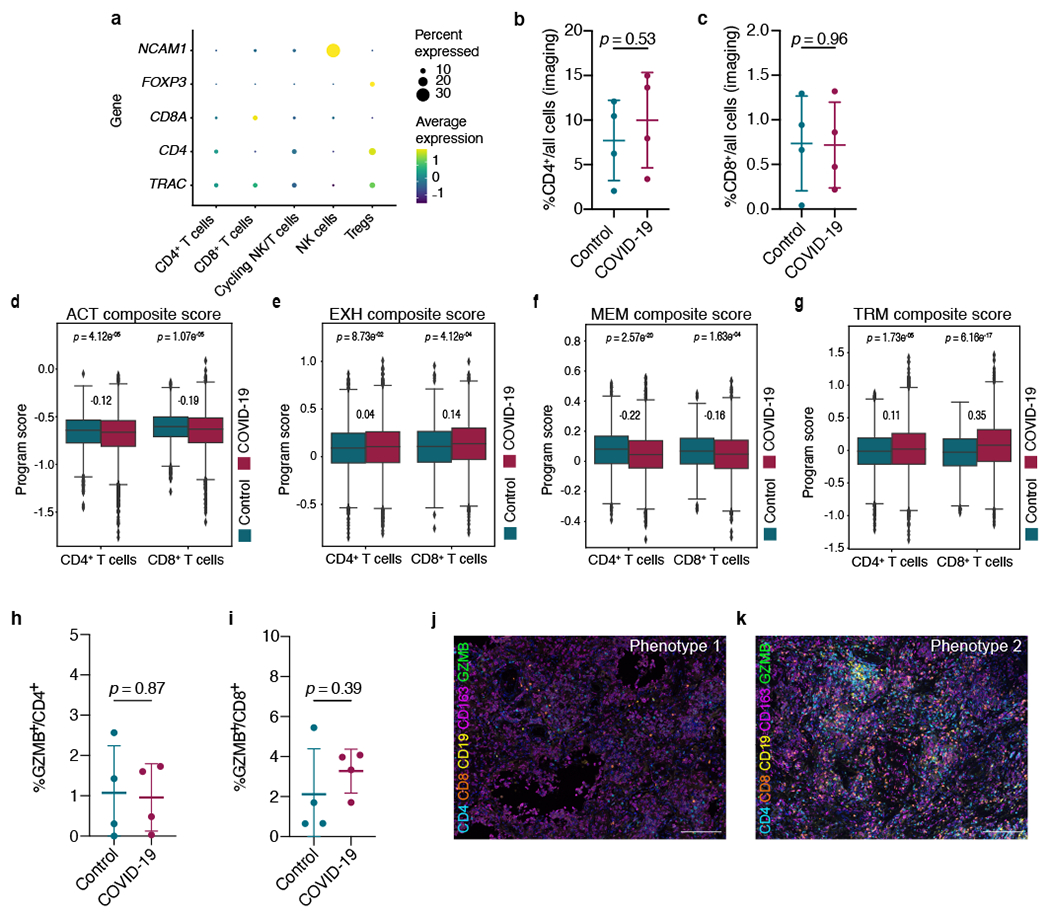
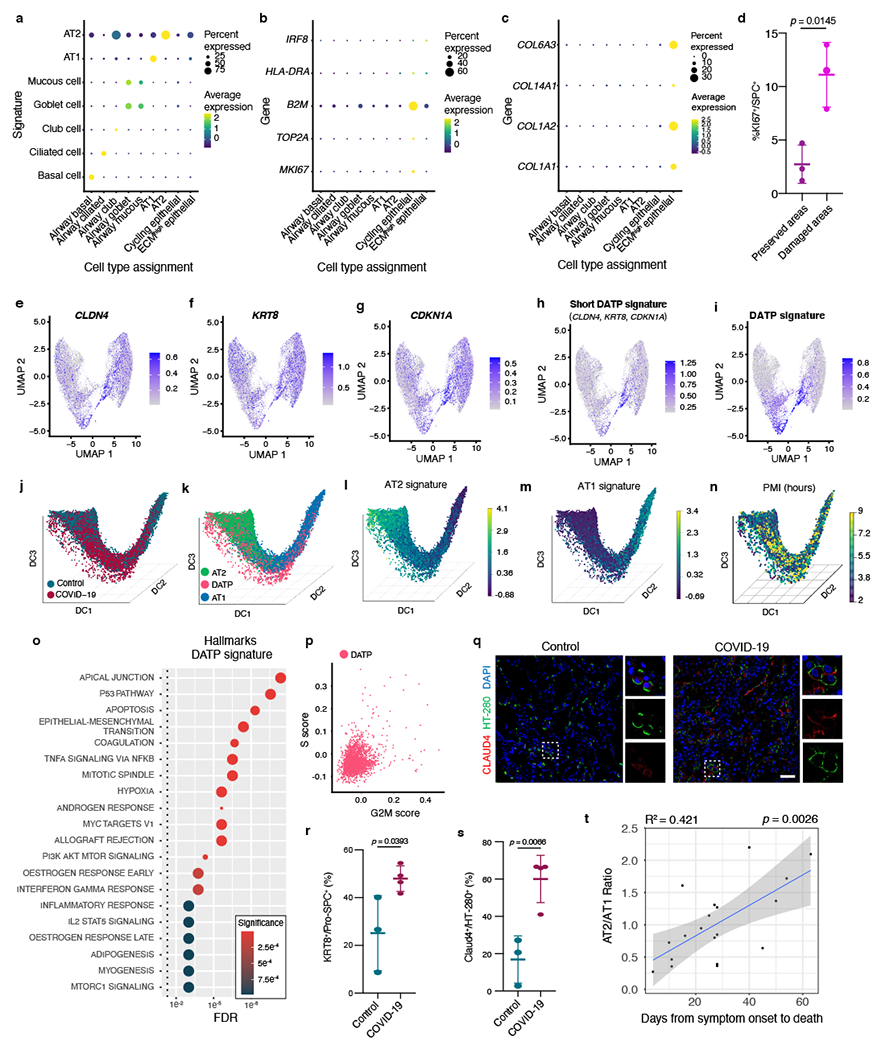
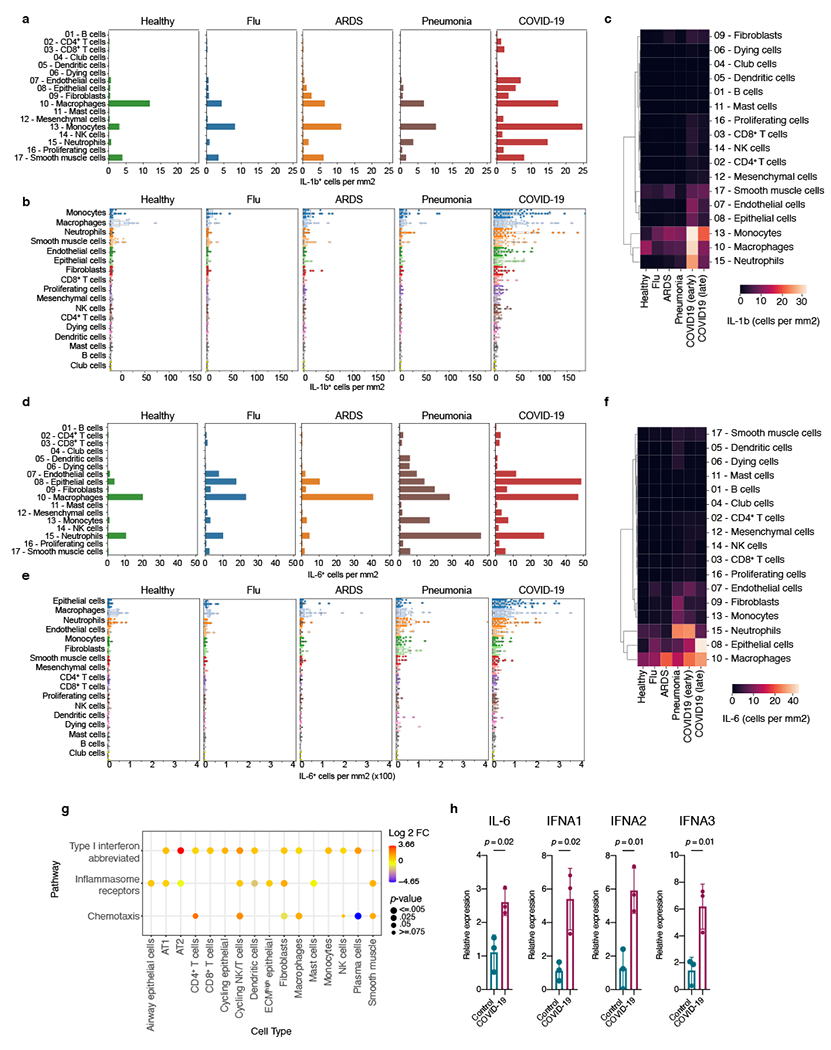
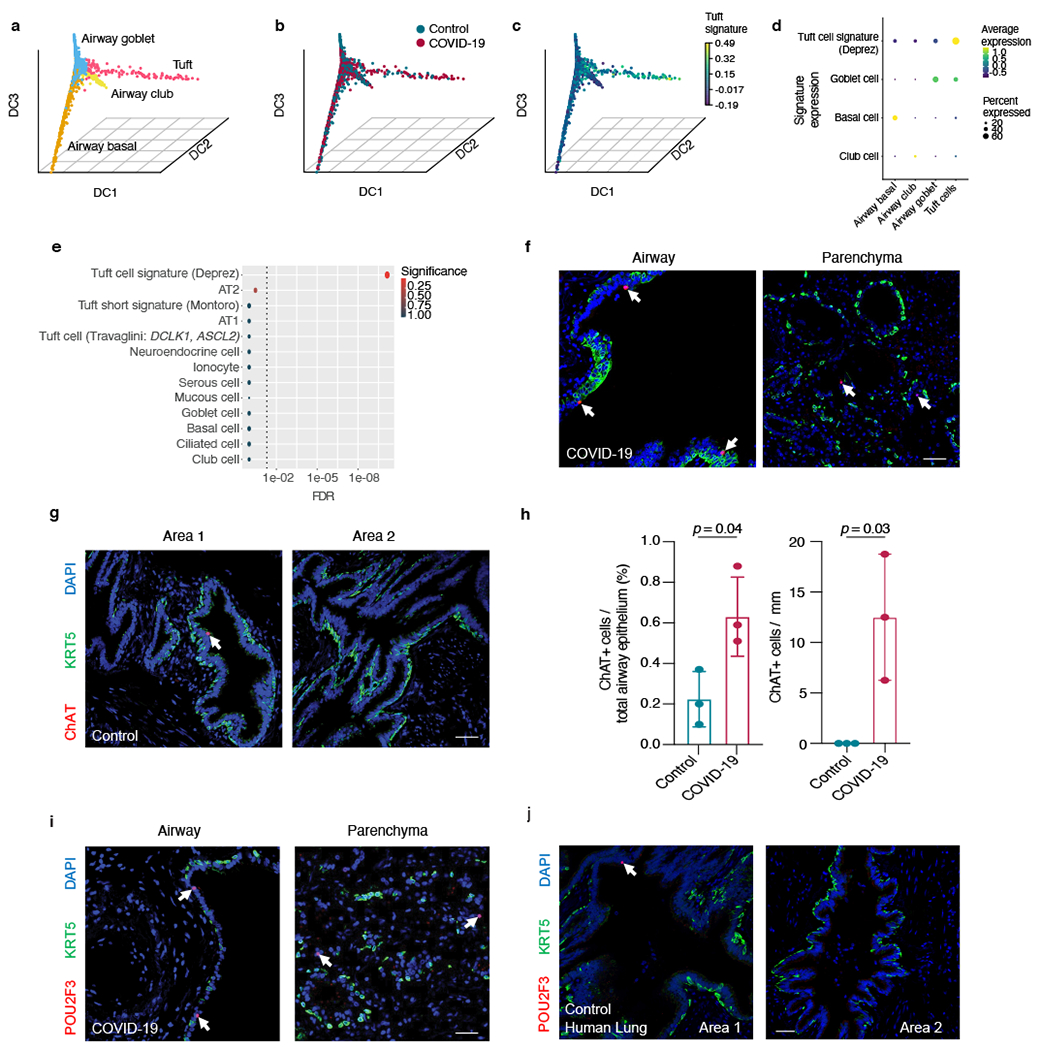
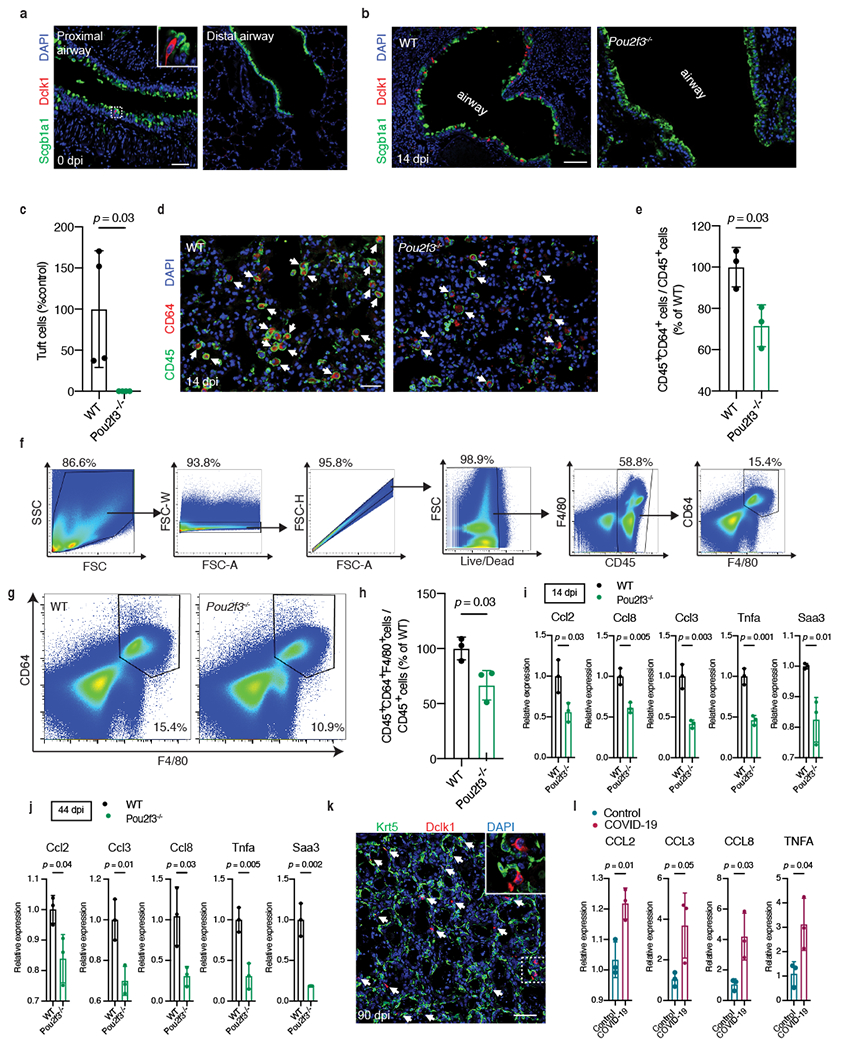
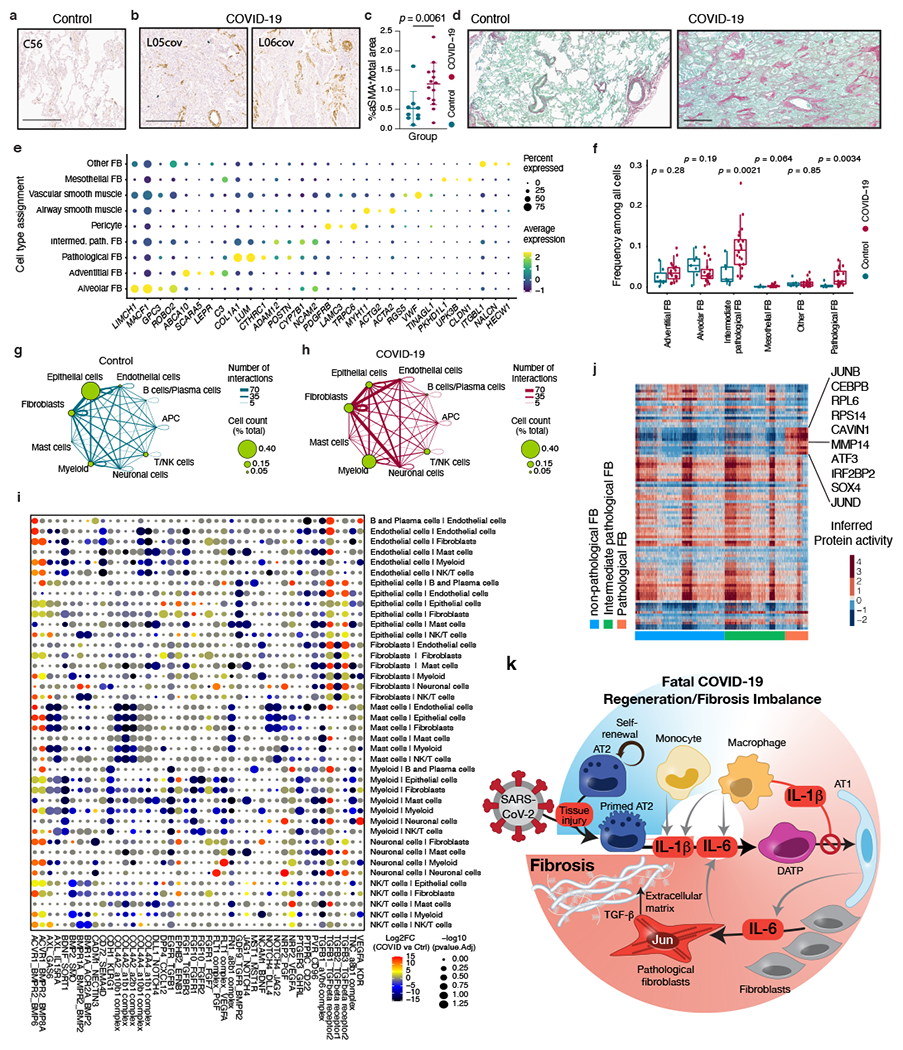
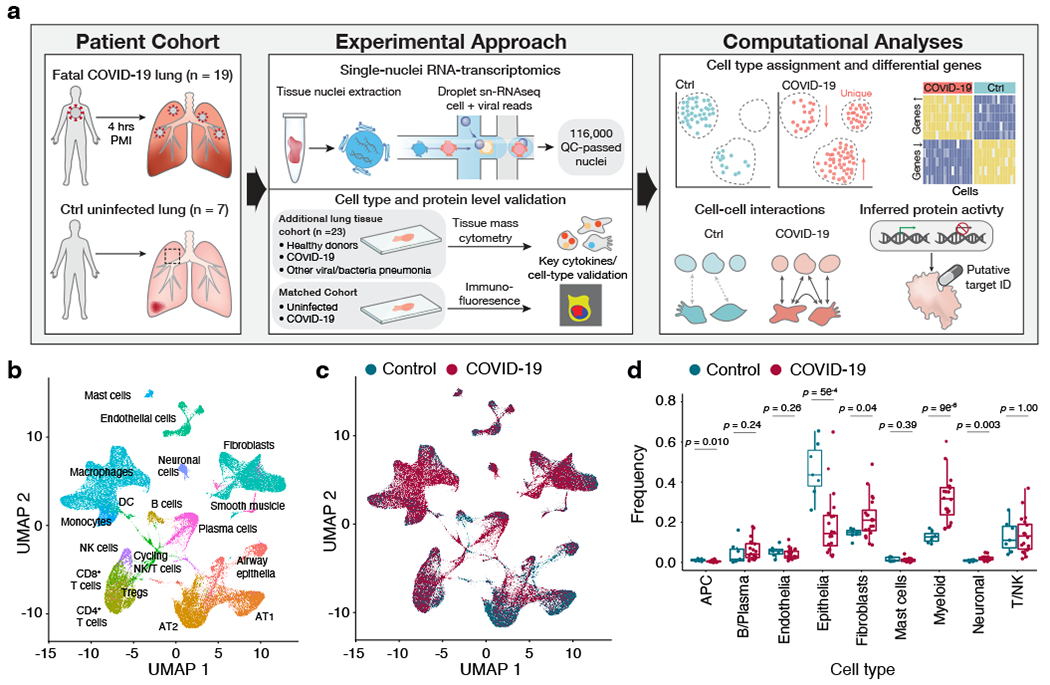
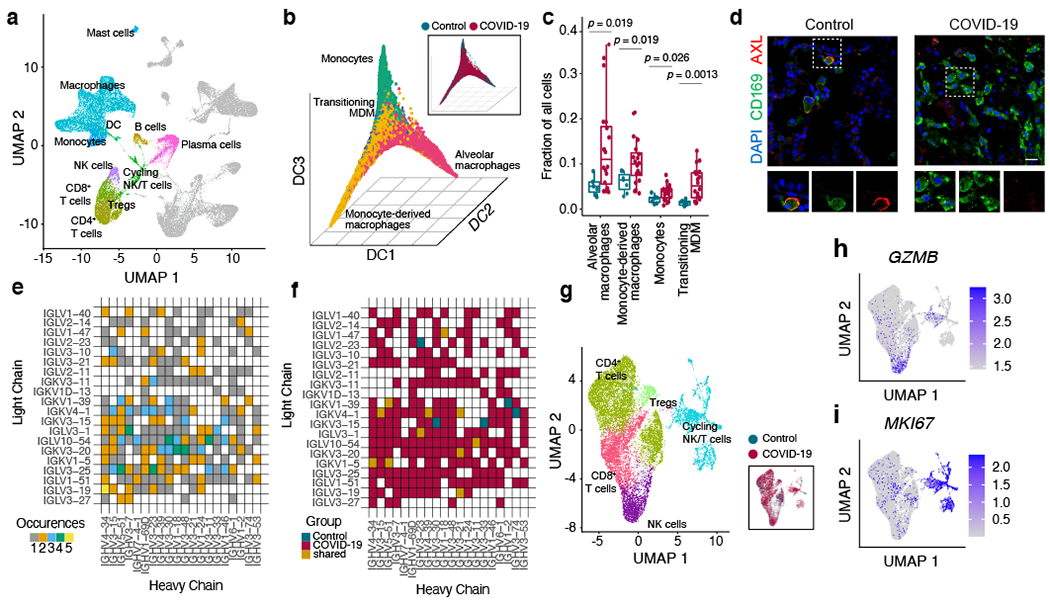
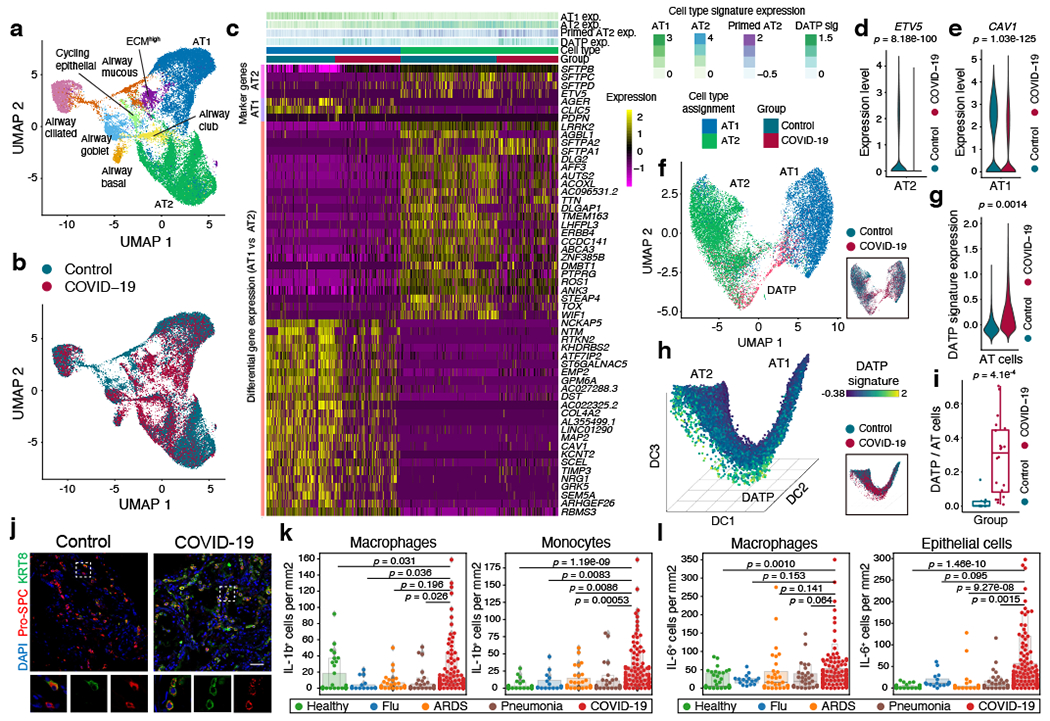
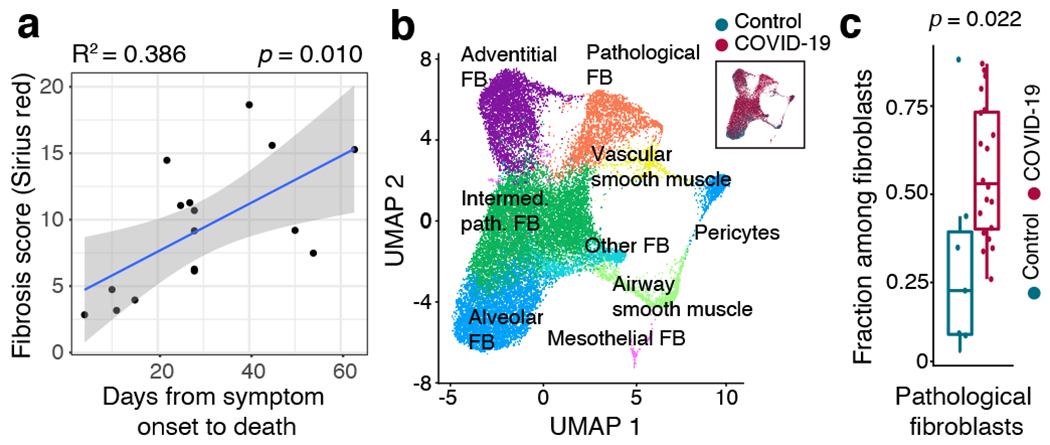
Respiratory failure is the leading cause of death in patients with severe SARS-CoV-2 infection1,2, but the host response at the lung tissue level is poorly understood. Here we performed single-nucleus RNA sequencing of about 116,000 nuclei from the lungs of nineteen individuals who died of COVID-19 and underwent rapid autopsy and seven control individuals. Integrated analyses identified substantial alterations in cellular composition, transcriptional cell states, and cell-to-cell interactions, thereby providing insight into the biology of lethal COVID-19. The lungs from individuals with COVID-19 were highly inflamed, with dense infiltration of aberrantly activated monocyte-derived macrophages and alveolar macrophages, but had impaired T cell responses. Monocyte/macrophage-derived interleukin-1β and epithelial cell-derived interleukin-6 were unique features of SARS-CoV-2 infection compared to other viral and bacterial causes of pneumonia. Alveolar type 2 cells adopted an inflammation-associated transient progenitor cell state and failed to undergo full transition into alveolar type 1 cells, resulting in impaired lung regeneration. Furthermore, we identified expansion of recently described CTHRC1+ pathological fibroblasts3 contributing to rapidly ensuing pulmonary fibrosis in COVID-19. Inference of protein activity and ligand-receptor interactions identified putative drug targets to disrupt deleterious circuits. This atlas enables the dissection of lethal COVID-19, may inform our understanding of long-term complications of COVID-19 survivors, and provides an important resource for therapeutic development.


Conflict of interest statement

Competing interests B.I. is a consultant for Merck and Volastra Therapeutics. O.E. is a scientific advisor and equity holder in Freenome, Owkin, Volastra Therapeutics and OneThree Biotech. R.E.S. is a member of the scientific advisory board of Miromatrix Inc. and is a speaker and consultant for Alnylam Inc. D.T.M. is a consultant for LASE Innovation, Inc. S.F.B. owns equity in, receives compensation from, and serves as a consultant for and on the Scientific Advisory Board and Board of Directors of Volastra Therapeutics Inc. The other authors declare no competing interests.

Figures

Extended Data Fig. 1 |
Extended Data Fig. 1 |. Patient information and alternative batch correction.
a, Basic demographics of patients with COVID-19 and control donors. *Decedents with concurrently profiled heart and/or kidney tissue in companion study. †Decedent with two independent lung specimens profiled. b, Effect of PMI on clustering. c, Cell-type labels overlaid on UMAP embedding resulting from the batch-corrected PCA matrix using Harmony (see Methods). d, Same embedding as in c with annotation of COVID-19 and control groups.
Extended Data Fig. 2 |
Extended Data Fig. 2 |. Changes in celluar composition.
a, Fraction of cell types in COVID-19 and control lungs across all cells (intermediate granularity). b, Fraction of cell types in COVID-19 and control lungs among non-immune cells only. c, Fraction of cell types in COVID-19 and control lungs among immune cells only. Control, n = 7 donors; COVID-19, n = 19 donors examined over 20 experiments. Middle line, median; box edges, 25th and 75th percentiles; whiskers, most extreme points that do not exceed ±1.5 × IQR. Wilcoxon rank-sum test.
Extended Data Fig. 3 |
Extended Data Fig. 3 |. Effect of sex on cellular composition and host receptor expression.
a, b, Cell fractions in female and male individuals for control (a; n = 7 donors) and COVID-19 lungs (b; n = 19 donors examined over 20 experiments). Middle line, median; box edges, 25th and 75th percentiles; whiskers, most extreme points that do not exceed ±1.5 × IQR. Wilcoxon rank-sum test. c, d, Log-normalized and scaled expression (see Methods) of selected receptors or putative receptors and proteases or putative proteases involved in SARS-CoV-2 entry in different cell types in control samples from female and male donors. Dot size indicates fraction of cells and colour indicates expression level. e, f, As in c, d for from COVID-19 lungs.
Extended Data Fig. 4 |
Extended Data Fig. 4 |. Global changes in myeloid cells.
a, Quantification of cells with CD163+ staining as percentage of all cells in a subset of control and COVID-19 samples (n = 4 donors per group). Mean ± s.d., t-test. b, c, UMAP embedding with myeloid cell type assignment (b) and group assignment (c). df, Expression scores (log-normalized) for monocyte, macrophage and alveolar macrophage signatures in same UMAP embedding as b, c. g, First three DCs with annotation of control and COVID-19 lung samples. h, First three DCs with expression of the alveolar macrophage signature. i, Heatmap of top differentially regulated genes among indicated myeloid sub-populations. Left bar indicates genes that were differentially regulated in the respective cell types. Top lanes indicate cell type and group. Rows indicate log-normalized and scaled expression of genes (see Methods).
Extended Data Fig. 5 |
Extended Data Fig. 5 |. Differential gene expression in alveolar macrophages.
a, Heatmap of top differentially regulated genes (log-normalized and centred, see Methods) among indicated alveolar macrophages in COVID-19 and control samples. Top lane indicates cell type and group. Rows indicate expression of genes. b, Violin plot of AXL expression (log-normalized) in alveolar macrophages from controls and COVID-19 tissues. Wilcoxon rank-sum test with Bonferroni adjusted P value indicated on top. c, Expression of AXL (log-normalized) among major cell types. Expression of this gene was nearly exclusive to fibroblasts and myeloid and epithelial cells.
Extended Data Fig. 6 |
Extended Data Fig. 6 |. Inferred immunoglobulins in plasma cells
a, b, UMAP embedding of cells within the B/plasma cell cluster (a) and corresponding group assignment (b). c, Selected genes that define cells within the B/plasma cell cluster. Dot size indicates fraction of cells and colour indicates log-normalized and scaled expression level (see Methods). d, Heatmap illustrating the number of cells with combinations of variable heavy (x-axis) and light (y-axis) chains recovered in plasma cells across all patients. Average linkage was used for hierarchical clustering analysis. The colour of each square indicates the number of cells detected for each specific pair (colour key). e, As in d, but indicating the number of control samples with each combination detected (Supplementary Table 6). f, As in e, but indicating isotype usage in control donors alone (Supplementary Table 6). g, As in e, but demonstrating isotype usage in patients with COVID-19 (corresponding to Fig. 3e, f; shown are the top 20 commbinations; complete list in Supplementary Table 6). h, Frequency (y-axis) of variable heavy chains (x-axis) in COVID-19 and control samples. i, As in h, but for variable light chain usage. j, Frequency (y-axis) of variable heavy chains (x-axis) on a per-donor basis. k, As in j, but for variable light chain usage. l, Exemplary H&E-stained image (n = 19 donors evaluated) with coloured outlines indicating different immune cell types. Scale bar, 100 μm. m, C4d immunohistochemistry in representative control (left) and COVID-19 (right) samples (n = 6 donors per group). Scale bar, 100 μm.
Extended Data Fig. 7 |
Extended Data Fig. 7 |. Activation, residency and dysfunction cell states in T cells.
a, Expression of selected genes in cells of the T/NK cell compartment. Dot size indicates fraction of cells and colour indicates expression level. b, Quantification of cells with CD4+ staining as percentage of all cells (y-axis) in control and COVID-19 lungs (n = 4 donors per group). c, As in b, but for CD8+ T cells. Mean ± s.d., t-test. dg, Expression of different program scores (tissue residency memory program, activation score, memory score and exhaustion score, all from K.S.P. Devi et al., see Methods) in CD4+ T cells (left) and CD8+ T cells (right) among control donors and individuals with COVID-19. Middle line, median; box edges, 25th and 75th percentiles; whiskers, most extreme points that do not exceed ±1.5 × IQR. Wilcoxon rank-sum test. Cohen’s D is indicated between the whiskers for each comparison (COVID-19 versus control). h, Quantification of CD4+GZMB+ T cells as percentage of CD4+ T cells (y-axis) in control and COVID-19 lungs (n = 4 donors per group). i, As in h, but for CD8+ T cells. Mean ± s.d., t-test. j, k, Representative multiplexed immunofluorescence of lung tissue from a patient with COVID-19 with a pure myeloid infiltrate (j) or with a mixed myeloid and lymphoid infiltrate (k; n = 4 donors per group). Scale bars, 200 μm.
Extended Data Fig. 8 |
Extended Data Fig. 8 |. DATPs and lung regeneration.
a, Expression of selected, previously established cell-type-specific signatures (y-axis) in cell types defined in this study (x-axis). Dot size indicates fraction of cells and colour indicates expression level. b, c, Expression of selected genes (y-axis) in different cell types (x-axis), highlighting high expression of B2M in cycling epithelial cells (b) and collagen genes in ECMhigh epithelial cells (c). d, Fraction of KI67+ cells among pro-SPC+ cells in structurally preserved versus damaged areas (n = 3 distinct areas each) from a COVID-19 lung. Mean ± s.d., t-test. eg, UMAP embedding of alveolar epithelium and expression of selected genes that define the DATP signature. h, Composite expression of the three-gene DATP signature. i, Expression of the refined DATP signature (see Methods). jn, First three DCs showing group assignment (j), cell or cell-state assignment (k), expression of AT2 signature (l), AT1 signature (m; log-normalized, see Methods), and effect of PMI (n). o, Gene set enrichment analysis in DATPs (compared to AT1 and AT2 cells). Rows indicate pathways in descending order of enrichment or significance (see key); x-axis indicates FDR. p, Inference of G2/M and S phase of individual DATPs (dots) (see Methods). q, Representative immunofluorescence staining (DATP marker CLDN4 and AT2 cell marker HTII-280) in control and COVID-19 lung tissue sections. Dashed boxes indicate areas highlighted to the right of each image. Scale bar, 50 μm. r, s, Quantification of KRT8+ (r) and CLDN4+ (s) cells in a subset of tissue sections from control and COVID-19 lungs. Mean ± s.d., t-test. qs, Control, n = 3 donors; COVID-19, n = 4 donors. t, Coefficient of determination (R) of days from symptom onset to death and AT2/AT1 ratio. Error bands, 95% standard error interval on the Pearson correlation (n = 18 donors).
Extended Data Fig. 9 |
Extended Data Fig. 9 |. Cellular sources of inflammatory cytokines.
a, Average frequency of cell types expressing IL-1β across healthy and disease conditions. b, Quantification of IL-1β across cell types in healthy and disease conditions. Each dot represents a single region of interest (ROI). c, Quantification of IL-1β across healthy and disease conditions and cell types, including separation of patients with early death (within 14 days of onset of COVID-19 symptoms) and late death (within 30 days of onset of COVID-19 symptoms). d, Average frequency of cell types expressing IL-6 across healthy and disease conditions. e, Quantification of IL-6 across cell types in healthy and disease conditions. Each dot represents a single region of interest (ROI). f, Quantification of IL-6 across across healthy and disease conditions and cell types, including separation of patients with early death (within 14 days of onset of COVID-19 symptoms) and late death (within 30 days of onset of COVID-19 symptoms). g, Expression of selected manually curated gene sets of chemotaxis, inflammasome receptors and type I interferon (response) genes across different cell types (y-axis). Dot size indicates significance and colour indicates expression level (log2(fold-change)). h, qRT–PCR comparing IFNA1, IFNA2, IFNB1, and IL-6 mRNA levels in COVID-19 and control lungs (n = 3 donors for each group). Mean ± s.d., t-test.
Extended Data Fig. 10 |
Extended Data Fig. 10 |. Identification of ectopic tuft-like cells.
ac, First three DCs of airway epithelial cells with group annotation with cell-type assignment (a), group assignment (b) and indicating expression of tuft cell signature (c) in the same projections. d, Expression of previously established signatures identifying cell types in cell types assigned in this study. Dot size indicates fraction of cells and colour indicates expression level (log-normalized and scaled, see Methods). e, Expression of selected cell-type-specific signatures of airway and alveolar epithelium from previous studies in cells identified as tuft-like cells in this study. Signatures in descending order of enrichment or significance. Colour indicates significance. f, g, Representative immunofluorescence staining of control lungs (f; two areas) and COVID-19 (g; airway and parenchyma) for KRT5 and CHAT. Arrows indicate CHAT+ cells. Scale bar, 50 μm. h, Quantification of CHAT+ cells in the upper airway epithelium of control and COVID-19 lungs. Mean ± s.d., t-test. i, Quantification of CHAT+ cells in the alveolar epithelium of control and COVID-19 lungs. Mean ± s.d., t-test. j, k, Immunofluorescence staining for KRT5 and POU2F3 of control lungs (j) and COVID-19 lungs (k), including upper airway (left) and parenchyma (right). White arrows indicate POU2F3+ cells. Scale bars, 50 μm. fk, n = 3 donors per group.
Extended Data Fig. 11 |
Extended Data Fig. 11 |. Role of tuft cells in macrophage infiltration in mouse viral pneumonia model.
a, Immunofluorescence staining for SCGB1A1 and DCLK1 of proximal (left) and distal (right) airway from wild-type (WT) mice at baseline. n = 3 mice per group. Arrow, DCLK1+ cell. Scale bar, 50 μm. b, As in a, but in wild-type (left) and Pou2f3−/− mice 14 days after infection with H1N1 (PR8). c, Quantification of tuft cells as percentage of DCLK1+ cells in Pou2f3−/− compared to wild-type mice. Mean ± s.d., t-test. b, c, n = 4 mice per group. d, Immunofluorescence staining for CD45 and CD64 of lung parenchyma from wild-type (left) and Pou2f3−/− (right) mice 14 days after infection with H1N1 (PR8). Arrows indicate CD45+CD64+ macrophages. Scale bar, 50 μm. e, Quantification (CD45+CD64+ cells among CD45+ cells) as percentage in Pou2f3−/− mice compared to wild-type mice 14 days after infection with H1N1. Mean ± s.d., t-test. d, e, n = 3 mice per group. f, Gating strategy to identify CD45+CD64+F4/80+ cells. g, Identification of CD64+F4/80+ cells (based on gating strategy in f) in wild-type (left) and Pou2f3−/− mice (right) 14 days after infection with H1N1. h, Quantification of flow-cytometric determination of CD45+CD64+F4/80+ cells as percentage of CD45+ cells in Pou2f3−/− relative to wild-type mice (n = 3 per group). Mean ± s.d., t-test. i, qRT–PCR comparing relative mRNA expression of indicated chemokines and cytokines in Pou2f3−/− and wild-type mice 14 days after infection with H1N1 (n = 3 per group). Mean ± s.d., t-test. j, As in i, but 44 days after infection with H1N1(n = 3 per group). k, Exemplary immunofluorescence staining (n = 3 mice per group) for KRT5 and DCLK1 in wild-type mouse 90 days after infection. Arrows indicate DCLK1+ cells. Scale bar, 50 μm. l, As in i, j, but comparing expression of indicated chemokines and cytokines in control donors and patients with COVID-19 (n = 3 donors per group). Mean ± s.d., t-test.
Extended Data Fig. 12 |
Extended Data Fig. 12 |. Role of fibroblasts, potential drug targets and model of lethal COVID-19.
a, b, Exemplary αSMA immunohistochemical staining of tissue from control (a; sample C56; n = 7 donors) and COVID-19 samples (b; samples L05cov and L06cov; n = 17 donors). Scale bars, 500 μm. c, Percentage of α-SMA+ cells per total area (n as in a, b). Mean ± s.d., t-test. d, Exemplary Sirius red staining of control (left, n as in a) and COVID-19 (right, n as in b) samples. Scale bar, 600 μm. e, Detailed annotation of fibroblasts in this study and selected marker genes. Dot size indicates fraction of cells and colour indicates expression level (log-normalized and scaled). f, Fractions of cell types among all cells in COVID-19 (n = 19 donors examined over 20 experiments) and control lungs (n = 7 donors). Middle line, median; box edges, 25th and 75th percentiles; whiskers, most extreme points that do not exceed ±1.5 × IQR. Wilcoxon rank-sum test. g, h, Inferred cell-to-cell interactions among major cell types (indicated as circles connected by lines) in control (g) and COVID-19 (h) lung samples. The size of the circle corresponds to the frequency of the respective cell type and the thickness of the lines connecting circles indicates the absolute number of interactions. i, Differential enrichment (COVID-19 versus control samples) of specific ligand–receptor interactions (rows) between two different cell types (columns). Dot colour indicates log2(fold-change) of inferred ligand–receptor expression in COVID-19 compared to control lungs (unpaired two-sided Wilcoxon rank-sum test); dot size is inversely correlated with Benjamini–Hochberg adjusted P (see Methods). j, Inferred protein activity (rows) among cells corresponding to pathological fibroblasts, intermediate pathological fibroblasts, and non-pathological fibroblasts (columns). Proteins with high activity in pathological fibroblasts are highlighted. k, Model summarizing potential mechanisms that contribute to morbidity and mortality in patients with COVID-19, focusing on impaired cellular regeneration and rapidly ensuing fibrosis.
Fig. 1 |
Fig. 1 |. Study design and cellular landscape.
a, Overview of study design. b, Major clusters and respective cell-type assignments in UMAP. c, Origins of cells with same embedding as in b. d, Fraction of major cell types in control (n = 7) and COVID-19 lungs (n = 19). Middle line, median; box edges, 25th and 75th percentiles; whiskers, most extreme points that do not exceed ±1.5× the interquartile range (IQR). Wilcoxon rank-sum test.
Fig. 2 |
Fig. 2 |. Immune responses in COVID-19.
a, UMAP projection highlighting immune cell clusters. b, Visualization of myeloid cells using the first three DCs. Insert indicates group assignment. c, Fraction of myeloid cells in control (n = 7) and COVID-19 lungs (n = 19). Middle line, median; box edges, 25th and 75th percentiles; whiskers: most extreme points that do not exceed ±1.5 × IQR. Wilcoxon rank-sum test. d. Representative immunofluorescence staining for CD169, AXL and DAPI (large image) in control and COVID-19 lung tissue; top, selected area with overlay; bottom, individual channels. Scale bar, 20 μm. e, f, Top 20 recurrently detected IGHVIGLV combinations in COVID-19 (e) and corresponding group annotation (f). *Combination for previously described anti-RBD antibody. g, UMAP of T/NK cells; insert, group assignments. h, i, RNA expression (log-normalized) of GZMB (h) and MKI67 (i) in the same embedding as g.
Fig. 3 |
Fig. 3 |. Impaired lung regeneration and sources of inflammation.
a, b, UMAP of investigated alveolar and airway epithelial cells (a) and corresponding group assignments (b). c, Differential gene expression (log-normalized, scaled; see Methods) of AT1 and AT2 cells from COVID-19 and control lungs. Columns, single cells; rows, expression of top-regulated genes. Left bar, lineage markers for AT1 (purple) and AT2 (pink) cells. Colour-coded top lanes indicate expression strength of signatures (log-normalized; see Methods) and group assignment as indicated on the right. exp., expression. d, e, Violin plots of ETV5 and CAV1 mRNA expression (log-normalized) in AT2 and AT1 cells, respectively; Wilcoxon signed-rank test with Bonferroni correction. f, UMAP embedding of AT1 and AT2 cells and identified DATPs; insert indicates group assignments. g, Violin plots of DATP signature expression (log-normalized) in AT1 and AT2 cells. Wilcoxon singed-rank test. h, First three DCs showing main trajectories of AT2 and AT1 cells and DATPs, expression of DATP signature and group assignment (insert). i, Fractions of DATP and AT cells in control (n = 7) and COVID-19 lungs (n = 19). Middle line, median; box edges, 25th and 75th percentiles; whiskers, most extreme points that do not exceed ±1.5 × IQR. Wilcoxon rank-sum test. j, Representative immunofluorescence staining for pro-SPC, KRT8 and DAPI in control and COVID-19 lung tissue; top, representative area with overlay; bottom, small images with individual channels of selected area. Scale bar, 50 μm. k, l, Tissue mass cytometric quantification of IL-1β (k) and IL-6 (l) in healthy lung tissue and samples from donors with different infectious aetiologies. Each dot represents quantification of IL-1β and IL-6 in a region of interest (ROI); two-sided Mann–Whitney test with Benjamini–Hochberg false discovery rate (FDR) adjustment.
Fig. 4 |
Fig. 4 |. Pathological fibroblasts and ensuing fibrosis in COVID-19.
a, Coefficient of determination (R2) of days from symptom onset to death and fibrosis score in COVID-19 samples (n = 16, see Methods). Error bands, 95% s.e. interval on the Pearson correlation. b, UMAP of fibroblast (FB) sub-populations; insert indicates group assignments. path., pathological. c, Fractions of pathological fibroblasts among all fibroblasts in control (n = 7) and COVID-19 lungs (n = 19). Middle line, median; box edges, 25th and 75th percentiles; whiskers, most extreme points that do not exceed ±1.5 × IQR. Wilcoxon rank-sum test.

Comment in

Similar articles

  • COVID-19 tissue atlases reveal SARS-CoV-2 pathology and cellular targets.
    Delorey TM, Ziegler CGK, Heimberg G, Normand R, Yang Y, Segerstolpe Å, Abbondanza D, Fleming SJ, Subramanian A, Montoro DT, Jagadeesh KA, Dey KK, Sen P, Slyper M, Pita-Juárez YH, Phillips D, Biermann J, Bloom-Ackermann Z, Barkas N, Ganna A, Gomez J, Melms JC, Katsyv I, Normandin E, Naderi P, Popov YV, Raju SS, Niezen S, Tsai LT, Siddle KJ, Sud M, Tran VM, Vellarikkal SK, Wang Y, Amir-Zilberstein L, Atri DS, Beechem J, Brook OR, Chen J, Divakar P, Dorceus P, Engreitz JM, Essene A, Fitzgerald DM, Fropf R, Gazal S, Gould J, Grzyb J, Harvey T, Hecht J, Hether T, Jané-Valbuena J, Leney-Greene M, Ma H, McCabe C, McLoughlin DE, Miller EM, Muus C, Niemi M, Padera R, Pan L, Pant D, Pe'er C, Pfiffner-Borges J, Pinto CJ, Plaisted J, Reeves J, Ross M, Rudy M, Rueckert EH, Siciliano M, Sturm A, Todres E, Waghray A, Warren S, Zhang S, Zollinger DR, Cosimi L, Gupta RM, Hacohen N, Hibshoosh H, Hide W, Price AL, Rajagopal J, Tata PR, Riedel S, Szabo G, Tickle TL, Ellinor PT, Hung D, Sabeti PC, Novak R, Rogers R, Ingber DE, Jiang ZG, Juric D, Babadi M, Farhi SL, Izar B, Stone JR, Vlachos IS, Solomon IH, Ashenberg O, Porter CBM, Li B, Shalek AK, Villani AC, Rozenblatt-Rosen O, Regev A. Delorey TM, et al. Nature. 2021 Jul;595(7865):107-113. doi: 10.1038/s41586-021-03570-8. Epub 2021 Apr 29. Nature. 2021. PMID: 33915569 Free PMC article.
  • Pneumocytes are distinguished by highly elevated expression of the ER stress biomarker GRP78, a co-receptor for SARS-CoV-2, in COVID-19 autopsies.
    Puzyrenko A, Jacobs ER, Sun Y, Felix JC, Sheinin Y, Ge L, Lai S, Dai Q, Gantner BN, Nanchal R, North PE, Simpson PM, Rui H, Benjamin IJ. Puzyrenko A, et al. Cell Stress Chaperones. 2021 Sep;26(5):859-868. doi: 10.1007/s12192-021-01230-4. Epub 2021 Aug 12. Cell Stress Chaperones. 2021. PMID: 34382151 Free PMC article.
  • Single-cell RNA sequencing reveals SARS-CoV-2 infection dynamics in lungs of African green monkeys.
    Speranza E, Williamson BN, Feldmann F, Sturdevant GL, Pérez-Pérez L, Meade-White K, Smith BJ, Lovaglio J, Martens C, Munster VJ, Okumura A, Shaia C, Feldmann H, Best SM, de Wit E. Speranza E, et al. Sci Transl Med. 2021 Jan 27;13(578):eabe8146. doi: 10.1126/scitranslmed.abe8146. Epub 2021 Jan 11. Sci Transl Med. 2021. PMID: 33431511 Free PMC article.
  • Modulation of Host Immune Response Is an Alternative Strategy to Combat SARS-CoV-2 Pathogenesis.
    Singh L, Bajaj S, Gadewar M, Verma N, Ansari MN, Saeedan AS, Kaithwas G, Singh M. Singh L, et al. Front Immunol. 2021 Jul 8;12:660632. doi: 10.3389/fimmu.2021.660632. eCollection 2021. Front Immunol. 2021. PMID: 34305892 Free PMC article. Review.
  • Prospective postmortem evaluation of 735 consecutive SARS-CoV-2-associated death cases.
    Fitzek A, Schädler J, Dietz E, Ron A, Gerling M, Kammal AL, Lohner L, Falck C, Möbius D, Goebels H, Gerberding AL, Schröder AS, Sperhake JP, Klein A, Fröb D, Mushumba H, Wilmes S, Anders S, Kniep I, Heinrich F, Langenwalder F, Meißner K, Lange P, Zapf A, Püschel K, Heinemann A, Glatzel M, Matschke J, Aepfelbacher M, Lütgehetmann M, Steurer S, Thorns C, Edler C, Ondruschka B. Fitzek A, et al. Sci Rep. 2021 Sep 29;11(1):19342. doi: 10.1038/s41598-021-98499-3. Sci Rep. 2021. PMID: 34588486 Free PMC article.

Cited by

References

    1. Dong Y et al. Epidemiology of COVID-19 among children in china. Pediatrics 145, e20200702 (2020). - PubMed
    1. Zhou F et al. Clinical course and risk factors for mortality of adult inpatients with COVID-19 in Wuhan, China: a retrospective cohort study. Lancet 395, 1054–1062 (2020). - PMC - PubMed
    1. Tsukui T et al. Collagen-producing lung cell atlas identifies multiple subsets with distinct localization and relevance to fibrosis. Nat. Commun. 11, 1920 (2020). - PMC - PubMed
    1. Bellani G et al. Epidemiology, patterns of care, and mortality for patients with acute respiratory distress syndrome in intensive care units in 50 countries. J. Am. Med. Assoc. 315, 788–800 (2016). - PubMed
    1. Muus C et al. Single-cell meta-analysis of SARS-CoV-2 entry genes across tissues and demographics. Nat. Med. 27, 546–559 (2021). - PMC - PubMed

Publication types

MeSH terms