. 2021 Jul;595(7865):107-113.
doi: 10.1038/s41586-021-03570-8. Epub 2021 Apr 29.

COVID-19 tissue atlases reveal SARS-CoV-2 pathology and cellular targets

Toni M Delorey #  1 Carly G K Ziegler #  2   3   4   5   6   7 Graham Heimberg #  1 Rachelly Normand #  2   8   9   10   11 Yiming Yang #  1   8 Åsa Segerstolpe #  1 Domenic Abbondanza #  1 Stephen J Fleming #  12   13 Ayshwarya Subramanian #  1 Daniel T Montoro #  2 Karthik A Jagadeesh #  1 Kushal K Dey #  14 Pritha Sen #  2   8   15   16 Michal Slyper #  1 Yered H Pita-Juárez #  2   10   17   18   19 Devan Phillips #  1 Jana Biermann #  20   21 Zohar Bloom-Ackermann  22 Nikolaos Barkas  12 Andrea Ganna  23   24 James Gomez  22 Johannes C Melms  20   21 Igor Katsyv  25 Erica Normandin  2   10 Pourya Naderi  10   17   18 Yury V Popov  10   26   27 Siddharth S Raju  2   28   29 Sebastian Niezen  10   26   27 Linus T-Y Tsai  2   10   26   30   31 Katherine J Siddle  2   32 Malika Sud  1 Victoria M Tran  22 Shamsudheen K Vellarikkal  2   33 Yiping Wang  20   21 Liat Amir-Zilberstein  1 Deepak S Atri  2   33 Joseph Beechem  34 Olga R Brook  35 Jonathan Chen  2   36 Prajan Divakar  34 Phylicia Dorceus  1 Jesse M Engreitz  2   37 Adam Essene  26   30   31 Donna M Fitzgerald  38 Robin Fropf  34 Steven Gazal  39 Joshua Gould  1   12 John Grzyb  40 Tyler Harvey  1 Jonathan Hecht  10   17 Tyler Hether  34 Judit Jané-Valbuena  1 Michael Leney-Greene  2 Hui Ma  1   8 Cristin McCabe  1 Daniel E McLoughlin  38 Eric M Miller  34 Christoph Muus  2   41 Mari Niemi  23 Robert Padera  40   42   43 Liuliu Pan  34 Deepti Pant  26   30   31 Carmel Pe'er  1 Jenna Pfiffner-Borges  1 Christopher J Pinto  16   38 Jacob Plaisted  40 Jason Reeves  34 Marty Ross  34 Melissa Rudy  2 Erroll H Rueckert  34 Michelle Siciliano  40 Alexander Sturm  22 Ellen Todres  1 Avinash Waghray  44   45 Sarah Warren  34 Shuting Zhang  22 Daniel R Zollinger  34 Lisa Cosimi  46 Rajat M Gupta  2   33 Nir Hacohen  2   9   47 Hanina Hibshoosh  25 Winston Hide  10   17   18   19 Alkes L Price  14 Jayaraj Rajagopal  38 Purushothama Rao Tata  48 Stefan Riedel  10   17 Gyongyi Szabo  2   10   26 Timothy L Tickle  1   12 Patrick T Ellinor  49 Deborah Hung  22   50   51 Pardis C Sabeti  2   32   52   53   54 Richard Novak  55 Robert Rogers  26   56 Donald E Ingber  41   55   57 Z Gordon Jiang  10   26   27 Dejan Juric  16   38 Mehrtash Babadi  12   13 Samouil L Farhi  1 Benjamin Izar  20   21   58   59 James R Stone  36 Ioannis S Vlachos  60   61   62   63   64 Isaac H Solomon  40 Orr Ashenberg  1 Caroline B M Porter  1 Bo Li  1   8   16 Alex K Shalek  65   66   67   68   69   70   71   72   73   74   75 Alexandra-Chloé Villani  76   77   78   79 Orit Rozenblatt-Rosen  80   81 Aviv Regev  82   83   84   85
Affiliations

COVID-19 tissue atlases reveal SARS-CoV-2 pathology and cellular targets

Toni M Delorey et al. Nature. 2021 Jul.

Abstract

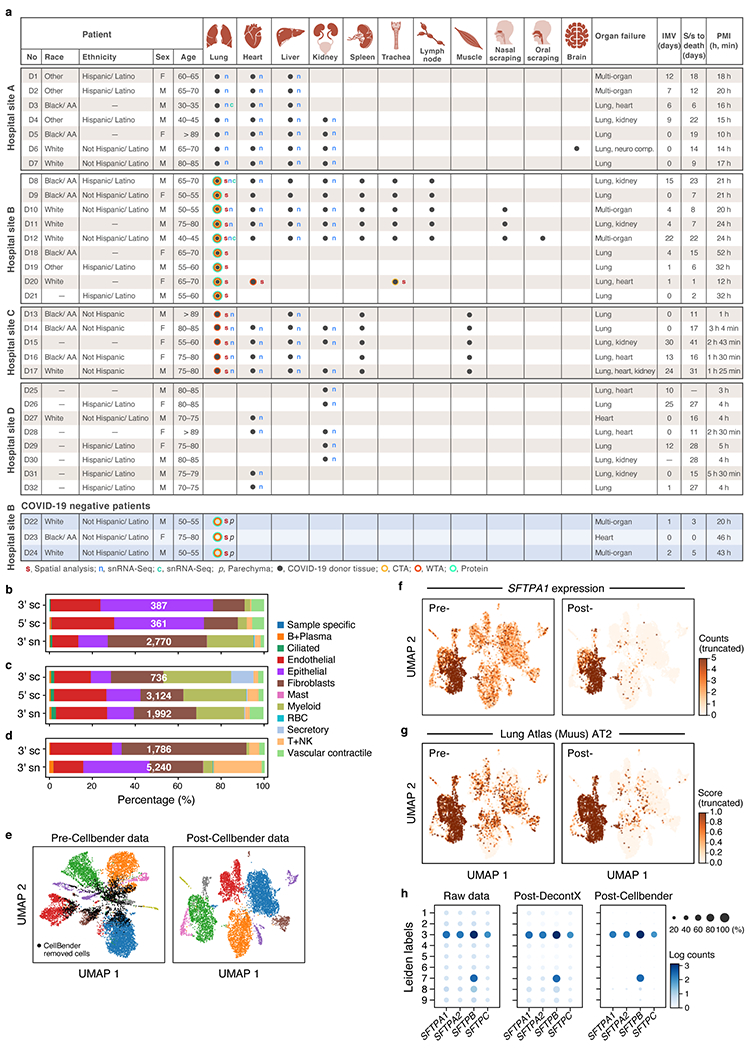
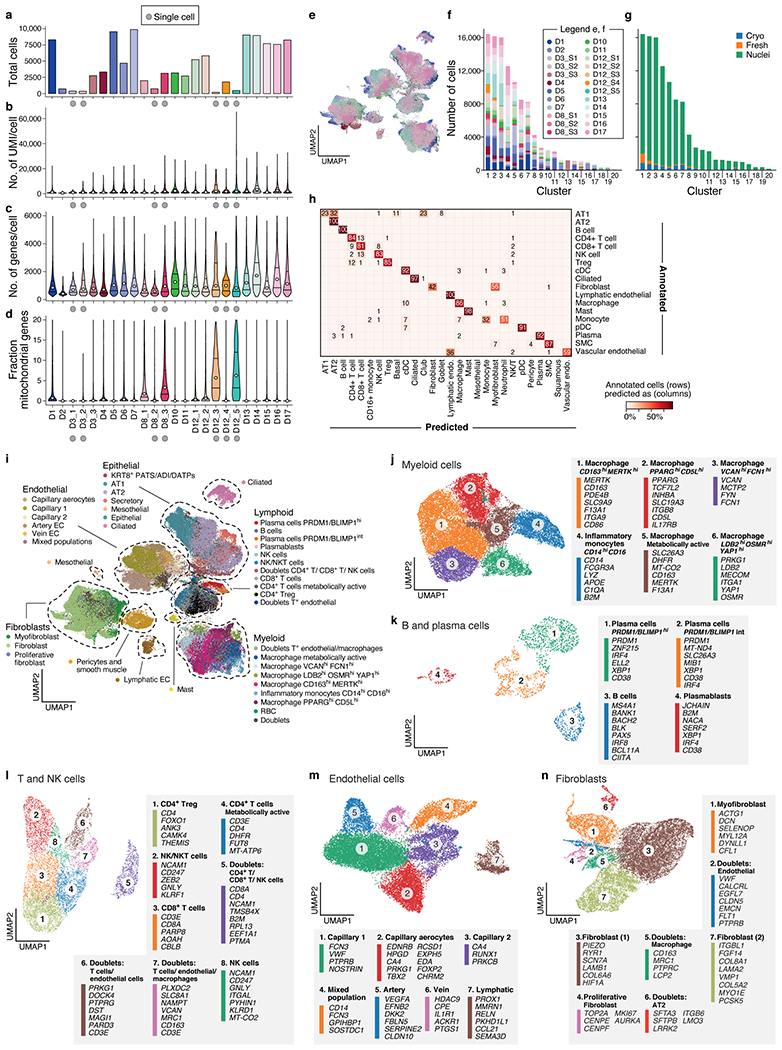
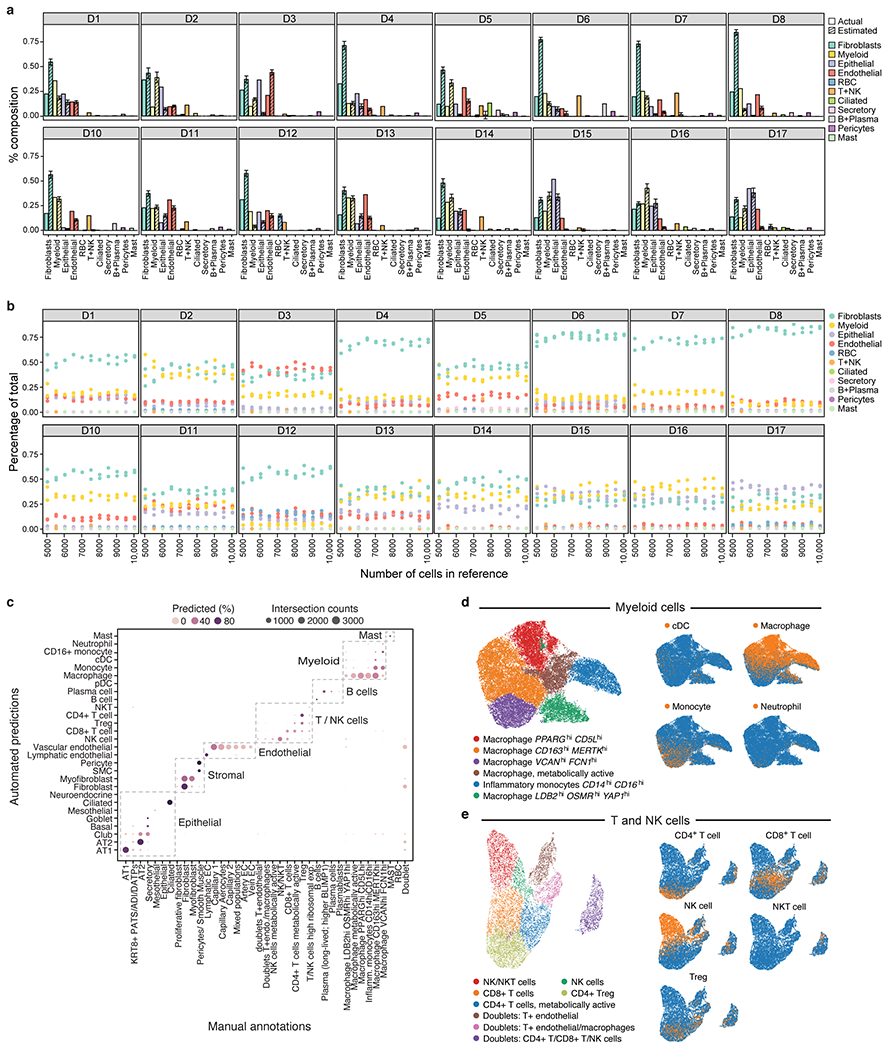
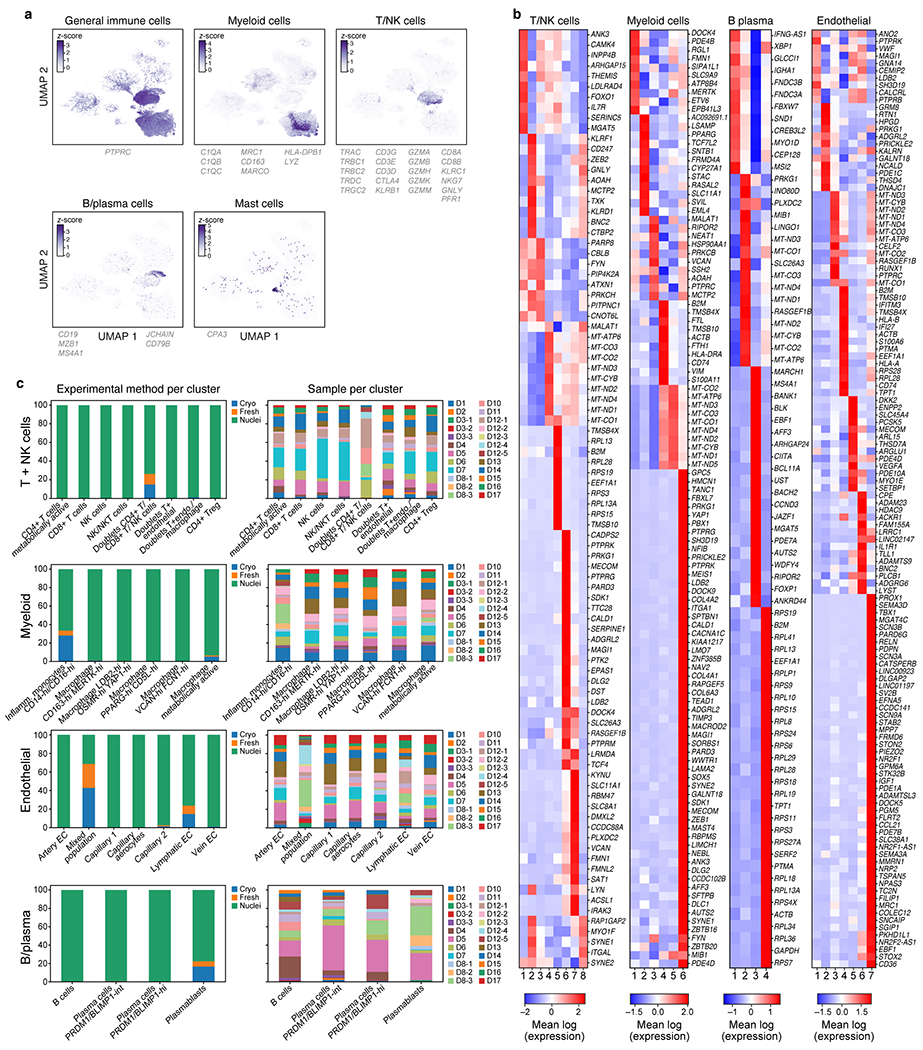
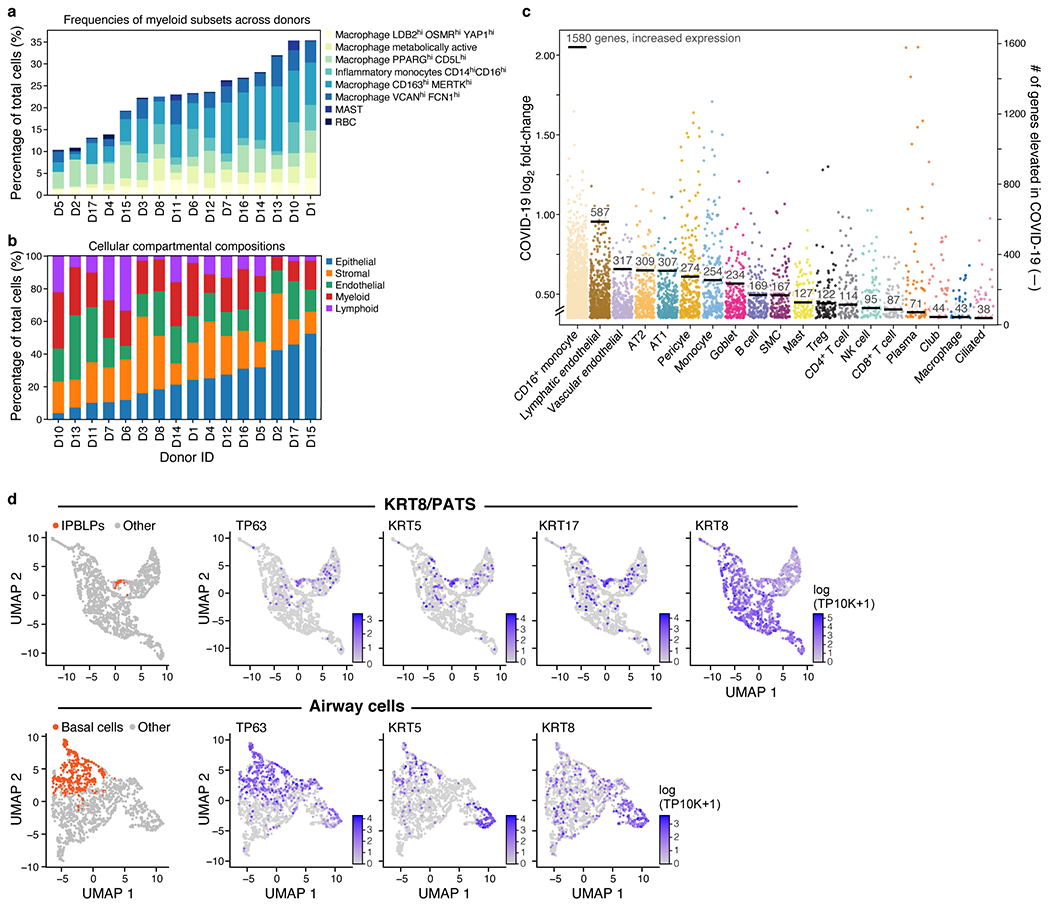
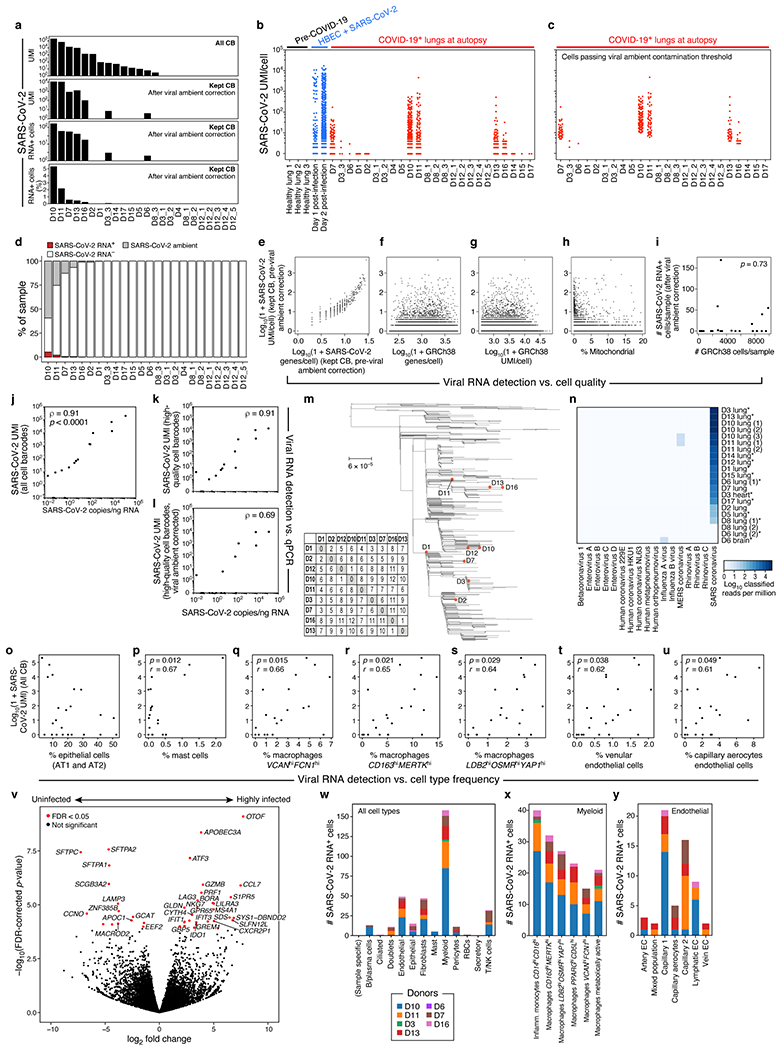
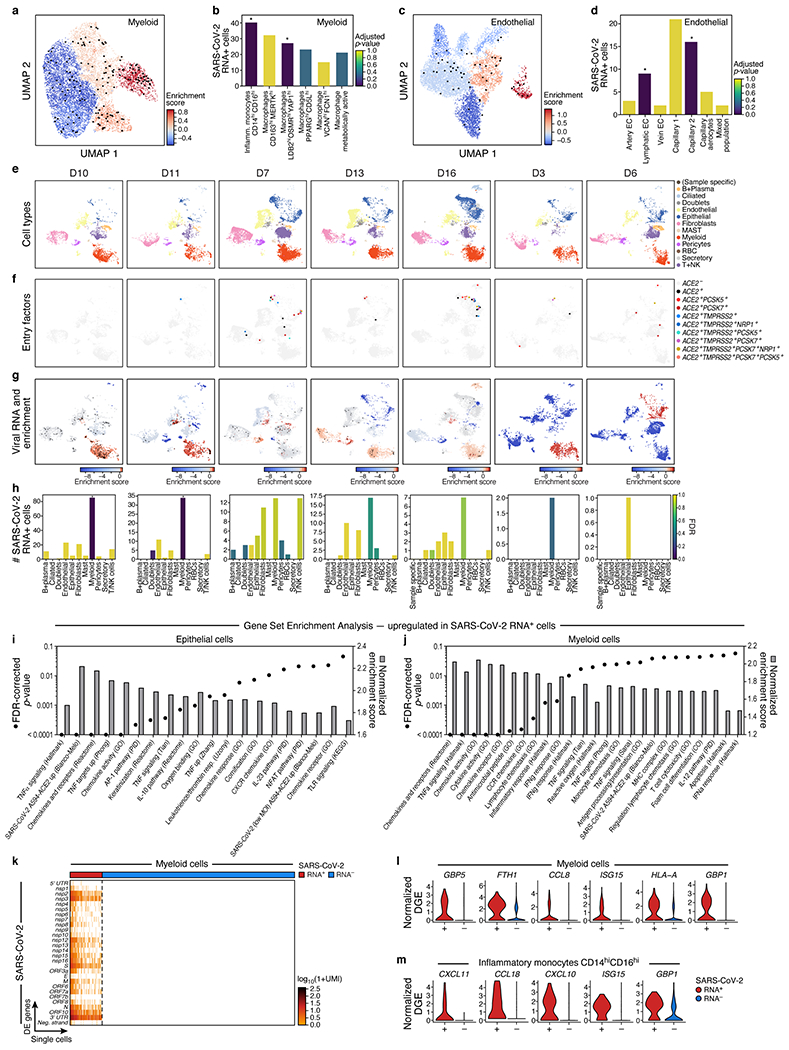
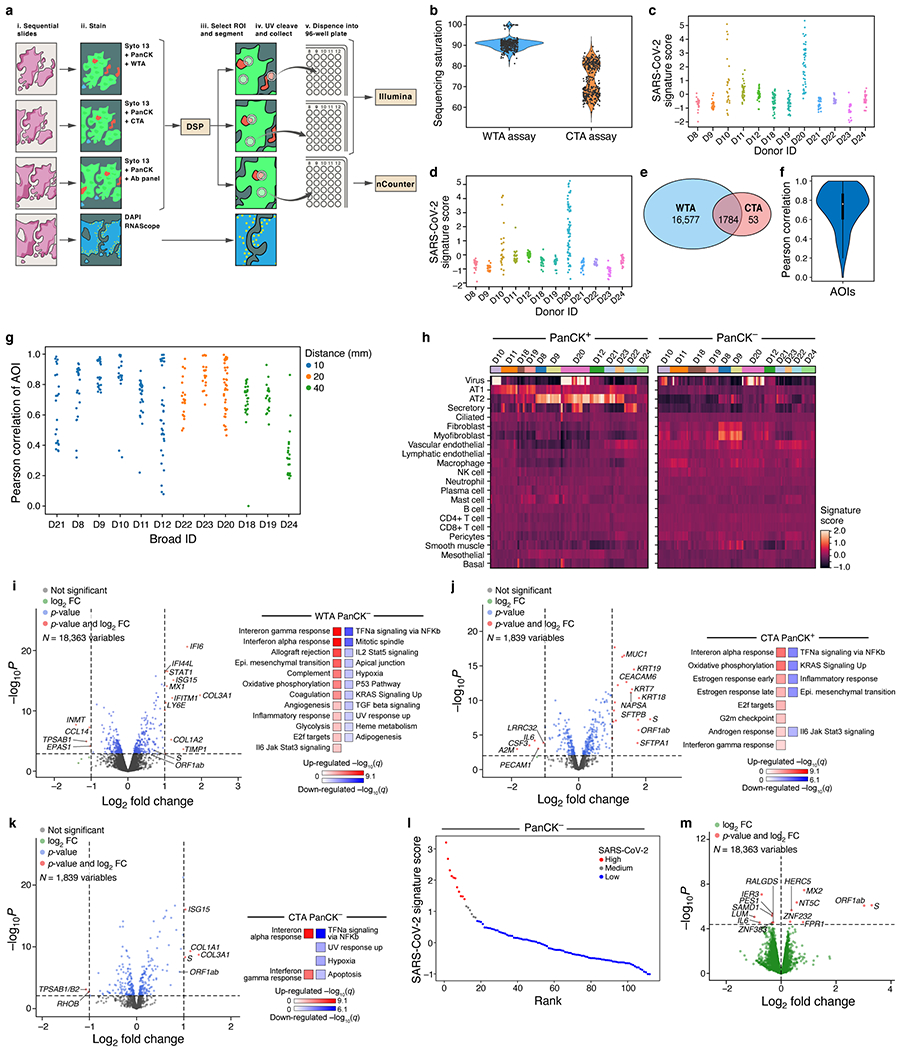
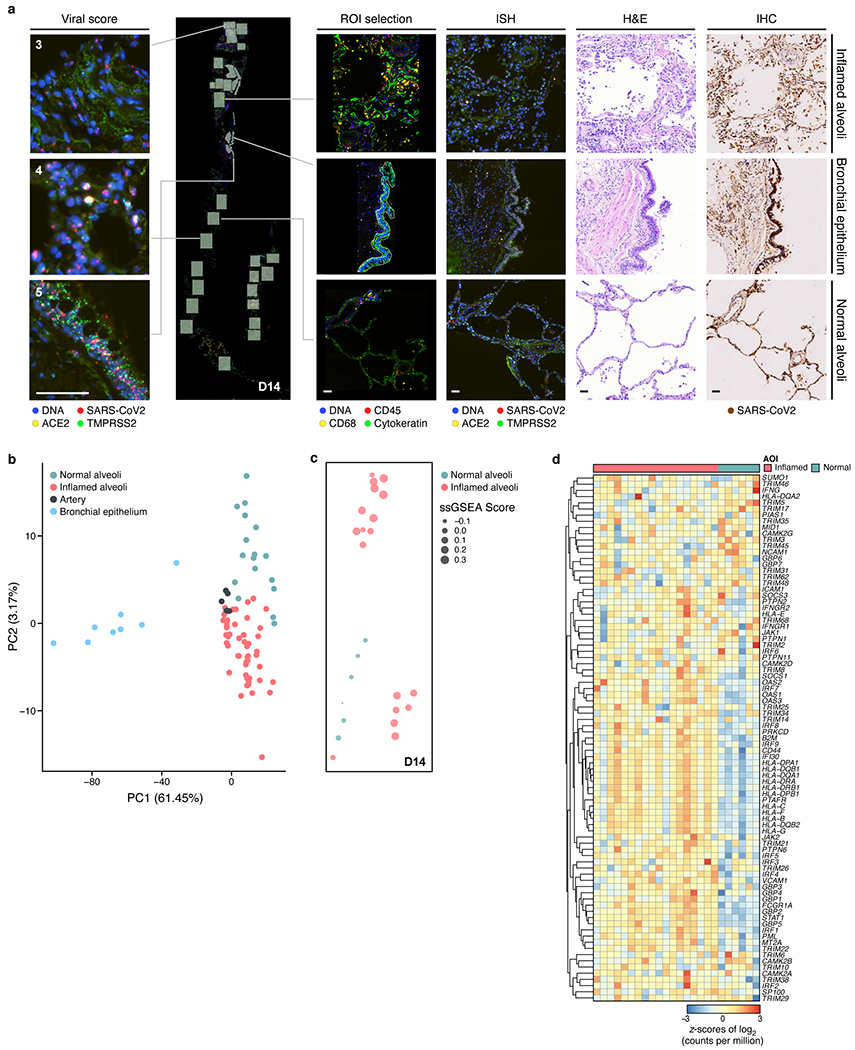
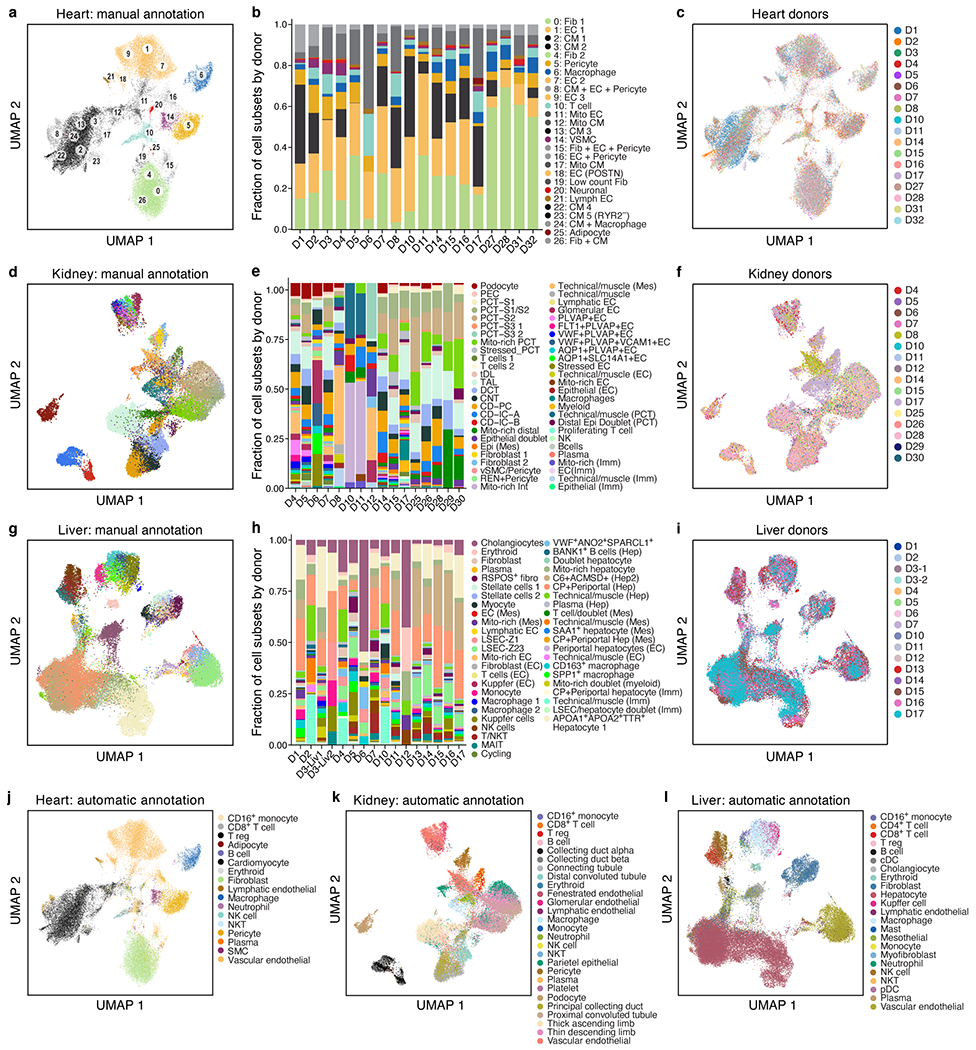
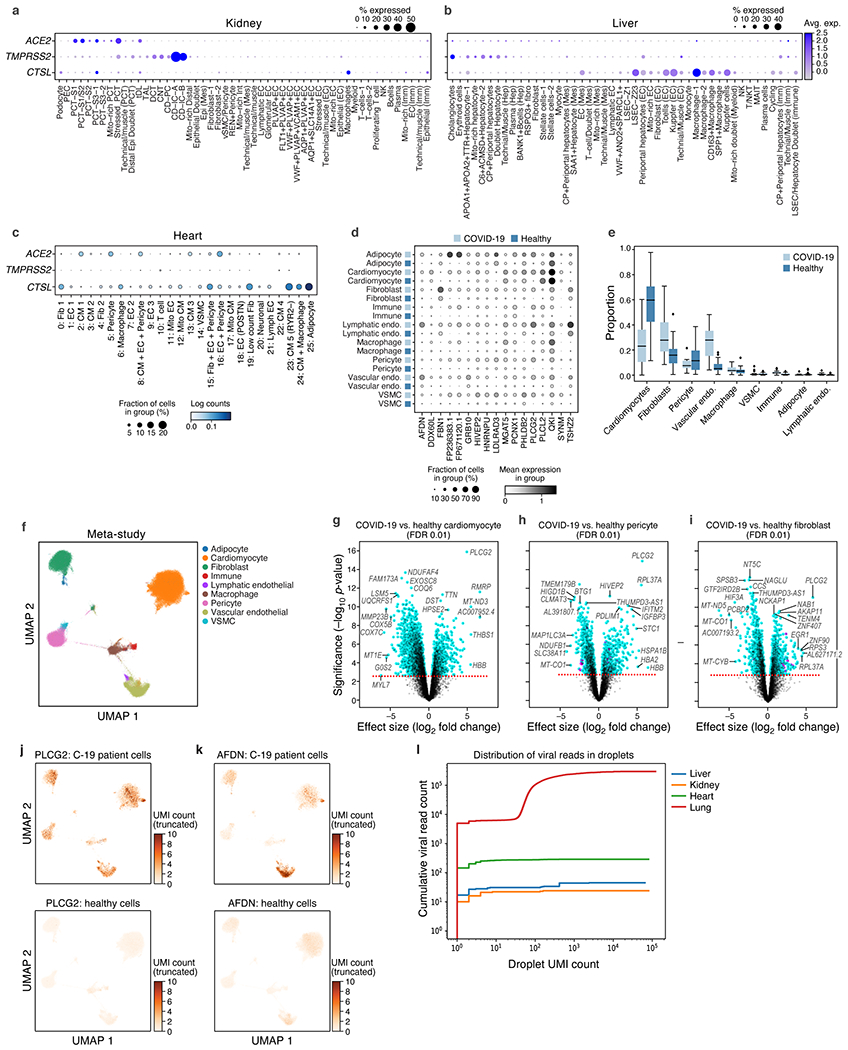
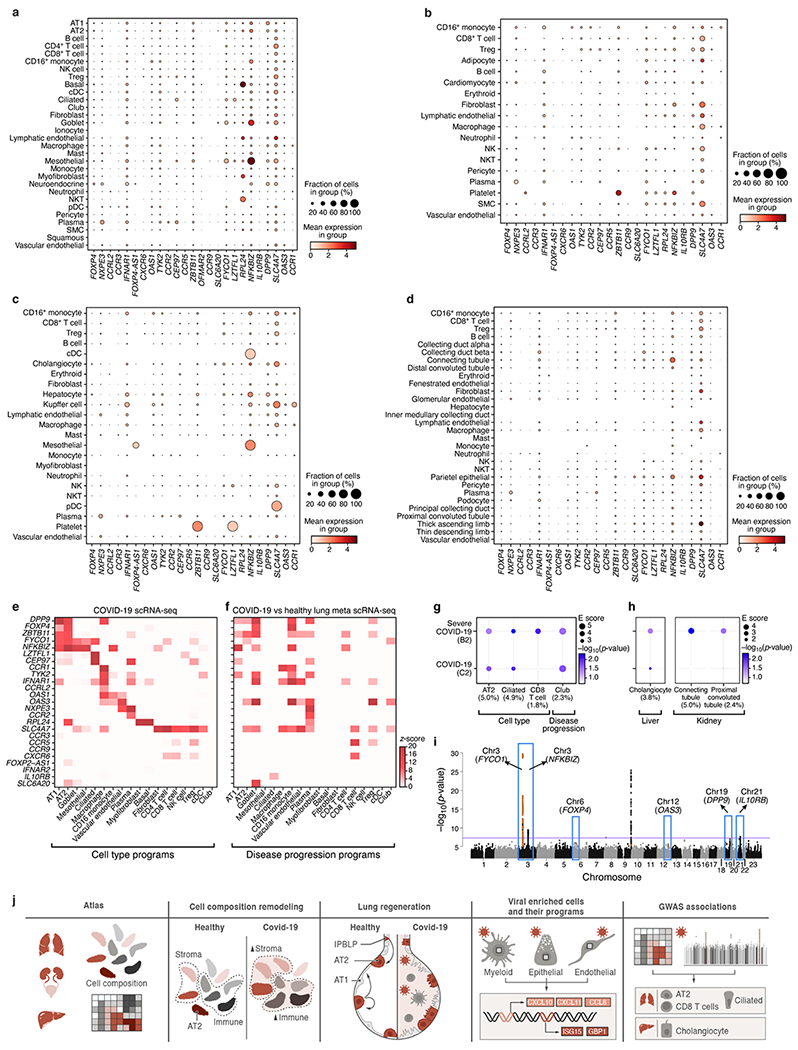
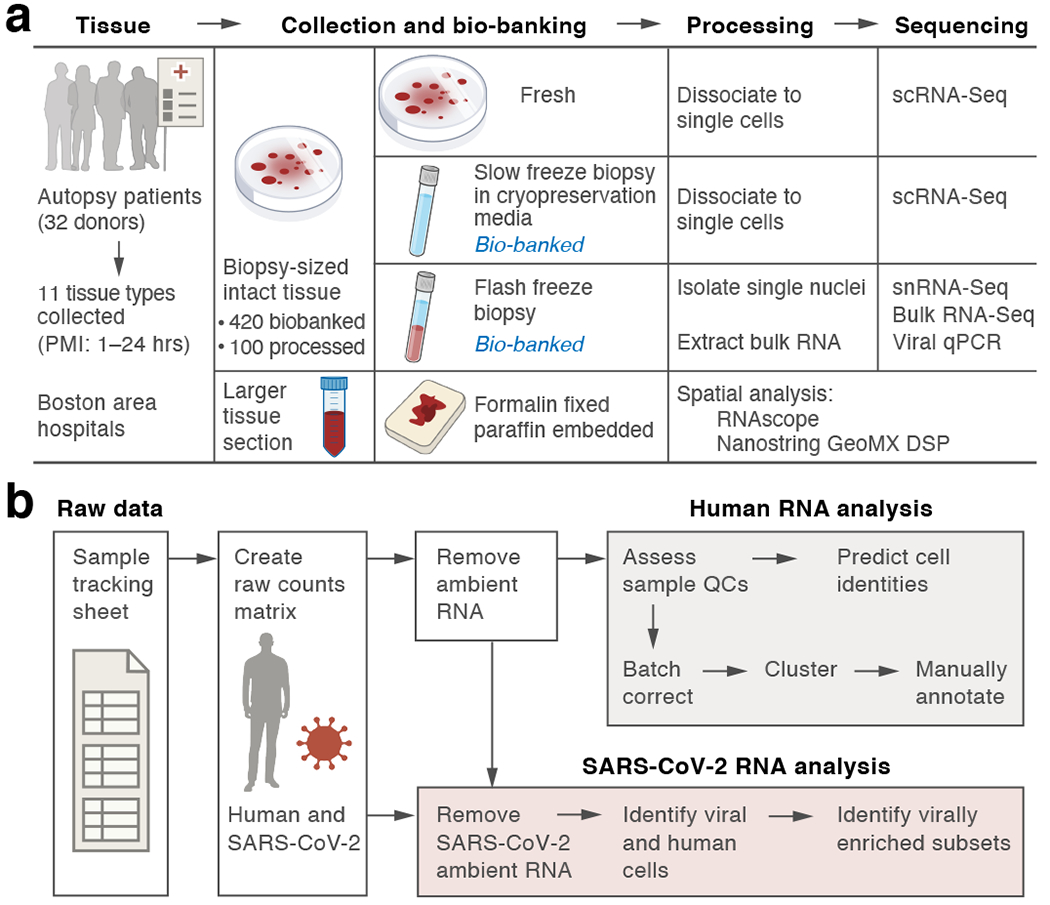
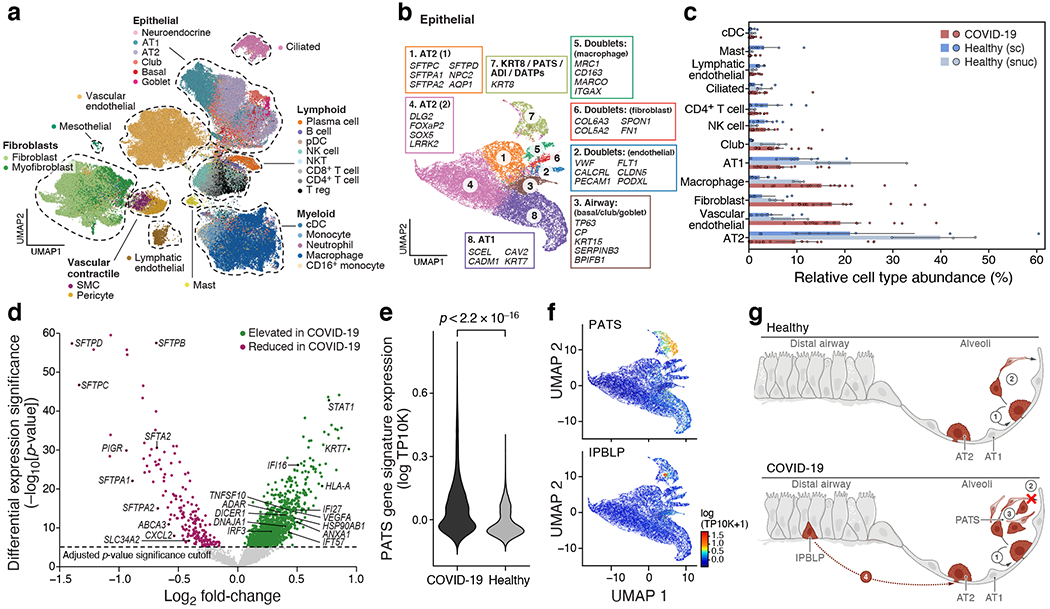
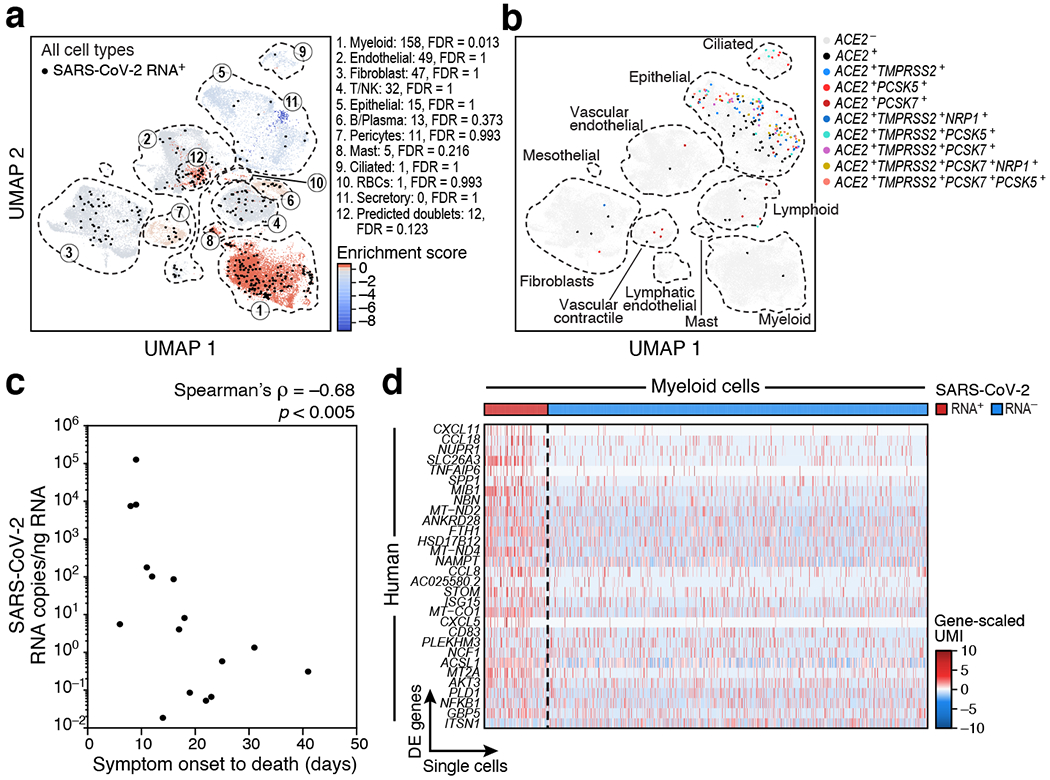
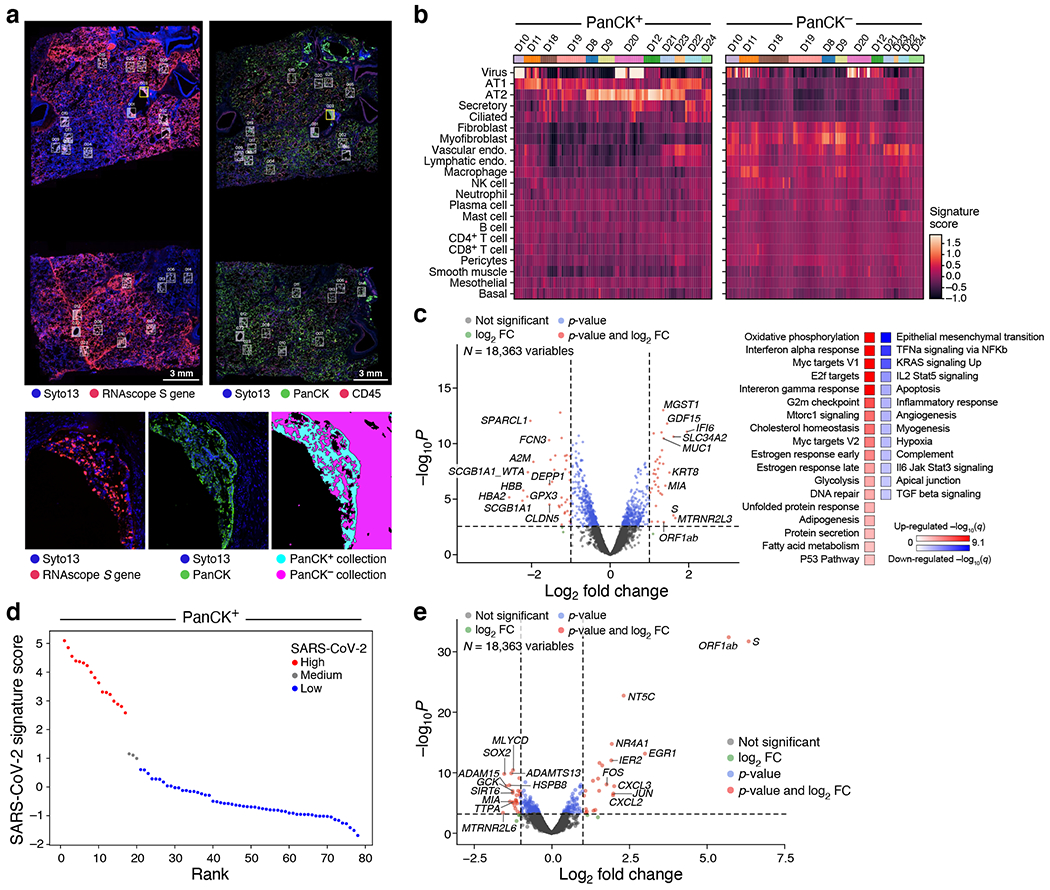
COVID-19, which is caused by SARS-CoV-2, can result in acute respiratory distress syndrome and multiple organ failure1-4, but little is known about its pathophysiology. Here we generated single-cell atlases of 24 lung, 16 kidney, 16 liver and 19 heart autopsy tissue samples and spatial atlases of 14 lung samples from donors who died of COVID-19. Integrated computational analysis uncovered substantial remodelling in the lung epithelial, immune and stromal compartments, with evidence of multiple paths of failed tissue regeneration, including defective alveolar type 2 differentiation and expansion of fibroblasts and putative TP63+ intrapulmonary basal-like progenitor cells. Viral RNAs were enriched in mononuclear phagocytic and endothelial lung cells, which induced specific host programs. Spatial analysis in lung distinguished inflammatory host responses in lung regions with and without viral RNA. Analysis of the other tissue atlases showed transcriptional alterations in multiple cell types in heart tissue from donors with COVID-19, and mapped cell types and genes implicated with disease severity based on COVID-19 genome-wide association studies. Our foundational dataset elucidates the biological effect of severe SARS-CoV-2 infection across the body, a key step towards new treatments.


Figures

Extended Data Figure 1.
Extended Data Figure 1.. A COVID-19 autopsy cohort, data quality and ambient RNA removal for a single cell/nucleus lung atlas
a. COVID-19 cohort overview. IMV: intermittent mandatory ventilation days, S/s: time from symptom onset to death in days; PMI: post-mortem interval. b-d. Comparison of cell composition by scRNA-seq and snRNA-seq in matched samples. Proportion of cells (x axis) of each type (color code) in sc/snRNA-seq samples from the same three donors (D3, D8, D12). e-h. Cellbender ‘remove-background’ on a single sample (D1). e. CellBender improves cell clustering and expression specificity by removing ambient RNA and empty (non-cell) droplets. UMAP plot of snRNA-seq profiles (dots) either before (left) or after (right) CellBender processing, colored by clusters, with CellBender-determined empty droplets in black (k=2,508 droplets removed, k=10,687 cells remaining). f,g. CellBender improves specificity of individual genes and cell type signatures. UMAP embedding of single nucleus profiles pre-CellBender (left) and post-CellBender (right) processing, colored by expression of the surfactant protein SFTPA1 (f) or signature score (Scanpy’s63 score_genes function, color bar) for genes sets specific to lung AT2 (g) cells. Color bar saturation chosen to emphasize low expression. h. Improved specificity of surfactant gene expression with CellBender (same sample). Expression level (log(average UMI count per cell), color) and percent of cells with nonzero expression (dot size) of surfactant genes (columns) across cell clusters (rows) before (left) and after (right) CellBender processing. Also shown, for comparison, are the results of an alternative method, DecontX (middle).
Extended Data Figure 2.
Extended Data Figure 2.. Quality control and annotation in the COVID-19 lung cell atlas
a-d. QC metrics for 24 lung samples (n=16 donors). Number of cells/nuclei (a, y axis) and distributions (median and first and third quartiles) of number of UMI per cell/nucleus (b, y axis), number of genes per cell/nucleus (c, y axis) and fraction of mitochondrial genes per cell/nucleus (d, y axis) across the samples (x axis) in the lung atlas. ScRNA-Seq samples are labeled by a grey circle. e-g. Cross-sample integration corrects batch effects. e. UMAP (as in Fig. 2a) of 106,792 sc/snRNA-Seq profiles post-Harmony65 correction (Methods) colored by sample ID. f,g. Donors and processing protocols across clusters. Number of cells (y axis) from different donors (f) or processing protocols (g) in each Leiden cluster (x axis). h. Cross validation of automatic annotation. Percent of cells (color bar) annotated in a class by Schiller et al.73 that we predict for each class (columns). i. Identification of main lineage annotations by manual annotation. UMAP of 106,792 sc/snRNA-Seq profiles post-Harmony65 correction (as in Fig. 2a) colored by manual annotation done in sub-clustering of each lineage. Dashed lines: chosen compartments for sub-clustering. j-n. Refined annotation of cell subsets within lineages. UMAP embeddings of each selected cell lineages with cells colored by manually annotated sub-clusters. Color legends highlight highly expressed marker genes for select subsets. j. myeloid cells (k=24,417 cells/nuclei); k. B and plasma cells (k=1,693); l. T and NK cells (k=9,950); m. endothelial cells (k=20,366); and n. fibroblast (k=20,925).
Extended Data Figure 3.
Extended Data Figure 3.. Bulk RNA-Seq deconvolution and comparison of automatic and manual annotations in the COVID-19 lung cell atlas
a,b. Deconvolution of bulk RNA-Seq libraries from adjacent lung tissue. a. Mean proportion (y axis, error bars = SD estimates from bulk RNA-Seq deconvolution (hatched bars; from MuSiC86) and from sc/snRNA-seq (filled bars) for each of 11 cell subsets (x axis) in each of 16 bulk RNA-Seq lung samples (panels) from 10 random samples of 10,000 cells each. b. Robustness of cell proportion estimates to the number of single cells sampled for the reference data. Mean proportion (y axis, from MuSiC) estimates for each of 11 cell subsets (color dots) in each of 16 bulk RNA-Seq lung samples (panels) when using three independent samples of 1,000 to 10,000 cells from the single cell reference (x axis). c-e. Agreement between automated and manual annotations. c. High consistency between automatic and manual annotations. The proportion (color intensity) and number (dot size) of cells with a given predicted annotation (rows) in each manual annotation category (columns). d,e. UMAP embedding of myeloid (k=24,417 cells/nuclei) (d) and T and NK (k=9,950 cells), (e) cell profiles colored by manually annotated subclusters (left) or automated predictions (right).
Extended Data Figure 4.
Extended Data Figure 4.. Manual annotation in the COVID-19 lung cell atlas
a,b. Identification of main immune lineage annotations. a. UMAP of 106,792 sc/snRNA-Seq profiles post- Harmony correction (as in Fig. 2a) colored by expression of genes (color bar, genes listed below) used to separate immune cell sub-lineages (Methods). b. Differentially expressed genes between sub-clusters within each lineage. Expression (color bar) of genes (rows) that are differentially expressed (Methods) across the sub-clusters (columns) within each compartment. DE genes shown are a union of the following: (i) top 10 DE genes between clusters, (ii) DE genes above an AUC of 0.8 and 0.75 for B/Plasma cells, (iii) pseudo-bulk DE genes above a log(fold change) threshold (thresholds: endothelial=4.2, T/NK=3, myeloid= 4, B/plasma=2) (label on top). c. Batch correction within lineage. Fraction of cells/nuclei (y axis) from different processing protocols (left) or different donors (right, n=17) in each sub-cluster (x axis) after batch correction with Harmony65 within each lineage.
Extended Data Figure 5.
Extended Data Figure 5.. Cell intrinsic programs and epithelial regenerative cell states in the COVID-19 lung cell atlas
a,b. Differences in cell composition across donors. Percent of cells (y axis) from each myeloid subset (legend) in each donor (x axis). b. Percent of cells (y axis) from each main lineage (legend) in each donor (x axis), rank ordered by proportion of epithelial cells (blue). c. Myeloid, endothelial and pneumocyte cells show substantial changes in cell intrinsic expression profiles in COVID-19 lung. Log2(fold change) (y axis) between COVID-19 and healthy lung for each elevated gene (dot) in each cell subset (x axis, by automatic annotation). Black bars: number of genes with significantly increased expression (adjusted p-value <7.5*10−6). Computed using a single cell based differential expression model applied to a meta-differential expression analysis between COVID-19 and healthy samples across 14 studies (see Methods). d. PATS and IBPLP cells in COVID-19 lung. UMAP embeddings of 1,550 KRT8+PATS-expressing cells (top) or of 1,394 airway epithelial cells (bottom) colored by IPBLPs or basal cells (orange, leftmost panels) or characteristic markers (purple, remaining panels).
Extended Data Figure 6.
Extended Data Figure 6.. SARS-CoV-2-RNA+ cells distinguished by sc/snRNA-Seq
a. Detection of SARS-CoV-2 UMIs from sc/snRNA-Seq data. SARS-CoV-2 UMIs from all cell barcodes (top), and after ambient correction (second from top). Number (second from bottom) and percent (bottom) of SARS-CoV-2 RNA+ cells after ambient correction (m=24 specimens). b,c. Impact of ambient RNA on SARS-CoV-2 RNA+ detection. Number of SARS-CoV-2 aligning UMI per Cell Barcode (CB) (y axis) in healthy lung (b, black), in vitro SARS-CoV-2 infected human bronchial epithelial cells (HBEC)110 (b, blue) or lung samples from COVID-19 donors at autopsy either with CB with high-quality capture of human mRNA (b, red) or after removal of cells whose viral alignments were attributed to ambient contamination (c, Methods). d. Variation in SARS-CoV-RNA+ cells across donors. Percent of cells (y axis) assigned as SARS-CoV-2 RNA(white), SARS-CoV-2 RNA+(red), or SARS-CoV-2 ambient (grey, Methods) across the donors (x axis), sorted by proportion of SARS-CoV-RNA+ cells. e-i. Viral RNA detection does not correlate with cell quality metrics. e-h. Number of SARS-CoV-2 UMIs (prior to ambient viral correction) for each cell (y axis) vs. either number of SARS-CoV-2 genes for that cell (e, x axis), number of human (GRCh38) genes per cell (f, x axis), number of human (GRCh38) UMI per cell (g, x axis), or % of human (GRCh38) mitochondrial UMIs per cell (h, x axis). i. Number of retained high-quality cells (x axis) and number of SARS-CoV-2 RNA+ cells (y axis) in each sample (dots) following correction for ambient viral reads. Pearson’s r = 0.07, two-sided p = 0.73. j-l. Agreement in viral RNA detection between qPCR and sn/scRNA-Seq. Number of SARS-CoV-2 copies measured by CDC N1 qPCR on bulk RNA extracted from matched tissue samples (x axis) and the number of SARS-CoV-2 aligning UMI (y axis) for each sample (dot) from all reads (j, p < 0.0001, two-sided), all reads from high-quality cell barcodes (k, p < 0.0001), and after viral ambient RNA correction (l, p = 0.0042). Spearman’s ⍴ reported, two-sided test. m. Genetic diversity of SARS-CoV-2. Maximum likelihood phylogenetic tree of 772 SARS-CoV-2 genomes from cases in Massachusetts between January-May 2020. Orange points: donors in this cohort. n. Specificity of SARS-CoV-2 infection. log10(1+reads) in each donor (columns) assigned to different viruses (rows) by metagenomic classification using Kraken2 from bulk RNA-Seq. Asterisks denote targeted capture. o-u. Relation between SARS-CoV-2 RNA and different cell types. Number of SARS-CoV-2 aligning UMIs in each (including all CB) and the proportion of epithelial (o), mast (p), macrophage VCANhighFCN1high (q), macrophages CD163highMERTKhigh (r), macrophages LDB2highOSMRhighYAP1high (s), venular endothelial (t) or capillary aerocytes (u) cells in these samples (x axes). Pearson’s r denoted in the upper left corner with significance following Bonferroni correction (p). v. Impact of viral load on bulk RNA profiles. Significance (−log10(P-value), yaxis) and magnitude (log2(fold-change), xaxis) of differential expression of each gene (dots) between three donors with highest viral load and six donors with lowest/undetectable viral load profiled by bulk RNA-Seq. Red points: FDR < 0.05. w-y. Distribution of SARS-CoV-2 RNA+ cells across cell types and subsets. Number of SARS-CoV-2 RNA+ cells (y axis) from each donor (color) across major categories (w, x axis), myeloid subsets (x, inflammatory monocytes: 40 cells, 5 donors; LDB2highOSMRhighYAP1high macrophages: 27 cells, 5 donors; x axis), or endothelial subsets (y, capillary endothelial cells: 16 cells, 4 donors; lymphatic endothelial cells: 9 cells, 3 donors; 16 cells, 4 donors, x axis).
Extended Data Figure 7.
Extended Data Figure 7.. Donor-specific enrichment of SARS-CoV-2 RNA+ cells and host responses to viral RNA
a-d. SARS-CoV-2 RNA+ cells are enriched in specific lineages and sub-types. a,c. UMAP embeddings of either myeloid cells (a), or endothelial cells (c) from seven donors containing any SARS-CoV-2 RNA+ cell, and colored by viral enrichment score (color bar; red: stronger enrichment) and by SARS-CoV-2 RNA+ cells (black points). b,d. Number of SARS-CoV-2 RNA+ cells (y axis) per cell type/subset (x axis) in myeloid (b) or endothelial (d) subsets. Bar color: FDR ( dark blue: higher significance, Methods; * FDR < 0.05. ). b. e-h. Variation across donors. e-g. UMAP embeddings of sc/snRNA-seq profiles from each of seven donors containing any SARS-CoV-2 RNA+ cell (columns), colored by major cell categories (e), expression of SARS-CoV-2 entry factors (f), or SARS-CoV-2 RNA enrichment per cluster (g, red/blue colorbar; red: high enrichment; black points: SARS-CoV-2 RNA+ cells). h. Number of SARS-CoV-2 RNA+ cells (y axis) across major cell types (x axis) from each of seven donors containing any SARS-CoV-2 RNA+ cell (columns). Bar color: FDR (dark blue: higher significance). * FDR < 0.05. i,j. Normalized enrichment score (bars, right y axis) and significance (points, FDR, left y axis) (by GSEA,, Methods) of different functional gene sets (x axis) in genes upregulated in SARS-CoV-2 RNA+ epithelial (i) or myeloid (j) cells. k. Expression of SARS-CoV-2 genomic features (log-normalized UMI counts; rows) across SARS-CoV-2 RNA+ (k=158 cells) and SARS-CoV-2 RNA− (k=790) myeloid cells (columns). l,m. Distribution of normalized expression levels (y axis) for select significantly differentially expressed genes between SARS-CoV-2 RNA− and SARS-CoV-2 RNA+ cells from all myeloid cells or Inflammatory monocytes CD14highCD16highcells.
Extended Data Figure 8.
Extended Data Figure 8.. NanoString GeoMx experiment design and analysis
a. Overview of spatial profiling experiments. b. Distribution of sequencing saturation (y axis, %) for WTA and CTA AOIs (x axis). c,d. SARS-CoV-2 signature score (y axis) for each WTA (c) and CTA (d) AOI (dots) from each donor (x axis). e. Overlap of WTA and CTA genes. f,g. Agreement between WTA and CTA. f. Distribution (box: interquartile range, white point: median, violin range: min-max) of Pearson correlation coefficients (y axis) between WTA and CTA profiles (for common genes across 296 AOIs). g. Pearson correlation coefficient (y axis) of WTA and CTA common genes for each AOI pair (dot) from each donor (x axis), sorted by distance between WTA and CTA sections (blue, 10 mm; orange, 20 mm; green, 40 mm). h. Cell composition differences between PanCK+ and PanCK alveolar AOIs and between AOIs from COVID-19 (n=9, 161 AOIs) and healthy (D22-24, 40 AOIs) lungs. Expression scores (color bar) of cell type signatures (rows) in PanCK+ (left) and PanCK (right) alveolar AOIs (columns) in CTA data from different donors (top color bar). i-k. Differential gene expression in COVID-19 vs. healthy lung. Left: Significance (−log10(p-value), y axis) and magnitude (log2(fold-change), x axis) of differential expression of each gene (dots) in WTA for PanCK (i, 112 COVID-19 vs. 20 healthy), and in CTA for PanCK+ (j, 69 COVID-19 vs. 18 healthy) and PanCK (k, 92 COVID-19 vs. 22 healthy) alveoli. Horizontal dashed line: FDR = 0.05, vertical dashed lines: |log2(fold-change)| = 2. Right: Significance (−log10(q-value)) of enrichment (permutation test) of different pathways (rows). l,m. Changes in gene expression in SARS-CoV-2 high vs. low AOIs within COVID-19 lungs in WTA data. l. PanCK- alveolar AOIs (dots) rank ordered by their SARS-CoV-2 signature score (y axis) in WTA data, and partitioned to high (red), medium (grey) and low (blue) SARS-CoV-2 AOIs. m. Significance (−log10(p-value), y axis) and magnitude (log2(fold-change), x axis) of differential expression of each gene (dots) in WTA data between SARS-CoV-2 high and low AOIs for PanCK- alveoli (ROIs: 11 high, 6 medium, 95 low). Horizontal dashed line: FDR = 0.05.
Extended Data Figure 9.
Extended Data Figure 9.. GeoMx WTA DSP analysis of lung biopsies reveals region- and inflammation-specific expression programs
a. Region selection. Serial sections of lung biopsies (five donors, D13-17; image depicts serial sections of D14) processed with GeoMx WTA-DSP with 4-color staining (DNA, CD45, CD68, PanCK), RNAscope with probes against (SARS-CoV-2 S-gene (utilized to derive semi-quantitative viral load scores), ACE2, TMPRSS2), H&E staining, and immunohistochemistry with anti-SARS-CoV-2 S-protein. Scale bar: 100 μm. b-d. Regions and inflammation specific expression programs. b. The first two principal components (PCs, x and y axes) from lung ROI gene expression profiles from donors D13-17, spanning normal-appearing alveoli (green; D14=6 AOIs, D15=2 AOIs, D16=5 AOIs, D17=4 AOIs); inflamed alveoli (magenta; D13=14 AOIs, D14=18 AOIs, D15=7 AOIs, D16=3 AOIs ,D17=8 AOIs); bronchial epithelium (blue; D14 =2 AOIs, D15 =1 AOI, D16 =2 AOIs, D17 =3 AOIs), and arterial blood vessels (black; D13=2 AOIs, D15=3 AOIs). c. GSEA score (circle size, legend) of the enrichment of the interferon-γ pathway in each normal-appearing (green; 6 AOIs) and inflamed (magenta; 18 AOIs) alveolar AOIs (dot) from the section of donor D14 (in a), placed in their respective physical coordinates on the tissue section (as in a). d. Expression (color bar, log2(counts per million)) of IFNγ pathway genes (rows) from normal-appearing (green, n=6) and inflamed alveoli (magenta, n=18) AOIs (columns) from D14 lung biopsy.
Extended Data Figure 10.
Extended Data Figure 10.. A single nucleus atlas of heart, kidney, and liver COVID-19 tissues
a-c. COVID-19 heart cell atlas. UMAP embedding of 40,880 heart nuclei (dots) (n=18 donors, m=19 specimens) colored by Leiden resolution 1.5 clustering with manual post hoc annotations (a) or donors (c). b. Proportions of cells (y axis) in each sample. d-f. COVID-19 kidney cell atlas. UMAP embedding of 33,872 kidney nuclei (dots) (n=16, m=16) colored by clustering with manual post hoc annotations (d) or donors (f). e. Proportion of cells (y axis) in each sample. g-i. COVID-19 liver cell atlas. g,i. UMAP embedding of 47,001 liver nuclei (dots) (n=15, m=16), colored by clustering with manual post hoc annotations (g) or donors (i). h. Proportion of cells (y-axis) in each sample. j-l. Automatic annotations. UMAP embeddings, colored by predicted cell type labels by automatic annotation for heart (j), kidney (k) and liver (l).
Extended Data Figure 11.
Extended Data Figure 11.. Entry factors in heart, kidney and liver COVID-19 tissues and differential gene expression in heart cell atlas
a-c. SARS-CoV-2 entry factors are expressed in kidney, liver, and heart cells. Average expression (dot color) and fraction of expressing cells (color, size) of SARS-CoV-2 entry factors (rows) across cell subsets (columns) in the kidney (a), liver (b), and heart (c). d-k. Genes and pathways differentially expressed between COVID-19 and healthy heart cells. d. Log mean expression per cell (dot color) and fraction of expressing cells (dot size) across cell types from healthy or COVID-19 heart (rows) for select genes (columns) that are differentially expressed between COVID-19 and healthy cells e. Proportions of each cell type for COVID-19 (n=15) and healthy (n=28, 2 studies) samples (boxplots: middle line=mean, box bounds=first and third quartiles,whiskers=1.5x the interquartile range, minima=smallest observed proportion, maxima=highest observed proportion). f. UMAP embedding of integrated COVID-19 and healthy snRNA-seq profiles (dots) colored by major cell types. Plot limited to a subset of 151,373 high-quality cells for visualization purposes. g-i. Cell type specific differentially expressed genes in COVID-19 vs. healthy nuclei. Differential expression (log2(fold change), x axis), and associated significance (−log10(P-value), y axis, Methods) for each gene (dot) between COVID-19 vs. healthy nuclei of cardiomyocytes (g), pericytes (h), and fibroblasts (i). Dashed line: FDR=0.01. j,k. UMAP embedding of the meta-analysis atlas (as in f) but showing only COVID-19 (top) or healthy (bottom) nuclei profiles (dots) colored by expression of PLCG2 (j) or AFDN (k). l. Low levels of viral UMIs in heart, liver and kidney, compared to lung. Cumulative viral read counts as a function of droplet UMI count. In lung (red) most viral-positive droplets are empty droplets (total UMI count ~ 100) with some viral-positive droplets which contain nuclei (UMI count > ~1,000), but in heart (green), liver (blue), and kidney (orange), most of the “viral-positive” droplets have fewer than 10 total UMI counts, suggesting these reads are not trustworthy.
Extended Data Figure 12.
Extended Data Figure 12.. Expression of GWAS curated genes across lung, heart, liver and kidney atlases
a-d. Mean expression (dot color, log(TP10K + 1)) and proportion of expressing cells (dot size) for each of 26 curated GWAS implicated genes (columns) in each cell subset (rows) for lung (a), heart (b), liver (c) and kidney (d) COVID-19 autopsy atlases. Results only reported for genes with expression in at least one cell subset in the underlying tissue. Some GWAS genes have higher expression in the lung compared to the other three tissues. e,f. Mean expression (e, z-score relative to all other cell types, color bar) or differential expression (f, z-score of DE analysis of expression in COVID-19 vs. healthy cells of the same type) of 25 out of 26 GWAS implicated genes (rows) from 6 genomic loci associated with COVID-19 (based on summary statistics data from COVID-19 HGI meta analysis across lung cell types (columns). ABO was not considered as it was not reliably recovered in scRNA-seq data. g-h. Cell type and disease progression gene programs in the lung (g), liver, and kidney (h) that contribute to heritability of COVID-19 severity. Magnitude (circle size, E score) and significance (color, −log10(P-value)) of the enrichment of cell type programs and cell-types specific disease programs (columns) that were significantly enriched for COVID-19 or severe COVID-19 phenotypes (rows). All results are conditional on 86 baseline-LDv2.1 model annotations. i. Nomination of single best candidate genes at unresolved GWAS significant loci by aggregating gene level information across program classes and cell types. Significance (−log10(P-value), y-axis) of GWAS association signal at locus (x-axis). Blue boxes: Significantly associated loci at a genome-wide significance level (purple horizontal bar). j. Schematic summarizing the key findings and contributions of this study.
Figure 1.
Figure 1.. Experimental and computational pipeline for a COVID-19 autopsy atlas.
a. Sample processing pipeline. Up to 11 tissue types from 32 donors were collected. PMI: post-mortem interval. b. sc/snRNA-Seq analysis pipeline.
Figure 2.
Figure 2.. A single cell and single nucleus atlas of COVID-19 lung
a. Automatic prediction identifies 28 cell subsets across compartments. UMAP embedding of 106,792 harmonized sc/snRNA-Seq profiles (dots) from 24 tissue samples of 16 COVID-19 lung donors, colored by automatic annotations (legend). b. Epithelial cell subsets. UMAP embedding of 21,661 epithelial cells/nuclei profiles, colored by manual annotations, with highly expressed marker genes (boxes). c,d. Cell composition and expression differences between COVID-19 and healthy lung. c. Cell proportions (x axis, mean: bar, and 95% confidence intervals: line) in each automatically annotated subset (y axis) in COVID-19 snRNA-Seq (red, n=16), healthy snRNA-Seq (grey, n=3), and healthy scRNA-seq (n=8, blue). Cell types shown have a COVID-19 vs. healthy snRNA-Seq FDR < 0.05 (Dirichlet-multinomial regression). d. Significance (−Log10(P-value), y axis) vs. magnitude (log2(fold-change), x axis) of differential expression of each gene (dots; horizontal dashed line: FDR < 0.05) between COVID-19 and healthy lung from a total of 2,000 AT2 cells and 14 studies (2 sided test, Methods). e,f. An increased PATS program in pneumocytes in COVID-19 vs. healthy lung. e. Distribution of PATS signature scores (y axis) for 17,655 cells from COVID-19 and 24,000 cells from healthy lung pneumocytes (x axis) p-value< 2.2*10−16 (one-sided Mann–Whitney U test). f. UMAP embedding of 21,661 epithelial cell profiles (dots) colored by signature level (color legend, lower right) for the PATS (top) or IPBLP (bottom) programs. g. Model of epithelial cell regeneration in healthy and COVID-19 lung. In healthy alveoli (top), AT2 cells self-renew (1) and differentiate into AT1 cells (2). In COVID-19 alveoli (bottom), AT2 cell self-renewal (1) and AT1 differentiation (2) are inhibited, resulting in PATS accumulation (3) and recruitment of airway-derived IPBLP progenitors to alveoli (4).
Figure 3.
Figure 3.. SARS-CoV-2 RNA+ single cells are enriched for phagocytic and endothelial cells
a,b. Many SARS-CoV-2 RNA+ single cells do not express known SARS-CoV-2 entry factors. UMAP embedding of all 106,792 lung cells/nuclei (as in Fig. 2a), showing either a. only the 40,581 cells from seven donors containing any SARS-CoV-2 RNA+ cell, colored by viral enrichment score (Methods, red: stronger enrichment) and by SARS-CoV-2 RNA+ cells (black points), and marked by annotation and FDR of enrichment (legend) or b. all 106,792 cells/nuclei, colored by expression of SARS-CoV-2 entry factors (co-expression combinations with at least 10 cells are shown). Dashed lines: major cell types. c. Reduction in SARS-CoV-2 RNA with prolonged S/s to death interval (Spearman ρ = −0.68, p <0.005, two-sided test). S/s to death (x axis, days) and lung SARS-CoV-2 copies/ng input RNA (y axis) for each donor (n=16). d. Expression changes in SARS-CoV-2 RNA+ myeloid cells. Significantly differentially expressed host genes (log-normalized and scaled digital gene expression, rows; cutoff: FDR < 0.05 and log2fold change > 0.5) across SARS-CoV-2 RNA+ (n=158) and SARS-CoV-2 RNA− myeloid cells (n=790) (columns).
Figure 4.
Figure 4.. Composition and expression differences between COVID-19 and healthy lungs and between infected and uninfected regions within COVID-19 lungs.
a. Example of analyzed regions. Top: RNAscope (left) and immunofluorescent staining (right) of donor D20 with collection ROIs and matched areas in white rectangles. Bottom: One ROI (yellow rectangle) from each scan (left and middle), and the segmented collection AOIs (right). b. Cell composition differences between PanCK+ and PanCK alveolar AOIs and between AOIs from COVID-19 (n=9, 190 AOIs) and healthy (D22-24, 38 AOIs) lungs. Expression scores (color bar) of cell type signatures (rows) in PanCK+ (left) and PanCK (right) alveolar AOIs (columns) in WTA data from different donors (top color bar).c. Differential gene expression in COVID-19 vs. healthy lung. Left: Significance (−log10(p-value), y axis) and magnitude (log2(fold-change), x axis) of differential expression of each gene (dots) in WTA data between PanCK+ alveoli AOIs from COVID-19 (n=78) vs. healthy (n=18) lung . Right: Significance (−log10(q-value)) of enrichment (permutation test) of different pathways (rows). d,e. Changes in gene expression in SARS-CoV-2 high vs. low AOIs within COVID-19 lungs in WTA data. d. SARS-CoV-2 high and low alveolar AOIs. PanCK+ alveolar AOIs (dots) rank ordered by their SARS-CoV-2 signature scores (y axis) in WTA data, and partitioned to high (red), medium (grey) and low (blue) SARS-CoV-2 AOIs. e. Significance (−log10(p-value), y axis) and magnitude (log2(fold-change), x axis) of differential expression of each gene (dots) in WTA data between SARS-CoV-2 high and low AOIs for PanCK+ alveoli (AOIs: 17 high, 3 medium, 58 low). Horizontal dashed line: FDR = 0.05. Vertical dashed lines: |log2(fold-change)| = 2. Top 10 DE genes by fold change marked.

Comment in

Similar articles

  • A single-cell and spatial atlas of autopsy tissues reveals pathology and cellular targets of SARS-CoV-2.
    Delorey TM, Ziegler CGK, Heimberg G, Normand R, Yang Y, Segerstolpe A, Abbondanza D, Fleming SJ, Subramanian A, Montoro DT, Jagadeesh KA, Dey KK, Sen P, Slyper M, Pita-Juárez YH, Phillips D, Bloom-Ackerman Z, Barkas N, Ganna A, Gomez J, Normandin E, Naderi P, Popov YV, Raju SS, Niezen S, Tsai LT, Siddle KJ, Sud M, Tran VM, Vellarikkal SK, Amir-Zilberstein L, Atri DS, Beechem J, Brook OR, Chen J, Divakar P, Dorceus P, Engreitz JM, Essene A, Fitzgerald DM, Fropf R, Gazal S, Gould J, Grzyb J, Harvey T, Hecht J, Hether T, Jane-Valbuena J, Leney-Greene M, Ma H, McCabe C, McLoughlin DE, Miller EM, Muus C, Niemi M, Padera R, Pan L, Pant D, Pe'er C, Pfiffner-Borges J, Pinto CJ, Plaisted J, Reeves J, Ross M, Rudy M, Rueckert EH, Siciliano M, Sturm A, Todres E, Waghray A, Warren S, Zhang S, Zollinger DR, Cosimi L, Gupta RM, Hacohen N, Hide W, Price AL, Rajagopal J, Tata PR, Riedel S, Szabo G, Tickle TL, Hung D, Sabeti PC, Novak R, Rogers R, Ingber DE, Jiang ZG, Juric D, Babadi M, Farhi SL, Stone JR, Vlachos IS, Solomon IH, Ashenberg O, Porter CBM, Li B, Shalek AK, Villani AC, Rozenblatt-Rosen O, Regev A. Delorey TM, et al. bioRxiv [Preprint]. 2021 Feb 25:2021.02.25.430130. doi: 10.1101/2021.02.25.430130. bioRxiv. 2021. PMID: 33655247 Free PMC article. Preprint.
  • A molecular single-cell lung atlas of lethal COVID-19.
    Melms JC, Biermann J, Huang H, Wang Y, Nair A, Tagore S, Katsyv I, Rendeiro AF, Amin AD, Schapiro D, Frangieh CJ, Luoma AM, Filliol A, Fang Y, Ravichandran H, Clausi MG, Alba GA, Rogava M, Chen SW, Ho P, Montoro DT, Kornberg AE, Han AS, Bakhoum MF, Anandasabapathy N, Suárez-Fariñas M, Bakhoum SF, Bram Y, Borczuk A, Guo XV, Lefkowitch JH, Marboe C, Lagana SM, Del Portillo A, Tsai EJ, Zorn E, Markowitz GS, Schwabe RF, Schwartz RE, Elemento O, Saqi A, Hibshoosh H, Que J, Izar B. Melms JC, et al. Nature. 2021 Jul;595(7865):114-119. doi: 10.1038/s41586-021-03569-1. Epub 2021 Apr 29. Nature. 2021. PMID: 33915568 Free PMC article.
  • Tissue-based SARS-CoV-2 detection in fatal COVID-19 infections: Sustained direct viral-induced damage is not necessary to drive disease progression.
    El Jamal SM, Pujadas E, Ramos I, Bryce C, Grimes ZM, Amanat F, Tsankova NM, Mussa Z, Olson S, Salem F, Miorin L, Aydillo T, Schotsaert M, Albrecht RA, Liu WC, Marjanovic N, Francoeur N, Sebra R, Sealfon SC, García-Sastre A, Fowkes M, Cordon-Cardo C, Westra WH. El Jamal SM, et al. Hum Pathol. 2021 Aug;114:110-119. doi: 10.1016/j.humpath.2021.04.012. Epub 2021 May 4. Hum Pathol. 2021. PMID: 33961839 Free PMC article.
  • [Histopathological features due to the SARS-CoV-2].
    Hofman P, Copin MC, Tauziede-Espariat A, Adle-Biassette H, Fortarezza F, Passeron T, Salmon I, Calabrese F. Hofman P, et al. Ann Pathol. 2021 Feb;41(1):9-22. doi: 10.1016/j.annpat.2020.12.009. Epub 2020 Dec 30. Ann Pathol. 2021. PMID: 33446414 Free PMC article. Review. French.
  • Lesions in the lungs of fatal corona virus disease Covid-19.
    Englisch CN, Tschernig T, Flockerzi F, Meier C, Bohle RM. Englisch CN, et al. Ann Anat. 2021 Mar;234:151657. doi: 10.1016/j.aanat.2020.151657. Epub 2020 Dec 3. Ann Anat. 2021. PMID: 33279630 Free PMC article. Review.

Cited by

References

    1. Guan W-J et al. Clinical Characteristics of Coronavirus Disease 2019 in China. N. Engl. J. Med 382, 1708–1720 (2020). - PMC - PubMed
    1. Puelles VG et al. Multiorgan and Renal Tropism of SARS-CoV-2. N. Engl. J. Med 383, 590–592 (2020). - PMC - PubMed
    1. Huang C et al. Clinical features of patients infected with 2019 novel coronavirus in Wuhan, China. Lancet 395, 497–506 (2020). - PMC - PubMed
    1. Xu Z et al. Pathological findings of COVID-19 associated with acute respiratory distress syndrome. Lancet Respir Med 8, 420–422 (2020). - PMC - PubMed
    1. Varga Z et al. Endothelial cell infection and endotheliitis in COVID-19. Lancet 395, 1417–1418 (2020). - PMC - PubMed

Publication types

MeSH terms