. 2021 Apr 1;13(7):1639.
doi: 10.3390/cancers13071639.

Systematic Assessment of Transcriptomic Biomarkers for Immune Checkpoint Blockade Response in Cancer Immunotherapy

Affiliations

Systematic Assessment of Transcriptomic Biomarkers for Immune Checkpoint Blockade Response in Cancer Immunotherapy

Shangqin Sun et al. Cancers (Basel). .

Abstract

Background: Immune checkpoint blockade (ICB) therapy has yielded successful clinical responses in treatment of a minority of patients in certain cancer types. Substantial efforts were made to establish biomarkers for predicting responsiveness to ICB. However, the systematic assessment of these ICB response biomarkers remains insufficient.

Methods: We collected 22 transcriptome-based biomarkers for ICB response and constructed multiple benchmark datasets to evaluate the associations with clinical response, predictive performance, and clinical efficacy of them in pre-treatment patients with distinct ICB agents in diverse cancers.

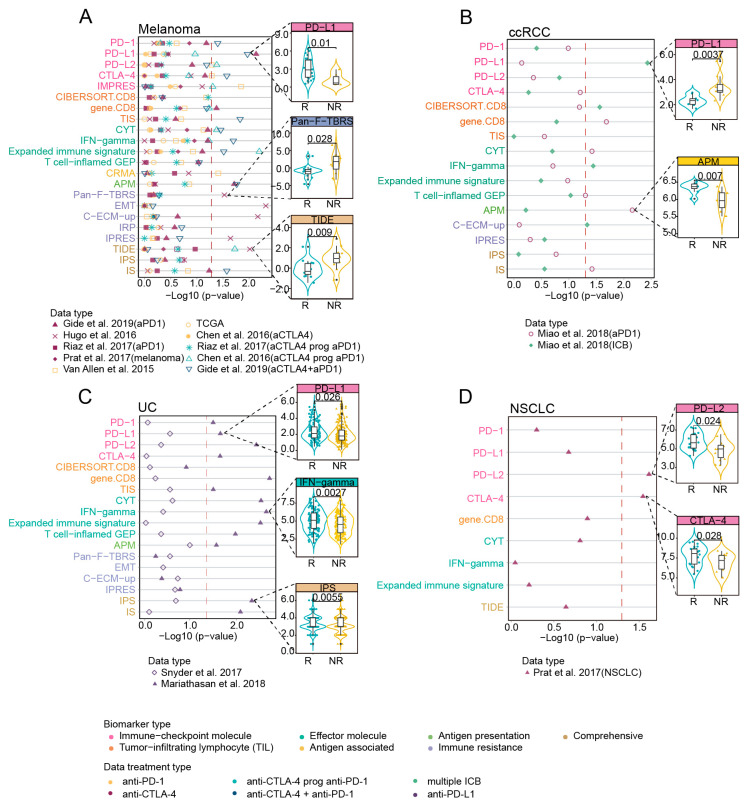
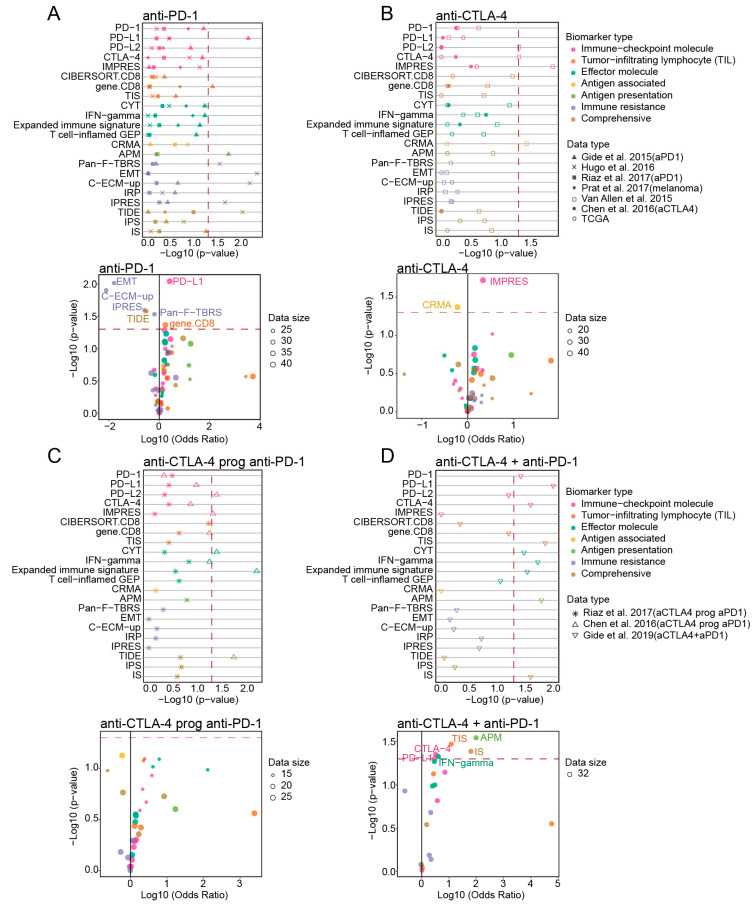
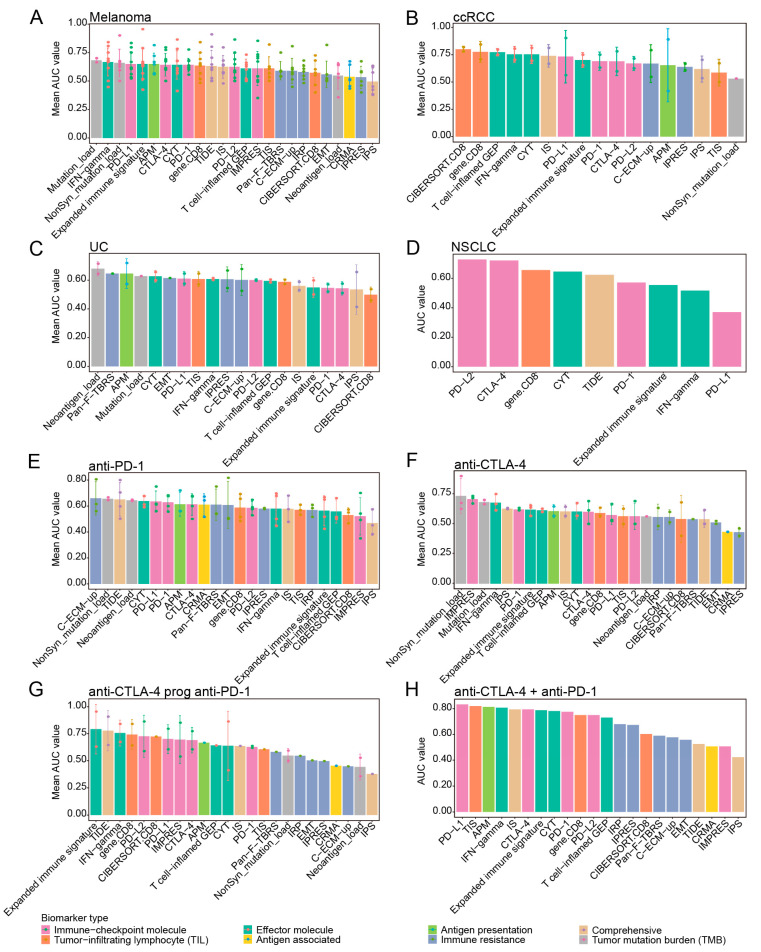
Results: Overall, "Immune-checkpoint molecule" biomarkers PD-L1, PD-L2, CTLA-4 and IMPRES and the "Effector molecule" biomarker CYT showed significant associations with ICB response and clinical outcomes. These immune-checkpoint biomarkers and another immune effector IFN-gamma presented predictive ability in melanoma, urothelial cancer (UC) and clear cell renal-cell cancer (ccRCC). In non-small cell lung cancer (NSCLC), only PD-L2 and CTLA-4 showed preferable correlation with clinical response. Under different ICB therapies, the top-performing biomarkers were usually mutually exclusive in patients with anti-PD-1 and anti-CTLA-4 therapy, and most of biomarkers presented outstanding predictive power in patients with combined anti-PD-1 and anti-CTLA-4 therapy.

Conclusions: Our results show these biomarkers had different performance in predicting ICB response across distinct ICB agents in diverse cancers.

Keywords: comparative analysis; immune checkpoint blockade (ICB); immune response; immunotherapy; transcriptomic biomarkers.


Conflict of interest statement

We declare that we do not have any commercial or associative interest that represents a conflict of interest in connection with the work submitted.

Figures

Figure 1
Figure 1
Transcriptomic biomarkers of ICB response in Cancer-immune Cycle.
Figure 2
Figure 2
Correlations of transcriptomic biomarkers with ICB response at overall evaluation level. A heatmap displayed the Spearman rank correlation coefficient between any two biomarkers, and demonstrated the hierarchical clustering pattern of various biomarkers based on ~6600 samples from the TCGA pan-cancer cohort. Positive and negative correlations were represented in red and blue, respectively. Biomarkers such as EMT, CRMA, IRP, TIDE and IMPRES were excluded due to them only apply to specific cancer types.
Figure 3
Figure 3
Correlation of biomarkers with clinical response to ICB across multiple datasets with different cancer types. (AD) Left: the two-sided Wilcoxon rank-sum test p value indicating whether biomarkers significantly differentiate between responders versus non-responders (NR) (patients stratification using “PD” strategy) in distinct tumors, red dashed line indicated 0.05 threshold of p value. The color of the dot represented ICB treatment types of each dataset. Magenta denoted anti-PD-1, yellow denoted anti-CTLA-4, light green denoted “anti-PD-1 after progression on prior anti-CTLA-4”, blue represented combined anti-PD-1 and anti-CTLA-4 immunotherapy, grass green represented multiple ICB treatments, and purple represented anti-PD-L1. Right: boxplots showing examples of biomarkers with significant difference (Wilcoxon rank-sum test p < 0.05) between the responding (R) versus non-responding (NR) tumors. Black lines in the box represented upper 75%, median, and lower 25% values.
Figure 4
Figure 4
Correlation of biomarkers with clinical response to ICB across multiple datasets with different ICB therapy strategies. (AD) Top: the two-sided Wilcoxon rank-sum test p value indicating whether biomarkers significantly differentiate between responders (R) versus non-responders (NR) (patients stratification using “PD” strategy) in four ICB therapy strategies, red dashed line indicated 0.05 threshold of p value. Bottom: scatterplot showed log10 (Odds Ratio) and −log10 (p-value) from univariate logistic regression model for different ICB therapies. Red dashed line indicated 0.05 threshold of p value.
Figure 5
Figure 5
Prediction performance of biomarkers for ICB response across different cancer types and different ICB therapy strategies. (AD) Bar centre was defined by the mean AUC values of each transcriptomic biomarker across different cancer datasets (patients stratification using “PD” strategy), and error bars indicated ±1 SD. (EH) Bar centre was defined by the mean AUC values of each transcriptomic biomarker in melanoma datasets under different ICB therapy strategies (patients stratification using “PD” strategy), and error bars indicated ±1 SD.
Figure 6
Figure 6
The impact of ICB response biomarkers on clinical efficacy of ICB therapy. Kaplan–Meier survival curves showing OS or PFS for patients with high versus low scores of (A) T cell-inflamed GEP in melanoma, T cell−inflamed GEP in UC and PD−L2 in ccRCC. Kaplan-Meier survival curves showing OS for patients with high versus low scores of (B) PD−L1 under anti-PD-1 therapy, Expanded immune signature under anti-CTLA-4 therapy and IPS under “anti-CTLA-4 prog anti-PD-1” therapy. Kaplan–Meier survival curves showing PFS for patients with high versus low scores of APM under the combination anti-PD-1 and anti-CTLA-4 therapy. (C) Top: the pies on the left panel showing the significance of association for each response biomarker in each overall benchmark dataset and the barplots on the right panel showing the numbers of patients in each dataset. The left half of the pie chart represented the patients with high scores of the corresponding biomarkers, red and dark gray indicated the proportion of responders and non-responders in high-score patients, respectively. The right half of the pie chart represented the patients with low scores of the corresponding biomarkers, blue and light gray indicated the proportion of responders and non-responders in patients with low-score patients, respectively. Borders with no color, gray borders and black borders represented p ≥ 0.1, 0.05 ≤ p < 0.1, p < 0.05, respectively. Different categories of biomarkers were represented by different colors. Bottom: objective response in patients with high versus low scores of PD-L2 and gene.CD8 in the Gide et al., 2019 dataset, Expanded immune signature in the Mariathasan et al., 2018 dataset and Pan−F−TBRS in the Hugo et al., 2016 dataset. Proportion of PR/CR were colored on histograms based on the categories of corresponding biomarkers, with the numbers of patients shown in each bar. Datasets with less than 20 samples were excluded from the analysis.
Figure 7
Figure 7
Evaluation of the association between the TME components and clinical response to ICB in different cancer types and therapies. (A) Scatterplot showed correlation of the abundance of TME components with ICB response in specific cancer type with different ICB therapy. Red dots denoted that the abundance of TME component was higher in responders than non-responders, green dots indicated the opposite. Size of dots indicated significance (larger for p < 0.05) and p value was computed by the two-sided Wilcoxon rank-sum test. Colors of different datasets indicated different ICB treatment strategies. (B) Prediction performance of each TME component for ICB response across different cancer and treatment types. AUC for each component across benchmark datasets were shown at left panel. The cancer type-specific and treatment type-specific prediction scores (sum of sample size-weighted AUC) were shown at right panel. The gradient of color indicated the prediction performance from low (light) to high (dark).

References

    1. Sharma P., Allison J.P. The future of immune checkpoint therapy. Science. 2015;348:56–61. doi: 10.1126/science.aaa8172. - DOI - PubMed
    1. O’Donnell J.S., Teng M.W.L., Smyth M.J. Cancer immunoediting and resistance to T cell-based immunotherapy. Nat. Rev. Clin. Oncol. 2019;16:151–167. doi: 10.1038/s41571-018-0142-8. - DOI - PubMed
    1. Pitt J.M., Vetizou M., Daillere R., Roberti M.P., Yamazaki T., Routy B., Lepage P., Boneca I.G., Chamaillard M., Kroemer G., et al. Resistance Mechanisms to Immune-Checkpoint Blockade in Cancer: Tumor-Intrinsic and -Extrinsic Factors. Immunity. 2016;44:1255–1269. doi: 10.1016/j.immuni.2016.06.001. - DOI - PubMed
    1. Zhao X., Subramanian S. Intrinsic Resistance of Solid Tumors to Immune Checkpoint Blockade Therapy. Cancer Res. 2017;77:817–822. doi: 10.1158/0008-5472.CAN-16-2379. - DOI - PubMed
    1. Chen K., Ye H., Lu X.J., Sun B., Liu Q. Towards In Silico Prediction of the Immune-Checkpoint Blockade Response. Trends Pharmacol. Sci. 2017;38:1041–1051. doi: 10.1016/j.tips.2017.10.002. - DOI - PubMed

LinkOut - more resources