

ImmunoAIzer: A Deep Learning-Based Computational Framework to Characterize Cell Distribution and Gene Mutation in Tumor Microenvironment
- PMID: 33916145
- PMCID: PMC8036970
- DOI: 10.3390/cancers13071659
ImmunoAIzer: A Deep Learning-Based Computational Framework to Characterize Cell Distribution and Gene Mutation in Tumor Microenvironment
Abstract
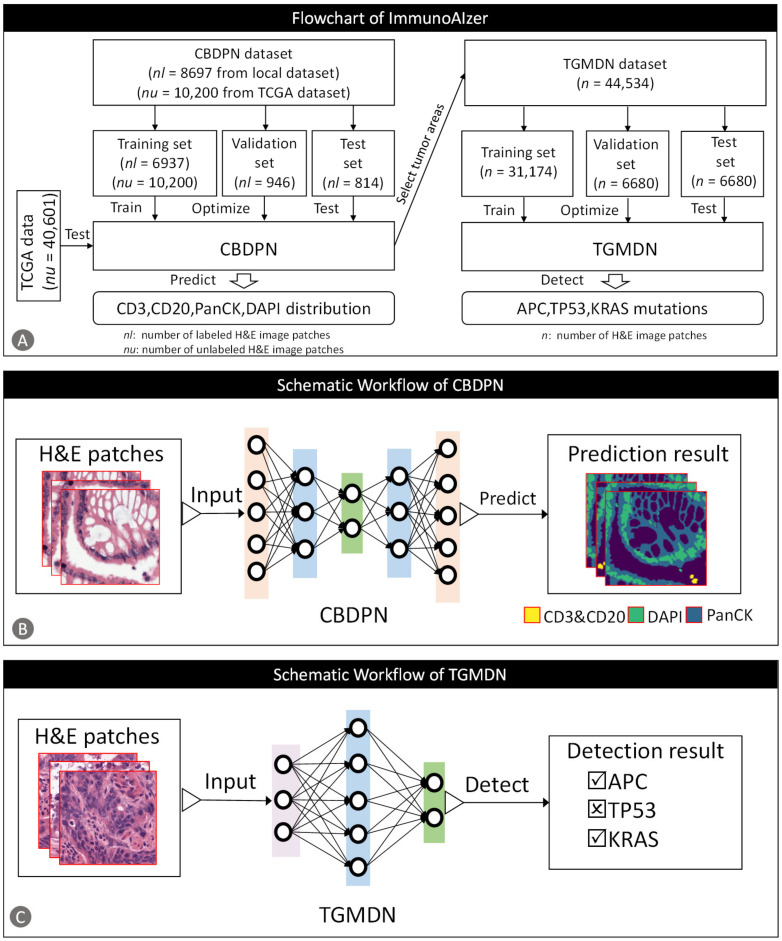
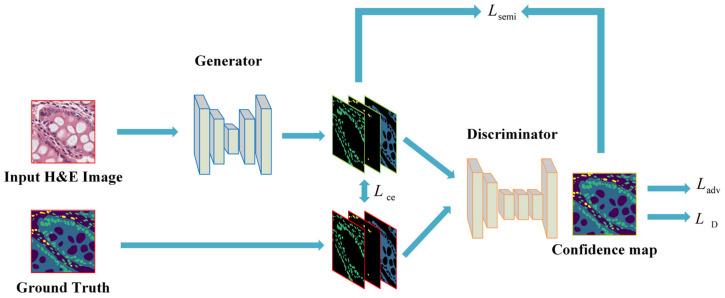
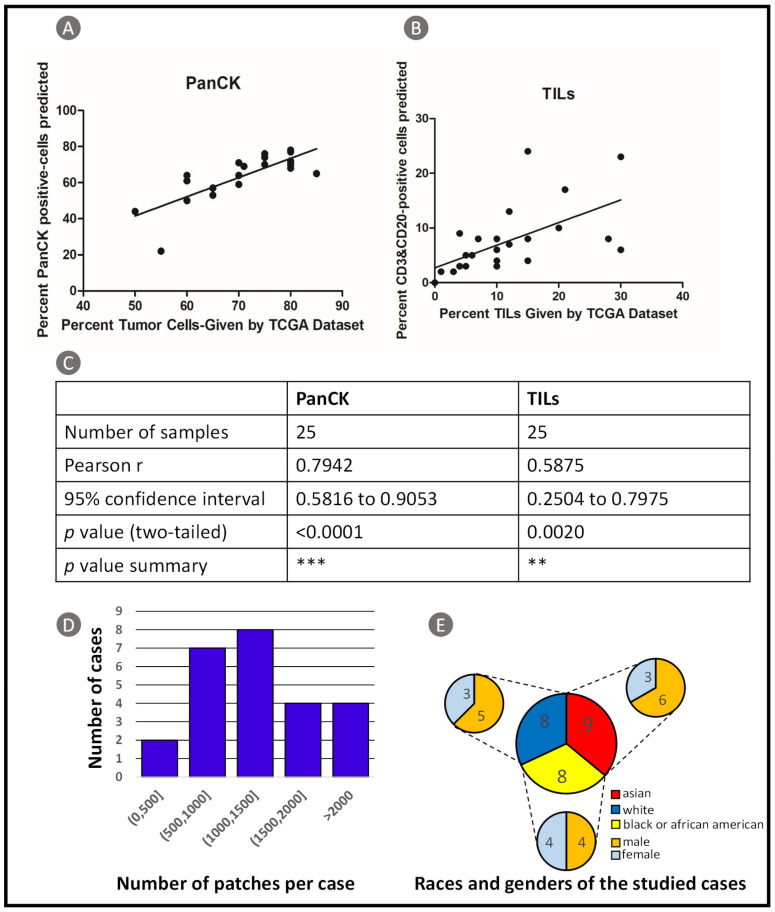
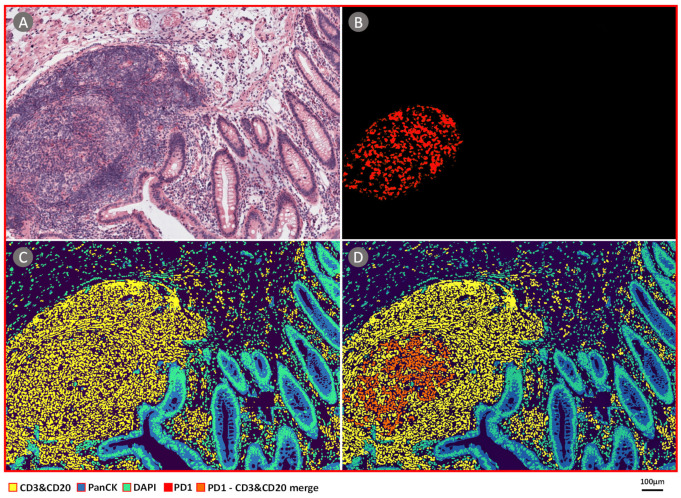
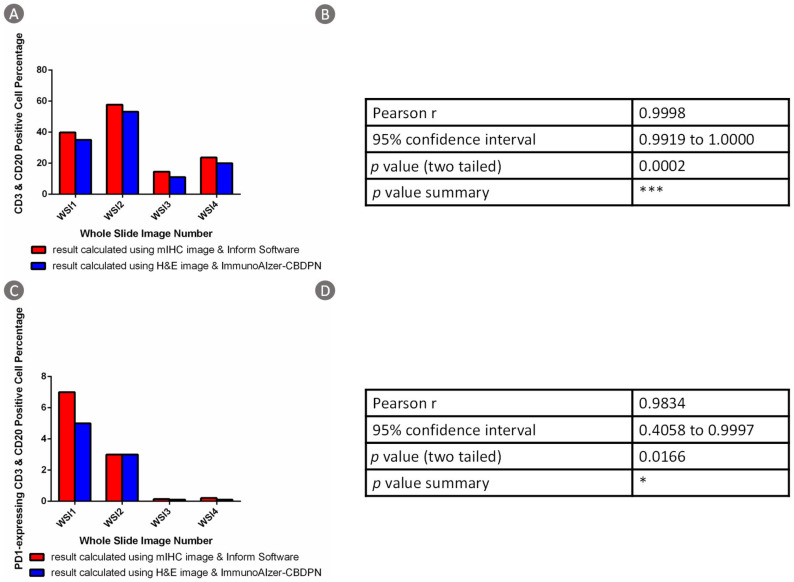
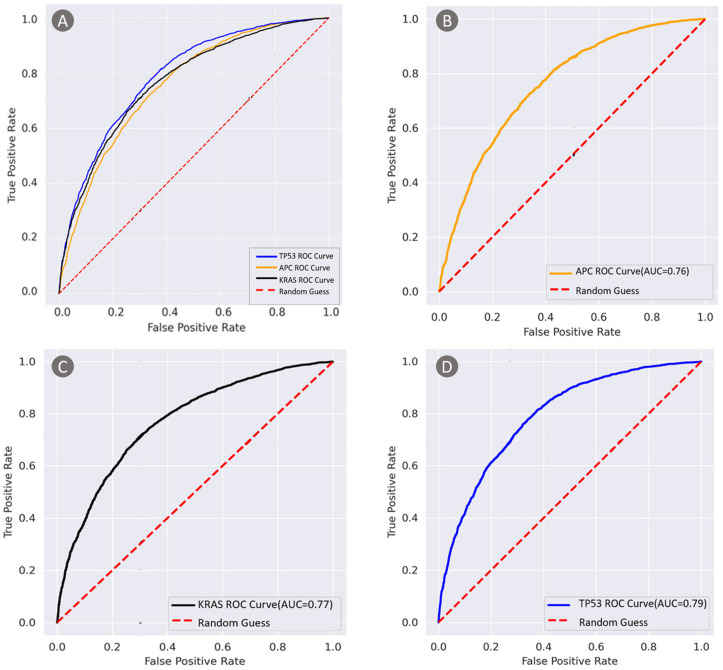
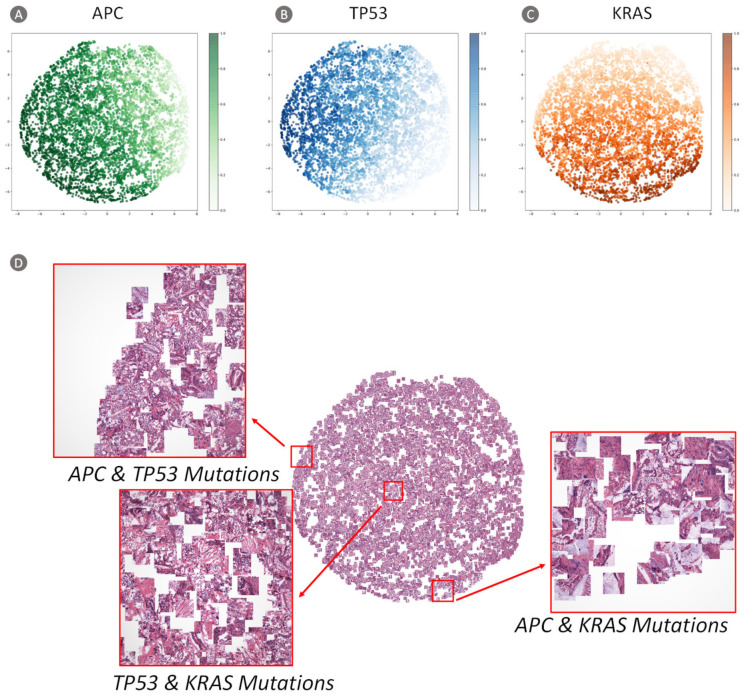
Spatial distribution of tumor infiltrating lymphocytes (TILs) and cancer cells in the tumor microenvironment (TME) along with tumor gene mutation status are of vital importance to the guidance of cancer immunotherapy and prognoses. In this work, we developed a deep learning-based computational framework, termed ImmunoAIzer, which involves: (1) the implementation of a semi-supervised strategy to train a cellular biomarker distribution prediction network (CBDPN) to make predictions of spatial distributions of CD3, CD20, PanCK, and DAPI biomarkers in the tumor microenvironment with an accuracy of 90.4%; (2) using CBDPN to select tumor areas on hematoxylin and eosin (H&E) staining tissue slides and training a multilabel tumor gene mutation detection network (TGMDN), which can detect APC, KRAS, and TP53 mutations with area-under-the-curve (AUC) values of 0.76, 0.77, and 0.79. These findings suggest that ImmunoAIzer could provide comprehensive information of cell distribution and tumor gene mutation status of colon cancer patients efficiently and less costly; hence, it could serve as an effective auxiliary tool for the guidance of immunotherapy and prognoses. The method is also generalizable and has the potential to be extended for application to other types of cancers other than colon cancer.
Keywords: biomarker; cell distribution; deep learning; hematoxylin and eosin (H&E); semi-supervised learning; tumor gene mutation; tumor microenvironment (TME).
Conflict of interest statement
The authors declare no conflict of interest.
Figures


Similar articles
-
Deep learning-based tumor microenvironment segmentation is predictive of tumor mutations and patient survival in non-small-cell lung cancer.BMC Cancer. 2022 Sep 21;22(1):1001. doi: 10.1186/s12885-022-10081-w. BMC Cancer. 2022. PMID: 36131239 Free PMC article.
-
Morphological Evaluation of Tumor-Infiltrating Lymphocytes (TILs) to Investigate Invasive Breast Cancer Immunogenicity, Reveal Lymphocytic Networks and Help Relapse Prediction: A Retrospective Study.Int J Mol Sci. 2017 Sep 8;18(9):1936. doi: 10.3390/ijms18091936. Int J Mol Sci. 2017. PMID: 28885584 Free PMC article.
-
Use of Deep Learning to Develop and Analyze Computational Hematoxylin and Eosin Staining of Prostate Core Biopsy Images for Tumor Diagnosis.JAMA Netw Open. 2020 May 1;3(5):e205111. doi: 10.1001/jamanetworkopen.2020.5111. JAMA Netw Open. 2020. PMID: 32432709 Free PMC article.
-
Immune infiltrates in the breast cancer microenvironment: detection, characterization and clinical implication.Breast Cancer. 2017 Jan;24(1):3-15. doi: 10.1007/s12282-016-0698-z. Epub 2016 May 2. Breast Cancer. 2017. PMID: 27138387 Review.
-
Are tumor-infiltrating lymphocytes protagonists or background actors in patient selection for cancer immunotherapy?Expert Opin Biol Ther. 2017 Jun;17(6):735-746. doi: 10.1080/14712598.2017.1309387. Epub 2017 Mar 28. Expert Opin Biol Ther. 2017. PMID: 28318336 Review.
Cited by
-
Integrating Spatial and Morphological Characteristics into Melanoma Prognosis: A Computational Approach.Cancers (Basel). 2024 May 27;16(11):2026. doi: 10.3390/cancers16112026. Cancers (Basel). 2024. PMID: 38893146 Free PMC article.
-
Performance of Machine Learning in Diagnosing KRAS (Kirsten Rat Sarcoma) Mutations in Colorectal Cancer: Systematic Review and Meta-Analysis.J Med Internet Res. 2025 Jul 18;27:e73528. doi: 10.2196/73528. J Med Internet Res. 2025. PMID: 40680189 Free PMC article.
-
Tissue Multiplex Analyte Detection in Anatomic Pathology - Pathways to Clinical Implementation.Front Mol Biosci. 2021 Jul 27;8:672531. doi: 10.3389/fmolb.2021.672531. eCollection 2021. Front Mol Biosci. 2021. PMID: 34386519 Free PMC article. Review.
-
Deep Learning on Histopathological Images for Colorectal Cancer Diagnosis: A Systematic Review.Diagnostics (Basel). 2022 Mar 29;12(4):837. doi: 10.3390/diagnostics12040837. Diagnostics (Basel). 2022. PMID: 35453885 Free PMC article. Review.
-
Identification of Lactate-Related Gene Signature for Prediction of Progression and Immunotherapeutic Response in Skin Cutaneous Melanoma.Front Oncol. 2022 Feb 21;12:818868. doi: 10.3389/fonc.2022.818868. eCollection 2022. Front Oncol. 2022. PMID: 35265521 Free PMC article.
References
Grants and funding
- 2017YFA0205/Ministry of Science and Technology of the People's Republic of China
- 81871514/National Natural Science Foundation of China
- 81227901/National Natural Science Foundation of China
- 81470083/National Natural Science Foundation of China
- 91859119/National Natural Science Foundation of China
- 61671449/National Natural Science Foundation of China
- 81527805/National Natural Science Foundation of China
- 61901472/National Natural Science Foundation of China
- 2018PT32003/National Public Welfare Basic Scientific Research Program of Chinese Academy of Medical Sciences
- 2017PT32004/National Public Welfare Basic Scientific Research Program of Chinese Academy of Medical Sciences
- 2018YFC0910602/National Key R&D Program of China
- 2017YFA0205200/National Key R&D Program of China
- 2017YFA0700401/National Key R&D Program of China
- 2016YFA0100902/National Key R&D Program of China
- 2016YFC0103702/National Key R&D Program of China
- 2019JM-459/National Natural Science Foundation of shaanxi Provience
LinkOut - more resources
Full Text Sources
Other Literature Sources
Molecular Biology Databases
Research Materials
Miscellaneous
