. 2021 Apr 4;14(7):1782.
doi: 10.3390/ma14071782.

Effect of D-Mannitol on the Microstructure and Rheology of Non-Aqueous Carbopol Microgels

Affiliations

Effect of D-Mannitol on the Microstructure and Rheology of Non-Aqueous Carbopol Microgels

Simona Migliozzi et al. Materials (Basel). .

Abstract

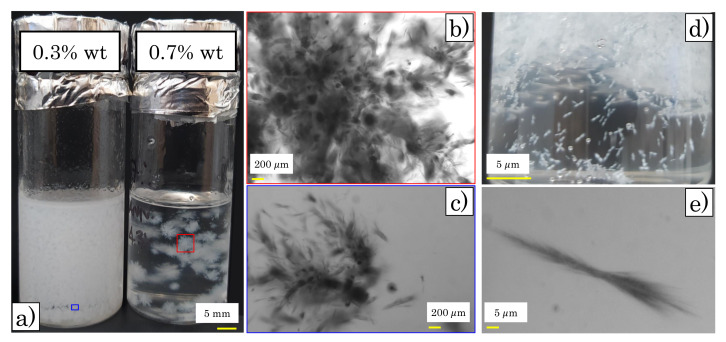
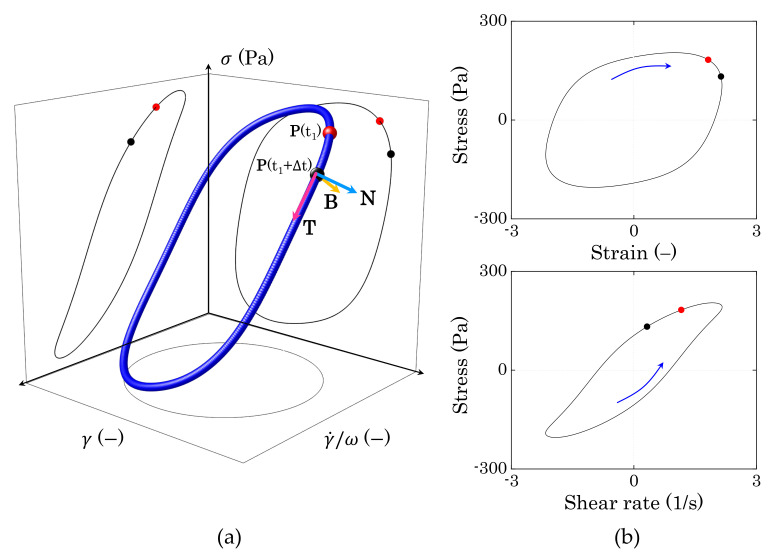
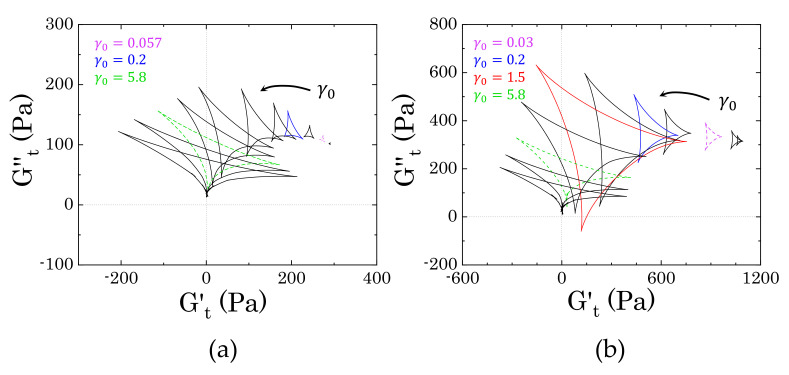
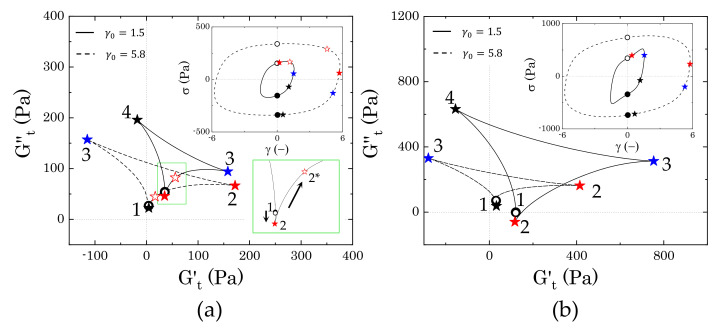
D-mannitol is a common polyol that is used as additive in pharmaceutical and personal care product formulations. We investigated its effect on the microstructure and rheology of novel non-aqueous Carbopol dispersions employing traditional and time-resolved rheological analysis. We considered two types of sample, (i) fresh (i.e., mannitol completely dissolved in solution) and aged (i.e., visible in crystalline form). The analysis of the intracycle rheological transitions that were observed for different samples revealed that, when completely dissolved in solution, mannitol does not alter the rheological behaviour of the Carbopol dispersions. This highlights that the chemical similarity of the additive with the molecules of the surrounding solvent allows preserving the swollen dimension and interparticle interactions of the Carbopol molecules. Conversely, when crystals are present, a hierarchical structure forms, consisting of a small dispersed phase (Carbopol) agglomerated around a big dispersed phase (crystals). In keeping with this microstructural picture, as the concentration of Carbopol reduces, the local dynamics of the crystals gradually start to control the integrity of the microstructure. Rheologically, this results in a higher elasticity of the suspensions at infinitesimal deformations, but a fragile yielding process at intermediate strains.

Keywords: carbopol; fluorescence microscopy; mannitol; microgels; non-aqueous formulations; nonlinear rheology, LAOS; structure-rheology relationship; yield stress.


Conflict of interest statement

The authors declare no conflict of interest. The funders had no role in the design of the study; in the collection, analyses, or interpretation of data; in the writing of the manuscript, or in the decision to publish the results.

Figures

Figure 1
Figure 1
(a) Images of samples M2 at Carbopol concentrations of 0.3% wt (left) and 0.7% wt (right) taken after two weeks from sample initial preparation. (bc) Brightfield images (upright optical microscope, Zeiss Axio Scope.A1) of a crystal isolated from the samples M2 at 0.7% wt (b) and at 0.3% wt (c) of Carbopol. (d) Detail of sample M1 at Carbopol concentration of 0.9% wt. (e) Brightfield image of a single crystal isolated from sample M1 reported in panel (d).
Figure 2
Figure 2
(a) Example of the nonlinear stress response to a periodic sinusoidal deformation reported in the three-dimensional space [γ, γ˙/ω, σ]. Each position vector P(t) on the curve can be identified through the Frenet–Serret components, as reported in figure. (b) Projections of the three-dimensional trajectory on the [γ, σ] and [γ˙/ω, σ] planes (Lissajous–Bowditch plots). The blue arrows indicate the orientation of the trajectories.
Figure 3
Figure 3
Schematic of the rheological transitions that can be observed using the Cole–Cole plot. As an example, we highlight the instantaneous trajectory of a point on the curve (yellow arrow). In that part of the cycle, the instantaneous storage modulus is decreasing, while the instantaneous loss modulus is increasing; this indicates a simultaneous softening and thickening of the material.
Figure 4
Figure 4
Relative zero-shear viscosity as a function of Carbopol concentration for mannitol contents of 0% (M0), 1.46% wt (M1), and 2.87% wt (M2). The dashed line is the fitting with Mooney’s equation.
Figure 5
Figure 5
(a) Frequency dependence of the storage (closed symbols) and loss (open symbols) moduli at increasing Carbopol concentration. The data refer to samples M0, but the same behaviour was observed for regenerated M1 and M2 solutions. (b) Storage modulus, sampled at 1 rad/s, as a function of Carbopol concentration for samples M0, M1, and M2. For the samples containing mannitol, closed symbols indicate regenerated samples, while open symbols indicate samples containing crystals. The black dashed line represents the fitting with the linear relation G0=Kp(ccc) reported in [25] for the same Carbopol dispersions in pure glycerol. A table reporting the effective mass percentages and corresponding mass concentration for each sample (i.e., M0, M1, and M2) is reported in the Supplementary Materials (Table S1).
Figure 6
Figure 6
Loss tangent, sampled at 1 rad/s, as a function of Carbopol concentration for samples M0, M1, and M2. For the samples containing mannitol, closed symbols indicate regenerated samples, while open symbols indicate samples containing crystals.
Figure 7
Figure 7
(a) Strain amplitude dependence of the storage (closed) and loss (open) moduli (upper panel) and of the corresponding normalized quantities (bottom panel) at ω=1 rad/s for a Carbopol mass fraction of 2% wt in the absence of mannitol (M0) and for the two mannitol concentrations considered, in the presence of crystals. The black arrow points to the local maximum of GN. (b) The strain amplitude dependence of the storage (closed) and loss (open) moduli (upper panel) and of the corresponding normalized quantities (bottom panel) at ω=1 rad/s for a Carbopol mass fraction of 0.9% wt in the absence of mannitol (M0) and for the two mannitol concentrations considered, in the presence of crystals. The black solid, dotted, and dashed lines are guides for the eye to indicate the two different decays, followed by GN.
Figure 8
Figure 8
Evolution of the Cole–Cole plots at increasing strain amplitudes for two samples at 2% wt of Carbopol (a) in the absence of mannitol (sample M0) and (b) with mannitol in the presence of crystals (sample M2). All of the deltoids corresponding to the most relevant transitions observed in Figure 7a are marked with a specific colour. Dashed purple line: first point deviating from the linear viscoelastic plateau; blue solid line: peak of G; red solid line: end of the first decay of G for sample M2; green dashed line: beginning of final strain-thinning behaviour.
Figure 9
Figure 9
(a) Cole–Cole plot obtained at γ0=0.057 (beginning of the deviation from the linear viscoelastic region) for sample M0 at 2% wt of Carbopol. (b) Cole–Cole plot obtained at γ0=0.03 (beginning of the deviation from the linear viscoelastic region) for sample M2 at 2% wt of Carbopol. The insets show the corresponding elastic Lissajous–Bowditch plot (i.e., stress vs. strain) for reference.
Figure 10
Figure 10
(a) Cole–Cole plot obtained at γ0=0.2 (peak of the loss modulus) for sample M0 at 2% wt of Carbopol. (b) Cole–Cole plot obtained at γ0=0.2 (peak of the loss modulus) for sample M2 at 2% wt of Carbopol. The insets show the corresponding elastic Lissajous–Bowditch plot (i.e., stress vs. strain) for reference.
Figure 11
Figure 11
(a) Cole-Cole plot obtained at γ0=1.5 (solid line) and 5.8 (dashed line) (shear-thinning region of the loss modulus) for sample M0 at 2% wt of Carbopol. (b) Cole–Cole plot obtained at γ0=1.5 (solid line) and 5.8 (dashed line) (shear-thinning region of the loss modulus) for sample M2 at 2% wt of Carbopol. The insets show the corresponding elastic Lissajous–Bowditch plot (i.e., stress vs. strain) for reference. The green inset in panel a) zooms closer to the initial steps of the trajectory found for γ0=1.5.
Figure 12
Figure 12
Evolution of the Cole–Cole plots at increasing strain amplitudes for two samples at 0.9% wt of Carbopol (a) in the absence of mannitol (sample M0) and (b) with mannitol in the presence of crystals (sample M2). All of the deltoids corresponding to the most relevant transitions observed in Figure 7b are marked with a specific colour. For panel (a), dashed purple line: first point deviating from the linear viscoelastic plateau; blue solid line: peak of G; cyan dashed line: local minimum of G; red solid line: second peak of G; green dashed line: beginning of final strain-thinning behaviour. For panel (b), dashed purple line: first point deviating from the linear viscoelastic plateau; magenta solid line: end of the first decay of G, green dashed line: beginning of final strain-thinning behaviour.
Figure 13
Figure 13
(a) Cole-Cole plot obtained at γ0=0.3 (solid line) and 1.1 (dashed line) (local minimum of G and second peak of G, respectively) for sample M0 at 0.9% wt of Carbopol; (b) Cole–Cole plot obtained at γ0=0.015 (first region of decay of G) for sample M2 at 0.9% wt of Carbopol. The insets show the corresponding elastic Lissajous–Bowditch plot (i.e., stress vs. strain) for reference.
Figure 14
Figure 14
(a) Brightfield image of sample M2 at 0.7% wt of Carbopol. Mannitol crystals are the dark areas in the image; (b) corresponding fluorescence image of the same sample. In this case, the brighter areas are Carbopol molecules; (c) superposition of the two images in panel (a,b). The red colour of the Carbopol phase was artificially obtained to better highlight the superposition between Carbopol clusters and crystals; and, (d) cartoon of the structure observed. The scale bar, reported in red in panels (ac) represents a dimension of 150 μm.
Figure 15
Figure 15
(a) Fluorescence image of sample M0 at 0.7% wt of Carbopol (scale bar, reported in red, of 150 μm); (b) cartoon of the structure observed in the absence of crystals at the same concentration. Note that a similar structure is observed for fresh or regenerated samples containing mannitol (i.e., in the absence of crystals).

References

    1. Lyon L.A., Fernandez-Nieves A. The Polymer/Colloid Duality of Microgel Suspensions. Annu. Rev. Phys. Chem. 2012;63:25–43. doi: 10.1146/annurev-physchem-032511-143735. - DOI - PubMed
    1. Karg M., Pich A., Hellweg T., Hoare T., Lyon L.A., Crassous J.J., Suzuki D., Gumerov R.A., Schneider S., Potemkin I.I., et al. Nanogels and Microgels: From Model Colloids to Applications, Recent Developments, and Future Trends. Langmuir. 2019;35:6231–6255. doi: 10.1021/acs.langmuir.8b04304. - DOI - PubMed
    1. Smeets N.M., Hoare T. Designing responsive microgels for drug delivery applications. J. Polym. Sci. Part Polym. Chem. 2013;51:3027–3043. doi: 10.1002/pola.26707. - DOI
    1. Torres O., Murray B., Sarkar A. Design of novel emulsion microgel particles of tuneable size. Food Hydrocoll. 2017;71:47–59. doi: 10.1016/j.foodhyd.2017.04.029. - DOI
    1. Boulmedarat L., Grossiord J.L., Fattal E., Bochot A. Influence of methyl-β-cyclodextrin and liposomes on rheological properties of Carbopol® 974P NF gels. Int. J. Pharm. 2003;254:59–64. doi: 10.1016/S0378-5173(02)00683-X. - DOI - PubMed

LinkOut - more resources