. 2021 Apr 4;10(4):806.
doi: 10.3390/cells10040806.

Enhanced Intestinal TGF-β/SMAD-Dependent Signaling in Simian Immunodeficiency Virus Infected Rhesus Macaques

Affiliations

Enhanced Intestinal TGF-β/SMAD-Dependent Signaling in Simian Immunodeficiency Virus Infected Rhesus Macaques

Nongthombam Boby et al. Cells. .

Abstract

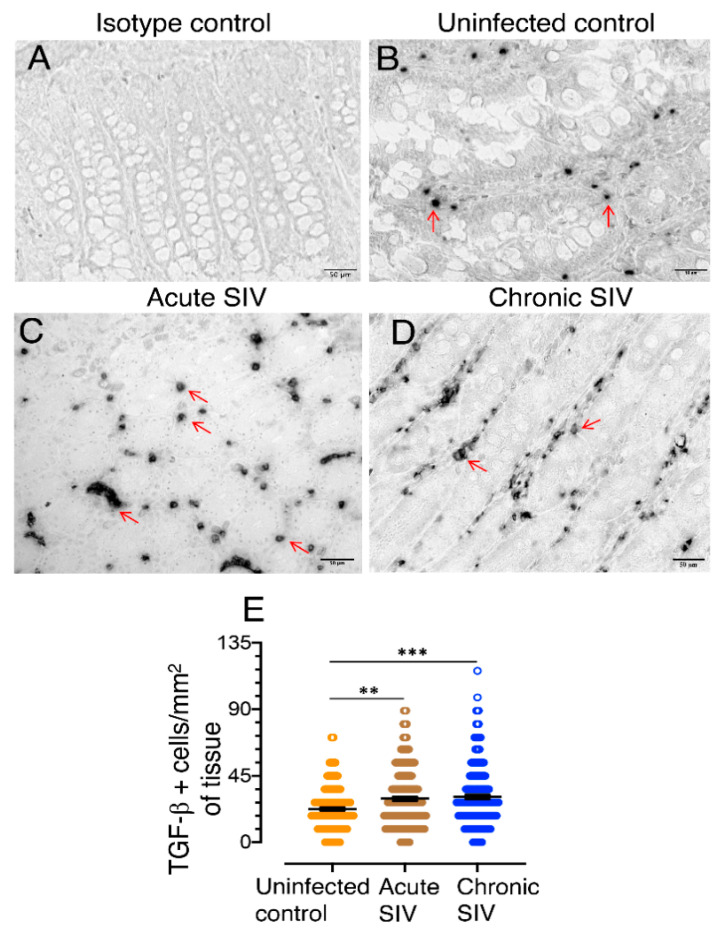
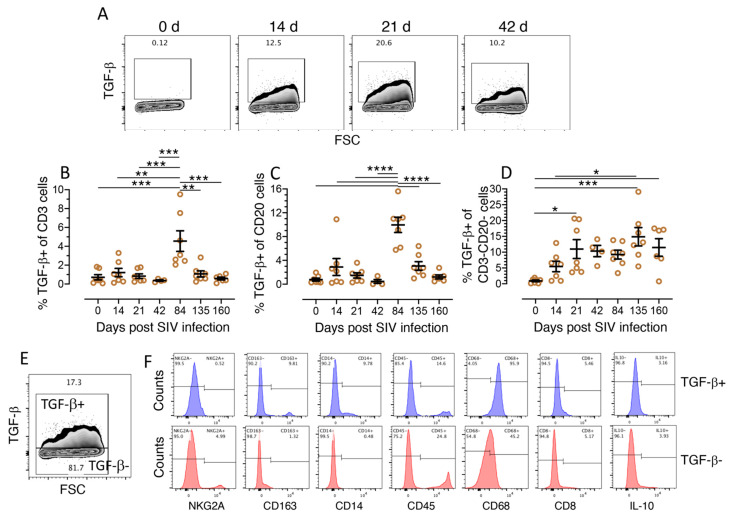
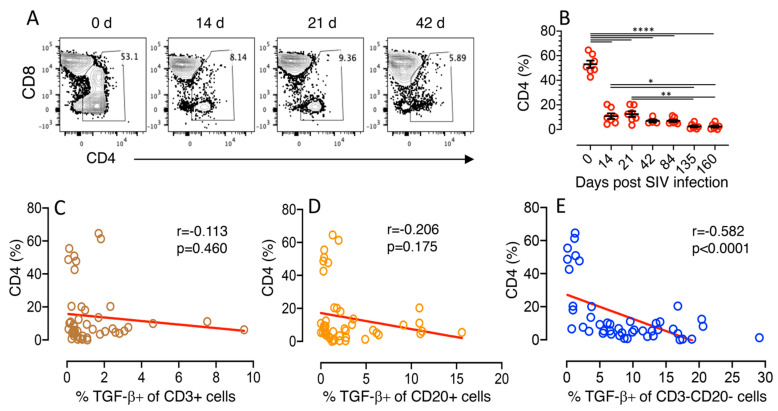
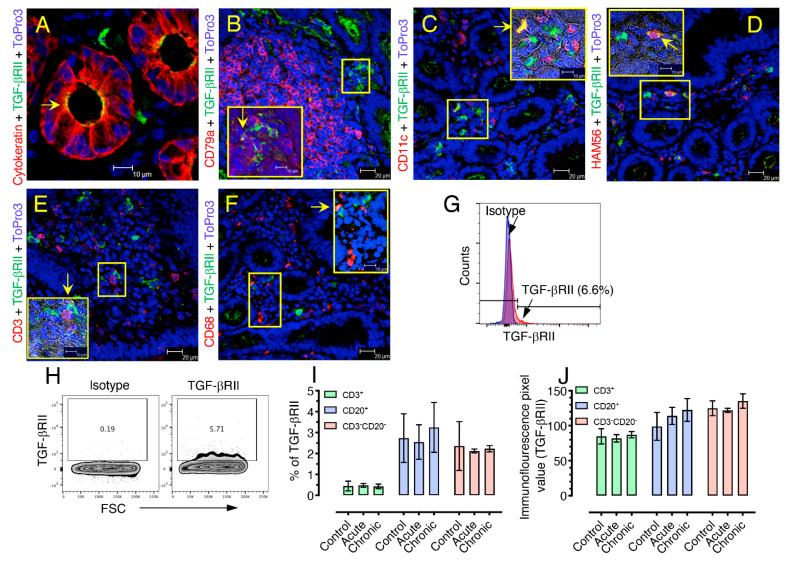
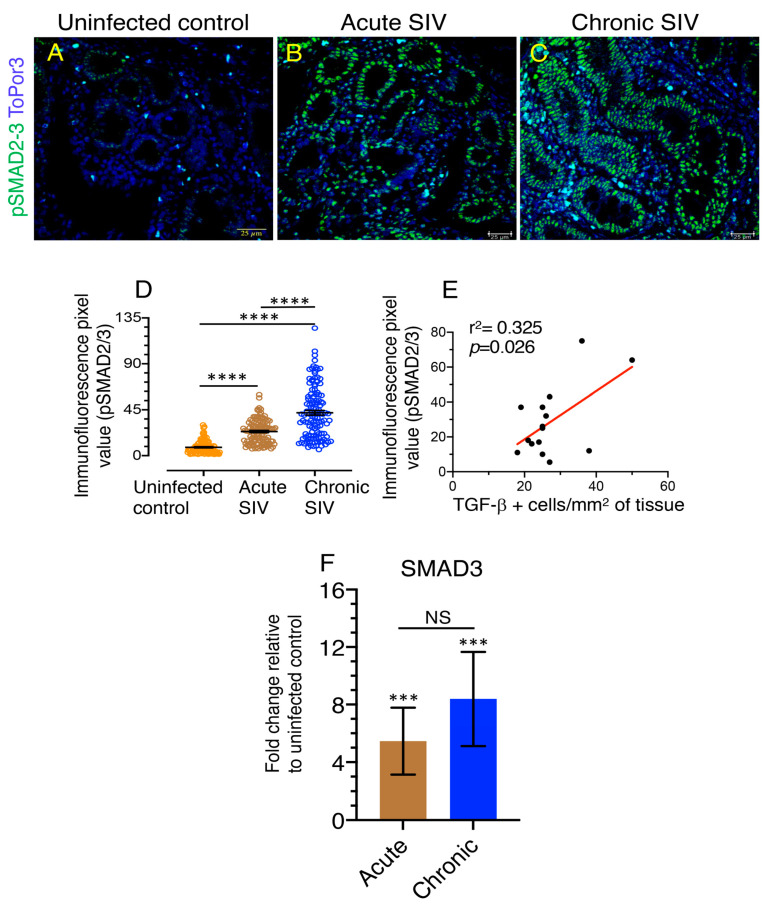
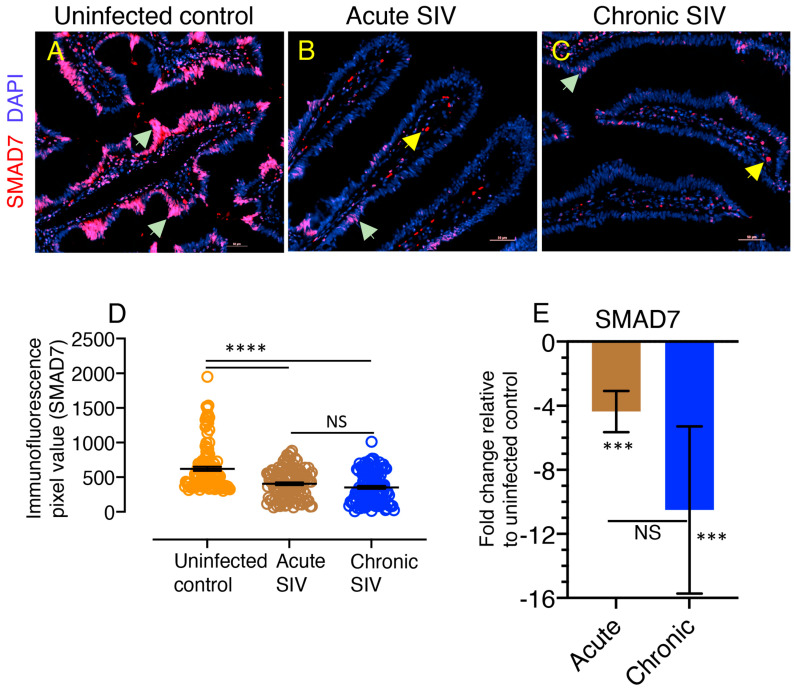
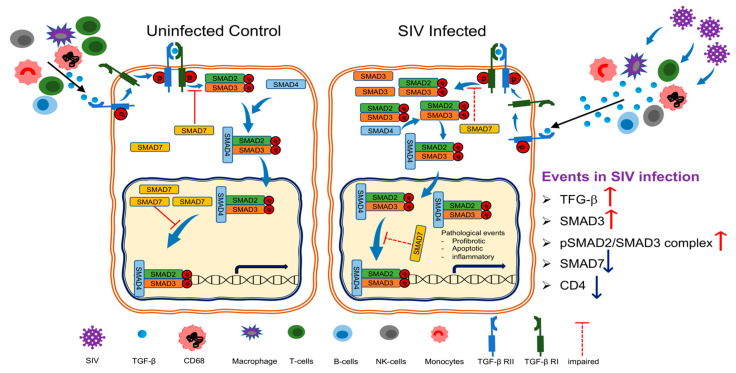
Transforming growth factor-β signaling (TGF-β) maintains a balanced physiological function including cell growth, differentiation, and proliferation and regulation of immune system by modulating either SMAD2/3 and SMAD7 (SMAD-dependent) or SMAD-independent signaling pathways under normal conditions. Increased production of TGF-β promotes immunosuppression in Human Immunodeficiency Virus (HIV)/Simian Immunodeficiency Virus (SIV) infection. However, the cellular source and downstream events of increased TGF-β production that attributes to its pathological manifestations remain unknown. Here, we have shown increased production of TGF-β in a majority of intestinal CD3-CD20-CD68+ cells from acute and chronically SIV infected rhesus macaques, which negatively correlated with the frequency of jejunum CD4+ T cells. No significant changes in intestinal TGF-β receptor II expression were observed but increased production of the pSMAD2/3 protein and SMAD3 gene expression in jejunum tissues that were accompanied by a downregulation of SMAD7 protein and gene expression. Enhanced TGF-β production by intestinal CD3-CD20-CD68+ cells and increased TGF-β/SMAD-dependent signaling might be due to a disruption of a negative feedback loop mediated by SMAD7. This suggests that SIV infection impacts the SMAD-dependent signaling pathway of TGF-β and provides a potential framework for further study to understand the role of viral factor(s) in modulating TGF-β production and downregulating SMAD7 expression in SIV. Regulation of mucosal TGF-β expression by therapeutic TGF-β blockers may help to create effective antiviral mucosal immune responses.

Keywords: CD4; CD68; SMAD signaling pathway; SMAD3; SMAD7; TGF-β receptor; TGF-β1; rhesus macaque; simian immunodeficiency virus.


Conflict of interest statement

The authors declare no conflict of interest.

Figures

Figure 1
Figure 1
TGF-β production increases in the jejunum of SIV infected macaques detected by immunohistochemistry staining. (A) Representative isotype control for TGF-β showing the absence of nonspecific background staining. Representative images of TGF-β+ cells in SIV-uninfected (B), FK25, SIV acute (C), CF65 at 21 dpi, and SIV chronically (D), CL86 at 281 dpi infected macaques are shown. The red arrows are representative of TGF-β+ cells. (E) The frequency of TGF-β+ cells/mm2 of jejunum tissue with means are shown for SIV uninfected normal (n = 11), animals with acute SIV infection (8–21 dpi, n = 11), and animals with chronic SIV infection (150–422 dpi, n =10). An average of 19–20 fields (40× magnification) was used to quantify TGF-β+ cells from each animal and each value was presented by each data point. The horizontal line denotes the mean frequencies (± standard errors) of each group. Statistically significant differences between groups as analyzed with Mann–Whitney t-test are indicated with asterisks (**, p < 0.01; ***, p < 0.001).
Figure 2
Figure 2
Increased production of TGF-β detected as early as 14 days after SIV infection in various types of mucosal cells. (A) Representative contour plots showing increased production of TGF-β in jejunum CD3CD20 cells detected as early as 14 d after SIV infection and remaining elevated throughout the course of the study. The percentages of TGF-β+ cells are shown in each box of the plot (BD). Increased percentage of TGF-β+ cells (mean ± the standard error) detected in CD3+ T cells (B), CD20+ B cells (C), and CD3CD20 cells (D) isolated from the jejunum lamina propria (n = 7) following SIV infection. Each data point represents data from one animal for the respective time points. One-way repeated ANOVA with Tukey–Kramer’s multiple comparison test was used to calculate the significant differences among different time points. Scatter dot plots are delineated as a graphical method for comparing percentages distribution of TGF-β+ cells. Asterisks indicate significant differences between time points as analyzed with the Tukey–Kramer test (*, p < 0.05; **, p < 0.01; ***, p < 0.001; ****, p < 0.0001). (E) Contour plots for both TGF-β+ and TGF-β cells among CD3CD20 cells are shown from a SIV-infected animal 135 days post infection (BD03). TGF-β+ and TGF-β cells were further analyzed for the expression of different phenotypic and intracellular markers. (F) From this chronically SIV infected animal, jejunum CD3CD20TGF-β+ (blue histogram), and CD3CD20TGF-β (red histogram) cells were analyzed for expression of markers for cytotoxic NKs (NKG2A), macrophages (CD163), monocytes (CD14), pan leukocytes (CD45), monocyte/macrophages/neutrophils/fibroblasts (CD68), cytotoxic T cells (CD8), and intracellular expression of IL-10 using different monoclonal antibodies. Percentages of positive and negative population for each marker are shown at the top of each histogram.
Figure 3
Figure 3
Frequency of TGF-β production by CD3CD20 cells negatively correlated with the frequency of mucosal CD4+ T cells. (A) Representative contour plot showing percentages of CD4+ T cells in jejunum lamina propria lymphocytes (LPL) where the frequency of jejunum CD4+ T cells decreased significantly as early as 14 days after SIV infection. The percentages of CD4+ T cells are shown in each gated plot. (B) Decreased percentage of CD4+ T cells (mean ± the standard errors) detected in jejunum LPL during the course of SIV infection (n = 7). Each data point represents data from one animal for the respective time point. Asterisks indicate significant differences between time points as analyzed with the Tukey–Kramer test (*, p < 0.05; **, p < 0.01; ****, p < 0.0001). Spearman’s rank correlation coefficient of determination between CD4 (%) and % TGF-β+ of CD3+ cells (C), CD4 (%) and % TGF-β+ of CD20+ cells (D), and CD4 (%) and % TGF-β+ of CD3CD20 cells (E) is shown for all timepoints from 7 SIV infected animals. (E) A significant negative correlation was detected with the expression of TGF-β from CD3CD20 cells and the reduction of CD4 cells in jejunum LPL.
Figure 4
Figure 4
TGF-β Receptor II expression remains unaffected during SIV infection. Representative images of TGF-βRII-expressing cells in SIV-uninfected control (EV39) jejunum tissue acquired with multilabel confocal microscopy probing for epithelial cells (cytokeratin+, A), CD79a+ B-/plasma cells (B), CD11c+ dendritic cells (C), HAM56+ macrophages (D), CD3+ T-cells (E), and monocytes/macrophages (CD68+, F) are shown. Inserts in each panel show the pattern of TGF-βRII expression in conjunction with other cellular markers. Yellow arrows show colocalization of TGF-βRII and other cellular markers (as depicted by yellow color). (G) TGF-βRII expression in isolated CD3CD20 cells from jejunum was compared to the isotype control by flow cytometry assay from an uninfected control (DJ78). (H) Contour plots of isotype control and TGF-βRII+ cells are shown for CD3CD20 jejunum cells from an uninfected control (DJ78). The frequency of positive cells is shown in each gated box. (I) Frequency of TGF-βRII+ cells in CD3+, CD20+, and CD3CD20 cells in jejunum tissue from uninfected, control, and acutely and chronically infected animals (n = 4). (J) Immunofluorescence pixel values of TGF-βRII expression on CD3+, CD20+, and CD3CD20cells in jejunum tissue from the uninfected, control, and acutely and chronically infected animals are shown (I, n = 4).
Figure 5
Figure 5
Increased levels of pSMAD2-3 complex and SMAD3 signify TGF-β/SMAD signaling dysregulation. (AC) Representative immunofluorescent images of pSMAD2/3+ cells in RhM jejunum from uninfected control (A, GN70), animals with acute ((B), EM64, 21 dpi), and chronic ((C), CL86, 281 dpi) SIV infection. ToPro3 stains the cell nucleus. Increased pSMAD2/3+ cells are noticeable during acute and chronic infection compared to uninfected control RhM. (D) Immunofluorescence pixel values of pSMAD2/3 protein expression (indicating mean ± standard error) in jejunum from uninfected control, acute (21 dpi), and chronically (167–401 dpi) SIV-infected RhMs are shown (n = 6). An average of 19–20 fields (40× magnification) was used to quantify pSMAD2/3+ cells from each animal, and each value is presented in the graph as individual data point. (E) Correlation between TGF-β+ cells/mm2 of tissues and pSMAD2/3 immunofluorescence pixel values from uninfected control, acute, and chronically SIV-infected RhMs (n = 15). Pearson correlation coefficient analysis indicates a significant positive correlation (p = 0.026). (F) Increased fold change of SMAD3 mRNA expression were observed in jejunum from acute (21 dpi) and chronically (between 226 and 401 dpi) SIV-infected RhMs compared to uninfected control RhMs using relative RT-PCR (mean ± the standard errors, n = 4) but there was no statistically significant difference between acute and chronic SIV-infected RhMs. Samples were normalized against 18S rRNA expression. In all figures, asterisks indicate statistically significant differences between the respective animal groups (***, p < 0.001; ****, p < 0.0001) using Tukey–Kramer and Mann–Whitney t-test. NS denotes not significant.
Figure 6
Figure 6
Decreased expression of SMAD7 protein and gene in SIV infection suggesting a failure of negative feedback mechanisms. (AC) Representative immunofluorescence images of SMAD7 protein in RhM jejunum from SIV uninfected control ((A), EV39), animals with acute ((B), GI28 28 dpi), and chronic ((C), BD03, 167 dpi) SIV infection. DAPI stains the cell nucleus. Decreased SMAD7+ cells are detected during acute and chronic infection compared to uninfected control animal (magenta color by colocalization). Light green arrows show SMAD7+ cells where yellow arrows are autofluorescence stain (bright red color). Note that the majority of SMAD7 expression occurs in the cell nucleus (in magenta color). (D) Immunofluorescence pixel values of SMAD7 expression (indicating mean ± the standard errors) in jejunum from uninfected control, acute (21 dpi), and chronically (167–401 dpi) SIV infected RhMs are shown (n = 6). An average of 15–20 fields of 20× magnification was used to quantify SMAD7+ cells from each animal, and each value is presented in the graph as individual data point. (E) Decreased fold change of SMAD7 mRNA expression was observed in jejunum from acute (21 dpi), and chronically (between 226 and 401 dpi) SIV-infected RhMs compared to uninfected control RhMs using relative RT-PCR (mean ± the standard errors, n = 4). Samples were normalized against 18S rRNA expression. In all figures, asterisks indicate statistically significant differences between the respective animal groups (***, p < 0.001; ****, p < 0.0001) using Tukey–Kramer and Mann–Whitney t-test. NS denotes not significant.
Figure 7
Figure 7
Enhanced TGF-β production detected during SIV infection. In normal, SIV uninfected control macaques active TGF-β produced from macrophages, B cells, T cells, and monocytes mediates its function after binding with the TGF-β receptor I and II (TGF-βRI and TGF-βRII), which recruits and phosphorylates TGF-βRI and SMAD proteins, a family of conserved transcription factors. Once phosphorylated, SMAD2 and SMAD3 bind with SMAD4, forming a heterodimer that enters the nucleus where it can interact with various transcription factors, coactivators, or corepressors to modulate multiple gene expressions. SMAD7 inhibits TGF-β signaling by inhibiting the formation of SMAD2/SMAD3/SMAD4 complexes or restricting binding of these complexes to DNA, thereby inhibiting transcription. During SIV infection there was a dysregulation of TGF-β production and signaling. Increased TGF-β production, along with increased SMAD3 and upregulation of pSMAD2/SMAD3 complex were detected. However, increased TGF-β production from CD3CD20 cells was also negatively correlated with decreased mucosal CD4 population. SMAD7 expression was also significantly downregulated in SIV infection. Collectively, the enhanced TGF-β production might have negatively impacted intestinal cytokine milieu. Regulation of mucosal TGF-β expression will help to generate effective antiviral mucosal immune responses.

Similar articles

Cited by

References

    1. Pahar B., Pan D., Lala W., Kenway-Lynch C.S., Das A. Transforming growth factor-β1 regulated phosphorylated AKT and interferon gamma expressions are associated with epithelial cell survival in rhesus macaque colon explants. Clin. Immunol. 2015;158:8–18. doi: 10.1016/j.clim.2015.03.001. - DOI - PMC - PubMed
    1. Blobe G.C., Schiemann W.P., Lodish H.F. Role of transforming growth factor β in human disease. N. Engl. J. Med. 2000;342:1350–1358. doi: 10.1056/NEJM200005043421807. - DOI - PubMed
    1. Kubiczkova L., Sedlarikova L., Hajek R., Sevcikova S. TGF-β—An excellent servant but a bad master. J. Transl. Med. 2012;10:183. doi: 10.1186/1479-5876-10-183. - DOI - PMC - PubMed
    1. Wakefield L.M., Roberts A.B. TGF-β signaling: Positive and negative effects on tumorigenesis. Curr. Opin. Genet. Dev. 2002;12:22–29. doi: 10.1016/S0959-437X(01)00259-3. - DOI - PubMed
    1. Derynck R., Budi E.H. Specificity, versatility, and control of TGF-β family signaling. Sci. Signal. 2019;12 doi: 10.1126/scisignal.aav5183. - DOI - PMC - PubMed

Publication types

MeSH terms

Substances

LinkOut - more resources