

NRF2 Enables EGFR Signaling in Melanoma Cells
- PMID: 33916908
- PMCID: PMC8067606
- DOI: 10.3390/ijms22083803
NRF2 Enables EGFR Signaling in Melanoma Cells
Abstract
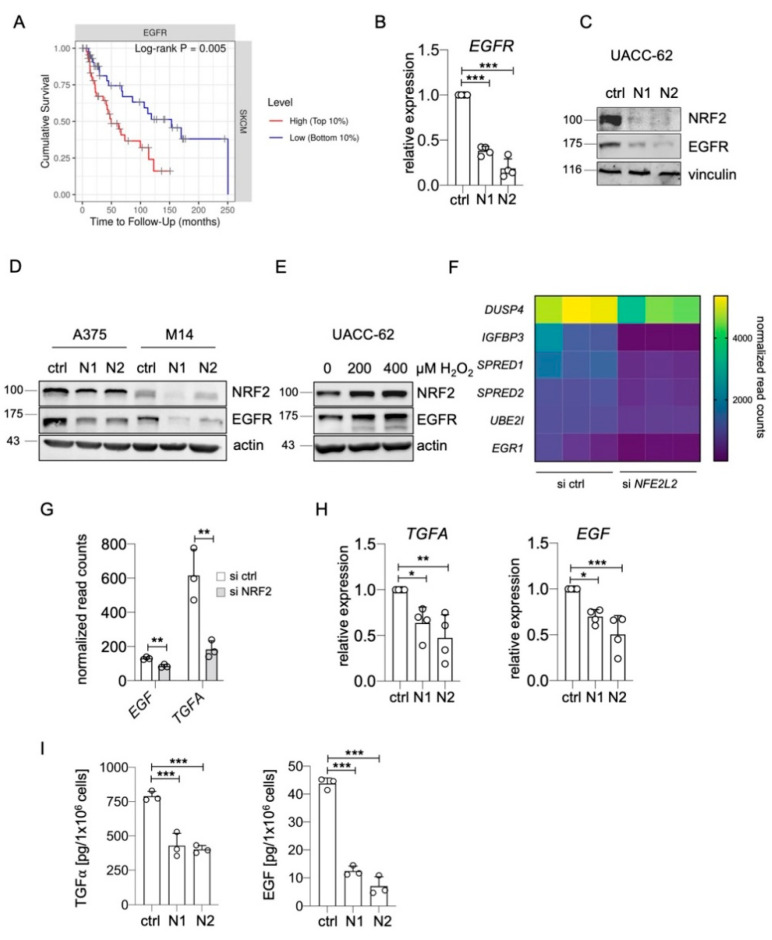
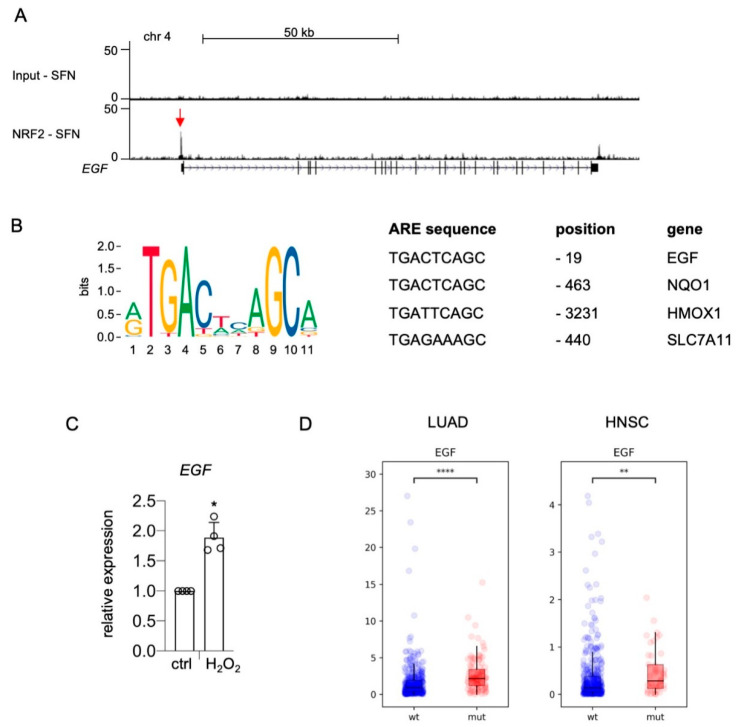
Receptor tyrosine kinases (RTK) are rarely mutated in cutaneous melanoma, but the expression and activation of several RTK family members are associated with a proinvasive phenotype and therapy resistance. Epidermal growth factor receptor (EGFR) is a member of the RTK family and is only expressed in a subgroup of melanomas with poor prognosis. The insight into regulators of EGFR expression and activation is important for the understanding of the development of this malignant melanoma phenotype. Here, we describe that the transcription factor NRF2, the master regulator of the oxidative and electrophilic stress response, mediates the expression and activation of EGFR in melanoma by elevating the levels of EGFR as well as its ligands EGF and TGFα. ChIP sequencing data show that NRF2 directly binds to the promoter of EGF, which contains a canonical antioxidant response element. Accordingly, EGF is induced by oxidative stress and is also increased in lung adenocarcinoma and head and neck carcinoma with mutationally activated NRF2. In contrast, regulation of EGFR and TGFA occurs by an indirect mechanism, which is enabled by the ability of NRF2 to block the activity of the melanocytic lineage factor MITF in melanoma. MITF effectively suppresses EGFR and TGFA expression and therefore serves as link between NRF2 and EGFR. As EGFR was previously described to stimulate NRF2 activity, the mutual activation of NRF2 and EGFR pathways was investigated. The presence of NRF2 was necessary for full EGFR pathway activation, as NRF2-knockout cells showed reduced AKT activation in response to EGF stimulation compared to controls. Conversely, EGF led to the nuclear localization and activation of NRF2, thereby demonstrating that NRF2 and EGFR are connected in a positive feedback loop in melanoma. In summary, our data show that the EGFR-positive melanoma phenotype is strongly supported by NRF2, thus revealing a novel maintenance mechanism for this clinically challenging melanoma subpopulation.
Keywords: EGF; EGFR; HNSC; KEAP1; MITF-low; NFE2L2; NRF2; NSCLC; TGF-alpha.
Conflict of interest statement
The authors declare no conflict of interest.
Figures


Similar articles
-
Molecular mechanisms for the regulation of Nrf2-mediated cell proliferation in non-small-cell lung cancers.Oncogene. 2012 Nov 8;31(45):4768-77. doi: 10.1038/onc.2011.628. Epub 2012 Jan 16. Oncogene. 2012. PMID: 22249257
-
NRF2 activates growth factor genes and downstream AKT signaling to induce mouse and human hepatomegaly.J Hepatol. 2020 Jun;72(6):1182-1195. doi: 10.1016/j.jhep.2020.01.023. Epub 2020 Feb 24. J Hepatol. 2020. PMID: 32105670 Free PMC article.
-
Nrf2/Keap1 Pathway and Expression of Oxidative Stress Lesions 8-hydroxy-2'-deoxyguanosine and Nitrotyrosine in Melanoma.Anticancer Res. 2016 Apr;36(4):1497-506. Anticancer Res. 2016. PMID: 27069125
-
ErbB Receptors and Cancer.Methods Mol Biol. 2017;1652:3-35. doi: 10.1007/978-1-4939-7219-7_1. Methods Mol Biol. 2017. PMID: 28791631 Review.
-
Counteracting role of nuclear factor erythroid 2-related factor 2 pathway in Alzheimer's disease.Biomed Pharmacother. 2020 Sep;129:110373. doi: 10.1016/j.biopha.2020.110373. Epub 2020 Jun 27. Biomed Pharmacother. 2020. PMID: 32603894 Review.
Cited by
-
Thiol starvation triggers melanoma state switching in an ATF4 and NRF2-dependent manner.Redox Biol. 2024 Apr;70:103011. doi: 10.1016/j.redox.2023.103011. Epub 2023 Dec 27. Redox Biol. 2024. PMID: 38219574 Free PMC article.
-
Momordica cochinchinensis (Gấc) Seed Extracts Induce Apoptosis and Necrosis in Melanoma Cells.Pharmaceuticals (Basel). 2023 Jan 9;16(1):100. doi: 10.3390/ph16010100. Pharmaceuticals (Basel). 2023. PMID: 36678596 Free PMC article.
-
Aloysia Citrodora Essential Oil Inhibits Melanoma Cell Growth and Migration by Targeting HB-EGF-EGFR Signaling.Int J Mol Sci. 2021 Jul 29;22(15):8151. doi: 10.3390/ijms22158151. Int J Mol Sci. 2021. PMID: 34360915 Free PMC article.
-
The Role of Protein SUMOylation in Human Hepatocellular Carcinoma: A Potential Target of New Drug Discovery and Development.Cancers (Basel). 2021 Nov 14;13(22):5700. doi: 10.3390/cancers13225700. Cancers (Basel). 2021. PMID: 34830854 Free PMC article. Review.
-
RNAi-based ALOX15B silencing augments keratinocyte inflammation in vitro via EGFR/STAT1/JAK1 signalling.Cell Death Dis. 2025 Jan 22;16(1):39. doi: 10.1038/s41419-025-07357-x. Cell Death Dis. 2025. PMID: 39843435 Free PMC article.
References
-
- Appenzeller S., Gesierich A., Thiem A., Hufnagel A., Jessen C., Kneitz H., Regensburger M., Schmidt C., Zirkenbach V., Bischler T., et al. The identification of patient-specific mutations reveals dual pathway activation in most patients with melanoma and activated receptor tyrosine kinases in BRAF/NRAS wild-type melanomas. Cancer. 2019;125:586–600. doi: 10.1002/cncr.31843. - DOI - PubMed
-
- Villanueva J., Infante J.R., Krepler C., Reyes-Uribe P., Samanta M., Chen H.Y., Li B., Swoboda R.K., Wilson M., Vultur A., et al. Concurrent MEK2 mutation and BRAF amplification confer resistance to BRAF and MEK inhibitors in melanoma. Cell Rep. 2013;4:1090–1099. doi: 10.1016/j.celrep.2013.08.023. - DOI - PMC - PubMed
-
- Long G.V., Fung C., Menzies A.M., Pupo G.M., Carlino M.S., Hyman J., Shahheydari H., Tembe V., Thompson J.F., Saw R.P., et al. Increased MAPK reactivation in early resistance to dabrafenib/trametinib combination therapy of BRAF-mutant metastatic melanoma. Nat. Commun. 2014;5:5694. doi: 10.1038/ncomms6694. - DOI - PubMed
MeSH terms
Substances
Grants and funding
LinkOut - more resources
Full Text Sources
Other Literature Sources
Medical
Molecular Biology Databases
Research Materials
Miscellaneous
