. 2021 Apr 7;22(8):3806.
doi: 10.3390/ijms22083806.

Oxidative Stress-Induced Sirtuin1 Downregulation Correlates to HIF-1α, GLUT-1, and VEGF-A Upregulation in Th1 Autoimmune Hashimoto's Thyroiditis

Affiliations

Oxidative Stress-Induced Sirtuin1 Downregulation Correlates to HIF-1α, GLUT-1, and VEGF-A Upregulation in Th1 Autoimmune Hashimoto's Thyroiditis

Michaël Hepp et al. Int J Mol Sci. .

Abstract

In Hashimoto's thyroiditis (HT), oxidative stress (OS) is driven by Th1 cytokines' response interfering with the normal function of thyrocytes. OS results from an imbalance between an excessive production of reactive oxygen species (ROS) and a lowering of antioxidant production. Moreover, OS has been shown to inhibit Sirtuin 1 (SIRT1), which is able to prevent hypoxia-inducible factor (HIF)-1α stabilization. The aims of this study were to determine the involvement of NADPH-oxidases (NOX), SIRT1, and HIF-1α in HT pathophysiology as well as the status of antioxidant proteins such as peroxiredoxin 1 (PRDX1), catalase, and superoxide dismutase 1 (SOD1). The protein expressions of NOX2, NOX4, antioxidant enzymes, SIRT1, and HIF-1α, as well as glucose transporter-1 (GLUT-1) and vascular endothelial growth factor A (VEGF-A), were analyzed by Western blot in primary cultures of human thyrocytes that were or were not incubated with Th1 cytokines. The same proteins were also analyzed by immunohistochemistry in thyroid samples from control and HT patients. In human thyrocytes incubated with Th1 cytokines, NOX4 expression was increased whereas antioxidants, such as PRDX1, catalase, and SOD1, were reduced. Th1 cytokines also induced a significant decrease of SIRT1 protein expression associated with an upregulation of HIF-1α, GLUT-1, and VEGF-A proteins. With the exception of PRDX1 and SOD1, similar results were obtained in HT thyroids. OS due to an increase of ROS produced by NOX4 and a loss of antioxidant defenses (PRDX1, catalase, SOD1) correlates to a reduction of SIRT1 and an upregulation of HIF 1α, GLUT-1, and VEGF-A. Our study placed SIRT1 as a key regulator of OS and we, therefore, believe it could be considered as a potential therapeutic target in HT.

Keywords: HIF-1α; Hashimoto’s thyroiditis; NOX4; Sirtuin1; oxidative stress.


Conflict of interest statement

The authors declare no conflict of interest. Authors have nothing to disclose. No competing financial interests exist.

Figures

Figure 1
Figure 1
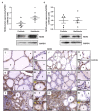
ROS production and NOX4 protein expression increased in primary cultures of human thyrocytes treated with Th1 cytokines, mimicking Hashimoto’s thyroiditis, while NOX2 protein expression did not change. Human thyrocytes were treated for 24 h with Il-1α and IFNγ. Cells were immersed in a 1-µM solution of CM-H2DCFDA for 30 min. Nuclei were stained by Hoescht. Images shown are representative of each condition. The picture on the left shows non-treated control thyrocytes (A) and Th1 cytokines-treated thyrocytes are displayed on the right (B). Scale bar = 10 µm. ROS levels were increased in thyrocytes treated with Th1 cytokines compared to controls. Quantification of ROS expression was analyzed using ImageJ software (C). Fluorescence was quantified and normalized to the number of nuclei. Results are expressed as means ± standard error of the mean (SEM) from four experiments (n = 4). ** p < 0.01 compared to control. NOX4 (D) and NOX2 (E) protein expressions were quantified by Western blot technique in human thyrocytes treated or not with Th1 cytokines. Th1 cytokines induced a significant increase of NOX4 expression while NOX2 did not change. Densitometric values were normalized against the β-actin level. Results are expressed as means ± SEM from three (NOX4) and five (NOX2) experiments (n = 3–5) at least in duplicate. * p < 0.05 compared to control. A representative blot is shown.
Figure 2
Figure 2
NOX4 protein expression was increased in Hashimoto’s thyroiditis (HT) thyroid samples while NOX2 did not change. Western blots performed on control and Hashimoto’s thyroiditis (HT) thyroid samples revealed a significant increase of NOX4 protein in HT (A), but no change in NOX2 (B). Densitometric values were normalized against Glyceraldehyde 3-phosphate dehydrogenase (GAPDH) level. Results are expressed as means ± SEM from five or six individual samples (n = 5–6). * p < 0.05 compared to control. Representative blots are shown. Immunohistochemistry on paranodular tissue obtained from multinodular goiter patients designated as controls (C,F) and thyroid tissues from HT patients (D,E,G,H). The pictures illustrate representative tissue samples of both conditions. In control thyroids, the expression of NOX4 (C) and NOX2 proteins (F) was more intense in active follicles (*) than in hypofunctional follicles (†). In HT non-inflammatory zone, hypofunctional follicles (†) lightly expressed NOX4 (D) and NOX2 (G). In contrast, thyrocytes of altered active-like follicles ($) expressed strongly NOX4 in their cytoplasm (D) while NOX2 was moderately expressed (G). In HT inflammatory zones, the numerous altered active-like follicles ($) expressed elevated levels of NOX4 in the cytoplasm of their thyrocytes (E). NOX2 was highly expressed in inflammatory cells (H). (CH) Scale bar = 50 µm. (C1H2) Scale bar = 20 µm.
Figure 3
Figure 3
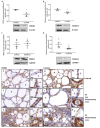
Antioxidant proteins, PRDX1, and catalase, were decreased by Th1 cytokines and catalase was significantly decreased in thyroid samples. PRDX1 and catalase protein expression were quantified by Western blot technique. Primary cultures of human thyrocytes treated with Th1 cytokines had significantly reduced PRDX1 (A) and catalase (B) expression. Densitometric values were normalized against the β-actin level. Results are expressed as means ± SEM from three experiments (n = 3) at least in duplicate. In HT thyroid samples, PRDX1 protein expression (C) was unchanged as compared to controls, while catalase protein expression (D) was significantly reduced. Densitometric values were normalized against GAPDH level. Values are expressed as means ± SEM from five or six individual samples (n = 5–6). * p < 0.05, compared to controls. Representative blots are shown. Immunohistochemically stained sections of paranodular tissue from multinodular goiter patients designated as controls (E,H) and HT thyroid tissues (F,G,I,J). In control glands, hypofunctional follicles (†) expressed low levels of PRDX1 and active follicles (*) showed an increased PRDX1 (E) and catalase (H) marking. In HT thyroids, hypofunctional (†) and altered active-like ($) follicles in non-inflammatory zone presented, respectively, no and low staining of PRDX1 (F) and of catalase (I). In inflammatory zones, active-like follicles ($) strongly expressed PRDX1 (G) and catalase (J). Illustrated images are representative of both conditions. (EJ) Scale bar = 50 µm. (E1J2) Scale bar = 20 µm.
Figure 4
Figure 4
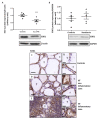
SOD1 protein expression was decreased by Th1 cytokines and unchanged in HT thyroid samples. Human thyrocytes treated with Th1 cytokines showed a significant reduction of SOD1 expression compared to non-treated cells (A). Densitometric values were normalized against β-actin level. Results are expressed as means ± SEM from five experiments (n = 5) at least in duplicate. ** p < 0.01 compared to controls. (B) In HT thyroids, SOD1 expression was similar to controls. Densitometric values were normalized against GAPDH level. Values are expressed as means ± SEM from five or six individual samples (n = 5–6). Representative blots are shown. SOD1 immunostaining was similar in control (C) and HT thyroids (D,E). Images shown are representative of each condition. (CE) Scale bar = 50 µm. (C1E2) Scale bar = 20 µm. (†) hypofunctional follicles, ($) altered active-like follicles.
Figure 5
Figure 5
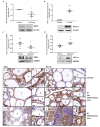
In Th1-HT context, SIRT1 was downregulated while HIF-α was upregulated. Addition of Th1 cytokines to primary cultures of human thyrocytes induced a significant reduction of SIRT1 (A) and an increase of HIF-1α protein (B). Densitometric values were normalized against the β-actin level. Results are expressed as means ± SEM from seven (SIRT1) and four (HIF-1α) experiments (n = 4–7) at least in duplicate. SIRT1 protein expression (C) was significantly decreased in HT patients while HIF-1α (D) was increased. Densitometric values were normalized against the GAPDH level. Results are expressed as means ± SEM from five or six individual samples (n = 5–6). * p < 0.05, *** p < 0.005 compared to controls. Representative blots are shown. Paranodular tissue from multinodular goiter patients designated as controls (E,H) and HT thyroid samples (F,G,I,J) were used to perform IHC with SIRT1 and HIF-1α specific antibodies. In controls (E), SIRT1 was detected in thyrocytes of hypofunctional follicles (†) and more intensively in active follicles (*). In HT (F,G), staining was less intense in altered active-like follicles ($). In control thyroids (H), HIF-1α staining was observed in the cytoplasm of the thyrocytes († and *). In HT thyroids (I,J), non-inflammatory and inflammatory zones displayed hypofunctional (†) and altered active-like ($) follicles with strong staining of HIF-1α in thyrocyte cytoplasm. Illustrations shown are representative of both conditions. (E,J) Scale bar = 50 µm. (E1J2) Scale bar = 20 µm.
Figure 6
Figure 6
GLUT-1 and VEGF-A expressions were increased in Th1-HT context. GLUT-1 and VEGF-A protein expressions were quantified using Western blot technique. Significantly increased GLUT-1 was observed in thyroid cells treated with Th1 cytokines (A). Similar result was obtained for VEGF-A protein (B). Densitometric values were normalized against β-actin level. Results are expressed as means ± SEM from three (GLUT-1) and four (VEGF-A) experiments (n = 3–4) at least in duplicate. GLUT-1 was highly increased in HT patients compared to controls (C). A significant increase of VEGF-A protein expression was also observed in HT thyroids compared to controls (D). Densitometric values were normalized against the GAPDH level. Results are expressed as means ± SEM from five or six individual samples (n = 5–6). * p < 0.05 compared to controls. Representative blots are shown. Faint GLUT-1 immunolabelling was detected in control thyroids (E) and the staining was more pronounced in active follicles (*). In non-inflammatory zones of HT thyroids, thyrocytes of altered active-like follicles ($) and hypofunctional follicles (†) showed considerable, diffuse, and cytoplasmic staining of GLUT-1 (F). In inflammatory zones, GLUT-1 expression was still more pronounced in active-like follicles ($) (G). In control thyroids (H), VEGF-A staining was low in hypofunctional follicles (†) and was moderate in active follicles (*). Both hypofunctional (†) and altered active-like follicles ($) in non-inflammatory zone (I) and inflammatory zone (J) of HT thyroids strongly expressed VEGF-A protein. Images show representative samples. (EJ) Scale bar = 50 µm. (E1J2) Scale bar = 20 µm.
Figure 7
Figure 7
SIRT1 is a new, possible key element in the physiopathogenesis of Th1 autoimmune Hashimoto’s thyroiditis. In normal thyroid, the redox balance is properly controlled and SIRT1 is expressed in the thyrocytes’ cytoplasm, mainly in active follicles. In Hashimoto’s thyroiditis, Th1 cytokines increase ROS production by upregulating NOX4 and decreasing the antioxidant enzymes such as PRDX1, catalase, and SOD1. The disruption of the redox balance induces an oxidative stress, particularly in altered active-like follicles. HIF-1α and its targets, VEGF-A and GLUT-1, are overexpressed by Th1 cytokines and in Hashimoto’s patients. The downregulation of SIRT1 by Th1 cytokines and in Hashimoto’s patients is a key event in the thyroiditis pathogenesis since SIRT1 has been shown in other cell types to be able to modulate oxidative stress by regulating NOX4 and HIF-1α. (T) inhibitor arrow and (↑) activator arrow.

Similar articles

Cited by

References

    1. Pearce E.N., Farwell A.P., Braverman L.E. Thyroiditis. N. Engl. J. Med. 2003;348:2646–2655. doi: 10.1056/NEJMra021194. - DOI - PubMed
    1. Singer P.A. Thyroiditis. Acute, subacute, and chronic. Med. Clin. N. Am. 1991;75:61–77. doi: 10.1016/S0025-7125(16)30472-2. - DOI - PubMed
    1. Phenekos C., Vryonidou A., Gritzapis A.D., Baxevanis C.N., Goula M., Papamichail M. Th1 and Th2 serum cytokine profiles characterize patients with Hashimoto’s thyroiditis (Th1) and Graves’ disease (Th2) Neuroimmunomodulation. 2004;11:209–213. doi: 10.1159/000078438. - DOI - PubMed
    1. Giannakou M., Saltiki K., Mantzou E., Loukari E., Philippou G., Terzidis K., Lili K., Stavrianos C., Kyprianou M., Alevizaki M. RAGE polymorphisms and oxidative stress levels in Hashimoto’s thyroiditis. Eur. J. Clin. Investig. 2017;47:341–347. doi: 10.1111/eci.12739. - DOI - PubMed
    1. Ruggeri R.M., Vicchio T.M., Cristani M., Certo R., Caccamo D., Alibrandi A., Giovinazzo S., Saija A., Campenni A., Trimarchi F., et al. Oxidative stress and advanced glycation end products in Hashimoto’s thyroiditis. Thyroid. 2016;26:504–511. doi: 10.1089/thy.2015.0592. - DOI - PubMed

MeSH terms

LinkOut - more resources