Review
. 2021 Apr 6;13(7):1737.
doi: 10.3390/cancers13071737.

Plasma-Treated Solutions (PTS) in Cancer Therapy

Affiliations
Review

Plasma-Treated Solutions (PTS) in Cancer Therapy

Hiromasa Tanaka et al. Cancers (Basel). .

Abstract

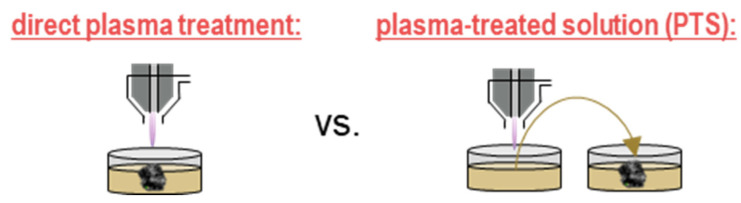
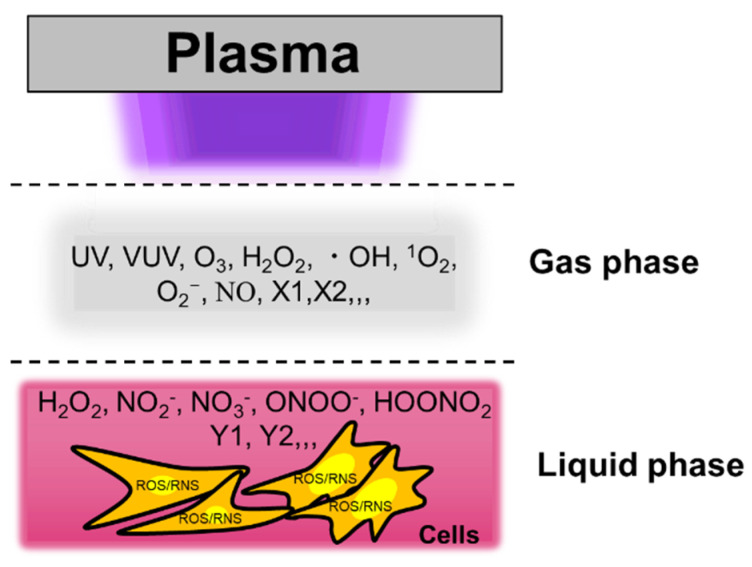
Cold physical plasma is a partially ionized gas generating various reactive oxygen and nitrogen species (ROS/RNS) simultaneously. ROS/RNS have therapeutic effects when applied to cells and tissues either directly from the plasma or via exposure to solutions that have been treated beforehand using plasma processes. This review addresses the challenges and opportunities of plasma-treated solutions (PTSs) for cancer treatment. These PTSs include plasma-treated cell culture media in experimental research as well as clinically approved solutions such as saline and Ringer's lactate, which, in principle, already qualify for testing in therapeutic settings. Several types of cancers were found to succumb to the toxic action of PTSs, suggesting a broad mechanism of action based on the tumor-toxic activity of ROS/RNS stored in these solutions. Moreover, it is indicated that the PTS has immuno-stimulatory properties. Two different routes of application are currently envisaged in the clinical setting. One is direct injection into the bulk tumor, and the other is lavage in patients suffering from peritoneal carcinomatosis adjuvant to standard chemotherapy. While many promising results have been achieved so far, several obstacles, such as the standardized generation of large volumes of sterile PTS, remain to be addressed.

Keywords: PAM; cold physical plasma; low-temperature plasma; nonthermal plasma; oncology; plasma medicine; plasma-activated medium; reactive nitrogen species; reactive oxygen species.


Conflict of interest statement

The authors declare no conflict of interest.

Figures

Figure 1
Figure 1
Direct plasma treatment exposes the biological target such as in vitro cells or in vivo or ex vivo tissue directly to the plasma gas phase. Plasma-treated solution (PTS), in turn, is generated by exposing a solution to the plasma gas phase and subsequently transferring this liquid to a target cell culture in vitro or for injection in vivo. Reproduced from [28]. Copyright 2020 MDPI.
Figure 2
Figure 2
Reactive species in the plasma gas phase dissolve into the bulk liquid to subsequently reach the cells with potentially cytotoxic consequences. The example shows an in vitro setup. Modified from [29]. Copyright 2014 IEEE.
Figure 3
Figure 3
Intracellular reactive oxygen and nitrogen species (ROS/RNS) dynamics in Plasma-Treated Solution (PTS)-exposed HeLa cells. (a) total RONS determined using CM-H2DCFDA fluorescent stain reagent; (b) H2O2 determined using OxiVision fluorescent stain reagent; (c)•NO determined using DAF-FM-DA fluorescent stain reagent; (d) •O2- determined using DHE fluorescent stain reagent; (e) •OH, ONOO, and OCl determined using APF fluorescent stain reagent; (f) •OH and ONOO determined using HPF fluorescent stain reagent; (g) ONOO determined using NiSPY-3 fluorescent stain reagent; (h) OCl determined treatment using HySOx fluorescent stain reagent. The symbols * and # indicate significant differences between PAM and nontreatment and between PAM and 24 h DMEM treatment. One symbol; p < 0.05, double symbols; p < 0.01, triple symbols; p < 0.005. Modified from [60]. Copyright 2017 Wiley.
Figure 4
Figure 4
The PTS composition affects its extent of cytotoxicity. (a) Pancreatic cancer cell line PA-TU-8988T. (b) Glioblastoma cell line U87MG. Student’s t-test was performed and the significance is indicated as *** p < 0.005. Reproduced from [58]. Copyright 2017 Springer Nature.
Figure 5
Figure 5
Differences in gene expression dynamics between PTS- (medium, plasma-activated medium (“PAM”)) and PTS-exposed (Ringer’s lactate, plasma-activated Ringer’s lactate (“PAL”)) U251SP cells. Relative mRNA expression of GADD45α (a), GADD45β (b), ATF3 (c), and c-JUN (d) was calculated using qRT-PCR. Reproduced from [63].
Figure 6
Figure 6
Intracellular molecular mechanisms of cell death in PTS-exposed (cell culture medium) A549 cells. Reproduced from [41]. Copyright 2014 S Elsevier.
Figure 7
Figure 7
Gene expression network, signal transduction network, and metabolic network affected by PTS.
Figure 8
Figure 8
Inhibition of cytochrome C oxidase and the addition of PTS (fully supplemented cell culture medium, kINPen argon plasma jet) leads to an increase in superoxide anions (red) in the mitochondrial matrix that results in loss of MMP and subsequent ATP depletion. This finally leads to an energy crisis and cell death. Reproduced from [74]. Copyright 2018 Springer Nature.
Figure 9
Figure 9
The well size-dependent ROS/RNS accumulation in PTS. (a) Relative RNS concentration in 1 mL of PTS. (b) Relative H2O2 concentration in 1 mL of PTS. Student’s t-tests were performed and the significance compared with the first bar is indicated as *** p < 0.005. Reproduced from [75]. Copyright 2015 Springer Nature.
Figure 10
Figure 10
Effectiveness of stored/aged PTS (cell culture medium) to induce cell death in SCaBER cells for storage times of 1, 8, and 12 h, when measuring metabolic activity another 12 h later. Reproduced from [82].
Figure 11
Figure 11
Cysteine and methionine mainly cause the degradation of PTS (cell culture medium) at 22°C and 8 °C. (a) The H2O2 concentration in PTS (PBS) containing a specific component during the storage at 22 °C. (b) The H2O2 concentration in the PTS (cys/met-free DMEM, cys-free DMEM, met-free DMEM, and standard DMEM) during the storage at 8 °C. (c) The anticancer effect of the PTS (cys/met-free DMEM, cys-free DMEM, met-free DMEM, and standard DMEM) after storage at 8 °C. Student’s t-tests were performed and the significance is indicated as * p < 0.05 and *** p < 0.005. Reproduced from [31]. Copyright 2016 Springer Nature.
Figure 12
Figure 12
The effect of the gap, gas flow rate, plasma treatment time, the occurrence of discharges at the liquid surface, and the stability of a PTS (PBS, kINPen argon plasma jet) on the concentrations of NO2- and H2O2 in PTS and on the anticancer capacity of PTSs for three different cancer cell lines. Reproduced from [85]. Copyright 2017 Springer Nature.
Figure 13
Figure 13
Antitumor effect of PTS (RPMI, “PAM”) in mice with NOS2 and NOS2TR (paclitaxel-resistant) cell lines. (A,B): The macroscopic observation of nude mice bearing subcutaneous NOS2 (A) and NOS2TR (B) tumors on both flanks. Mice were injected with NOS2 and NOS2TR cells and then received medium alone or NEAPP-AM. A total of 0.4 mL of medium or NEAPP-AM was administered locally into both sides of mice three times a week. All mice were sacrificed at 29 days after implantation. Green arrowheads indicate tumor formation. (C,D): Time-dependent changes in the tumor volume in xenografted models are shown, medium alone or NEAPP-AM. Each point on the line graph represents the mean tumor volume (mm3) for each group on a particular day after implantation, and the bars represent SD. * p < 0.05, ** p < 0.01 versus control. Reproduced from [39]. Copyright 2013 PLOS.
Figure 14
Figure 14
Efficacy of the intraperitoneal administration of PTS (“PAM”) in vivo. Reproduced from [78]. Copyright 2017 Springer Nature.
Figure 15
Figure 15
Efficacy of the repeated intraperitoneal administration (a) of PTS (RPMI medium without supplements) against syngeneic, orthotopic, disseminated pancreatic cancer analyzed using MR-Imaging (I–II) and macroscopic imaging (III–IV) (b) and its quantification (c) as well the absolute tumor weights (d). Each triangle represents one mouse. * p < 0.05, ** p < 0.01. Reprinted with permission from [86]. Copyright 2017 Springer Nature.
Figure 16
Figure 16
Efficacy of the repeated intraperitoneal administration of PTS (NaCl, kINPen argon plasma jet) against syngeneic, orthotopic and disseminated colorectal in mice (a) and its absolute tumor weights (b). Each triangle represents one mouse. *** p < 0.001. Reproduced from [40]. Copyright 2019 Springer Nature.

References

    1. Bray F., Ferlay J., Soerjomataram I., Siegel R.L., Torre L.A., Jemal A. Global cancer statistics 2018: GLOBOCAN estimates of incidence and mortality worldwide for 36 cancers in 185 countries. CA Cancer J. Clin. 2018;68:394–424. doi: 10.3322/caac.21492. - DOI - PubMed
    1. Arnér E.S., Holmgren A. The thioredoxin system in cancer. Semin. Cancer Biol. 2006;16:420–426. doi: 10.1016/j.semcancer.2006.10.009. - DOI - PubMed
    1. Lorenzen I., Mullen L., Bekeschus S., Hanschmann E.-M. Redox Regulation of Inflammatory Processes Is Enzymatically Controlled. Oxidative Med. Cell. Longev. 2017;2017:1–23. doi: 10.1155/2017/8459402. - DOI - PMC - PubMed
    1. Bansal A., Simon M.C. Glutathione metabolism in cancer progression and treatment resistance. J. Cell Biol. 2018;217:2291–2298. doi: 10.1083/jcb.201804161. - DOI - PMC - PubMed
    1. Laroussi M. Sterilization of contaminated matter with an atmospheric pressure plasma. IEEE Trans. Plasma Sci. 1996;24:1188–1191. doi: 10.1109/27.533129. - DOI