

Hypertension in African Populations: Review and Computational Insights
- PMID: 33917487
- PMCID: PMC8067483
- DOI: 10.3390/genes12040532
Hypertension in African Populations: Review and Computational Insights
Abstract
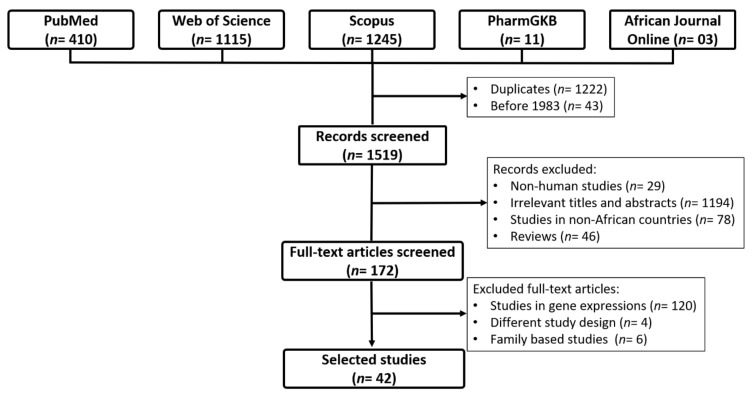
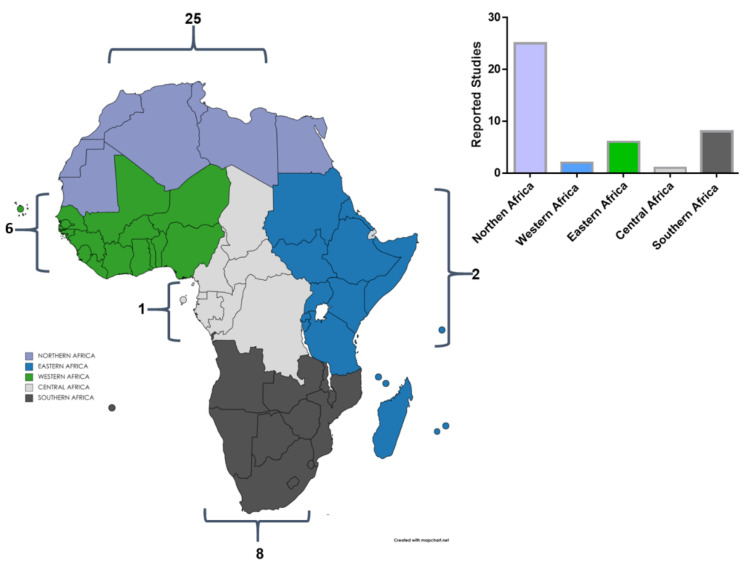
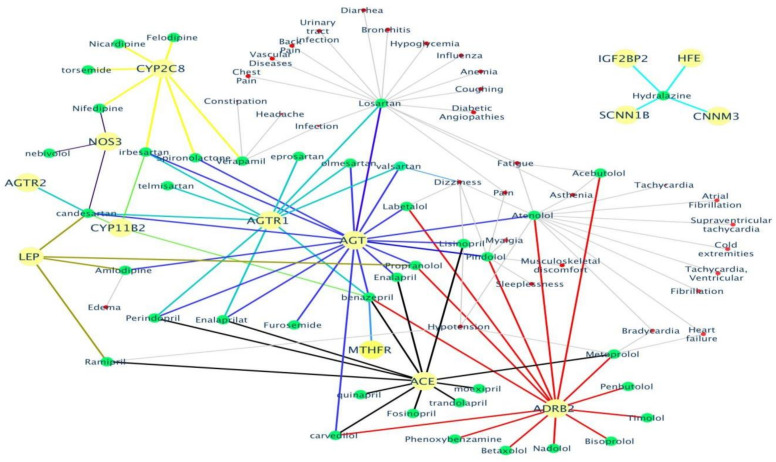
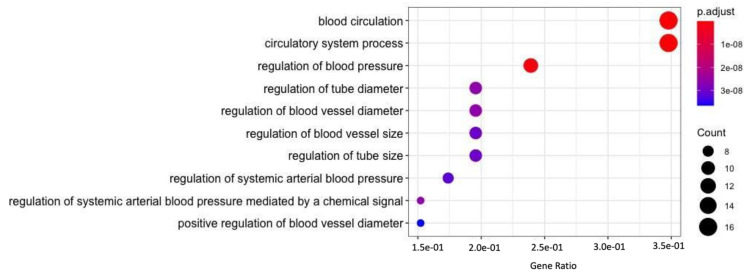
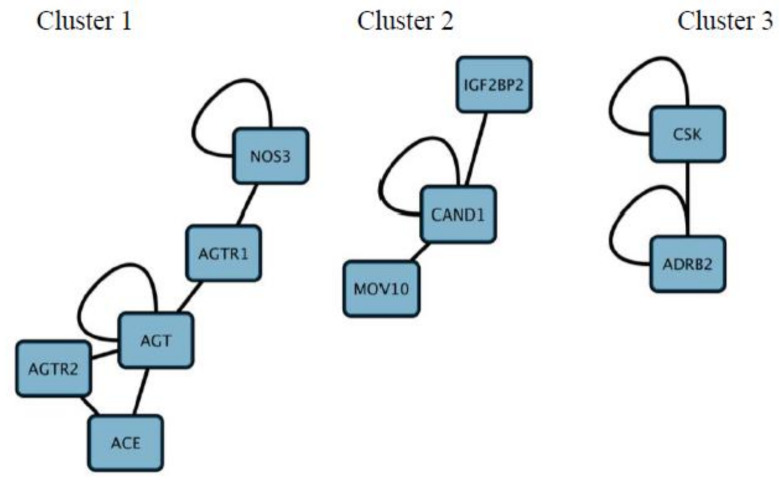
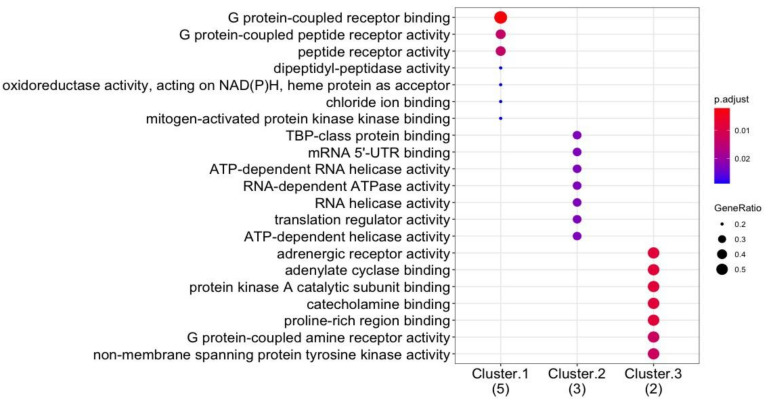
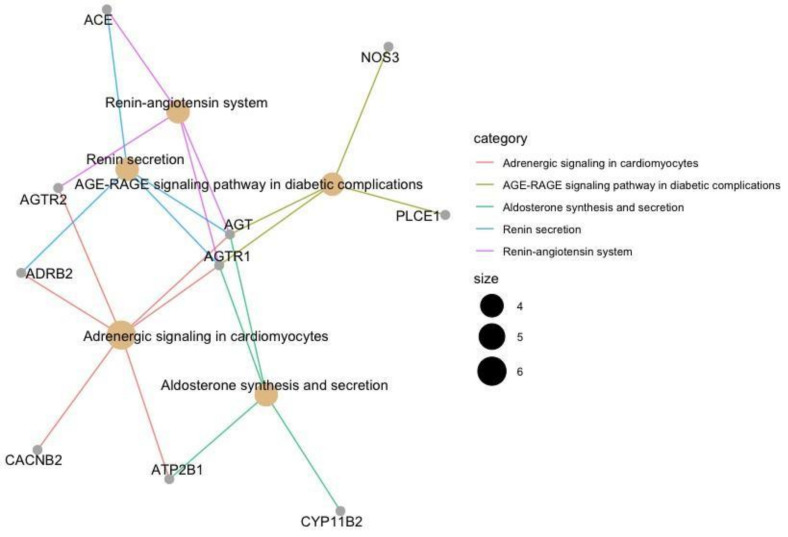
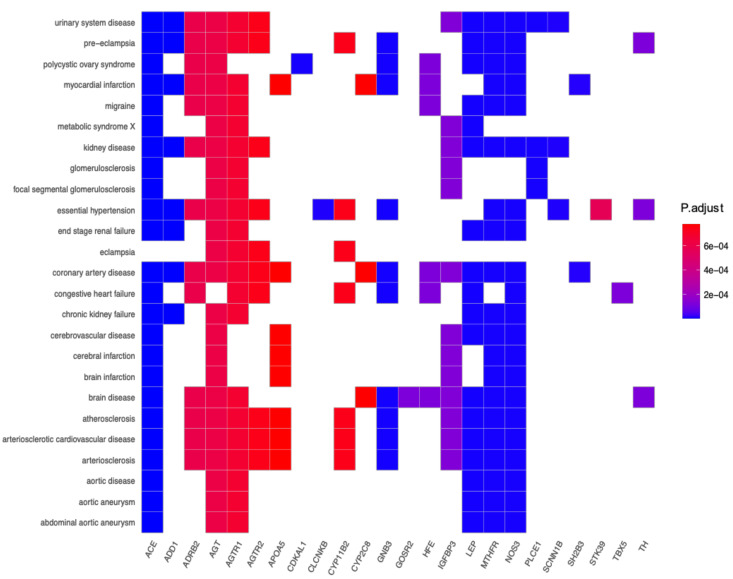
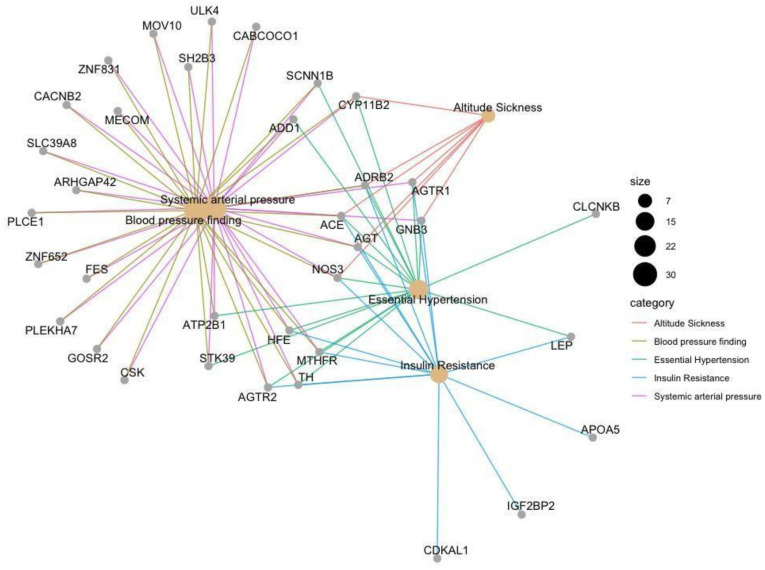
Hypertension (HTN) is a persistent public health problem affecting approximately 1.3 billion individuals globally. Treatment-resistant hypertension (TRH) is defined as high blood pressure (BP) in a hypertensive patient that remains above goal despite use of ≥3 antihypertensive agents of different classes including a diuretic. Despite a plethora of treatment options available, only 31.0% of individuals have their HTN controlled. Interindividual genetic variability to drug response might explain this disappointing outcome because of genetic polymorphisms. Additionally, the poor knowledge of pathophysiological mechanisms underlying hypertensive disease and the long-term interaction of antihypertensive drugs with blood pressure control mechanisms further aggravates the problem. Furthermore, in Africa, there is a paucity of pharmacogenomic data on the treatment of resistant hypertension. Therefore, identification of genetic signals having the potential to predict the response of a drug for a given individual in an African population has been the subject of intensive investigation. In this review, we aim to systematically extract and discuss African evidence on the genetic variation, and pharmacogenomics towards the treatment of HTN. Furthermore, in silico methods are utilized to elucidate biological processes that will aid in identifying novel drug targets for the treatment of resistant hypertension in an African population. To provide an expanded view of genetic variants associated with the development of HTN, this study was performed using publicly available databases such as PubMed, Scopus, Web of Science, African Journal Online, PharmGKB searching for relevant papers between 1984 and 2020. A total of 2784 articles were reviewed, and only 42 studies were included following the inclusion criteria. Twenty studies reported associations with HTN and genes such as AGT (rs699), ACE (rs1799752), NOS3 (rs1799983), MTHFR (rs1801133), AGTR1 (rs5186), while twenty-two studies did not show any association within the African population. Thereafter, an in silico predictive approach was utilized to identify several genes including CLCNKB, CYPB11B2, SH2B2, STK9, and TBX5 which may act as potential drug targets because they are involved in pathways known to influence blood pressure. Next, co-expressed genes were identified as they are controlled by the same transcriptional regulatory program and may potentially be more effective as multiple drug targets in the treatment regimens for HTN. Genes belonging to the co-expressed gene cluster, ACE, AGT, AGTR1, AGTR2, and NOS3 as well as CSK and ADRG1 showed enrichment of G-protein-coupled receptor activity, the classical targets of drug discovery, which mediate cellular signaling processes. The latter is of importance, as the targeting of co-regulatory gene clusters will allow for the development of more effective HTN drug targets that could decrease the prevalence of both controlled and TRH.
Keywords: Africa; genetic variation; hypertension; pharmacogenomics; single-nucleotide polymorphism.
Conflict of interest statement
The authors declare that they have no conflict of interest.
Figures
References
-
- Owiredu W.K.B.A., Appiah M., Obirikorang C., Adu E.A., Boima V., Amos-Abanyie E.K., Akyaw P.A., Owiredu E.-W., Acheampong E. Association of MYH9-rs3752462 polymorphisms with chronic kidney disease among clinically diagnosed hypertensive patients: A case-control study in a Ghanaian population. Clin. Hypertens. 2020;26:1–9. doi: 10.1186/s40885-020-00148-w. - DOI - PMC - PubMed
-
- Sombié H.K., Kologo J.K., Tchelougou D., Ouédraogo S.Y., Ouattara A.K., Compaoré T.R., Nagalo B.M., Sorgho A.P., Nagabila I., Soubeïga S.T., et al. Positive association between ATP2B1 rs17249754 and essential hypertension: A case-control study in Burkina Faso, West Africa. BMC Cardiovasc. Disord. 2019;19:155. doi: 10.1186/s12872-019-1136-x. - DOI - PMC - PubMed
-
- Zhou B., Bentham J., Di Cesare M., Bixby H., Danaei G., Cowan M.J., Paciorek C.J., Singh G., Hajifathalian K., Bennett J.E., et al. Worldwide trends in blood pressure from 1975 to 2015: A pooled analysis of 1479 population-based measurement studies with 19·1 million participants. Lancet. 2017;389:37–55. doi: 10.1016/S0140-6736(16)31919-5. - DOI - PMC - PubMed
Publication types
MeSH terms
Substances
LinkOut - more resources
Full Text Sources
Other Literature Sources
Medical
Miscellaneous
