. 2021 Apr 8;26(8):2141.
doi: 10.3390/molecules26082141.

Dabrafenib Promotes Schwann Cell Differentiation by Inhibition of the MEK-ERK Pathway

Affiliations

Dabrafenib Promotes Schwann Cell Differentiation by Inhibition of the MEK-ERK Pathway

Kyuhee Park et al. Molecules. .

Abstract

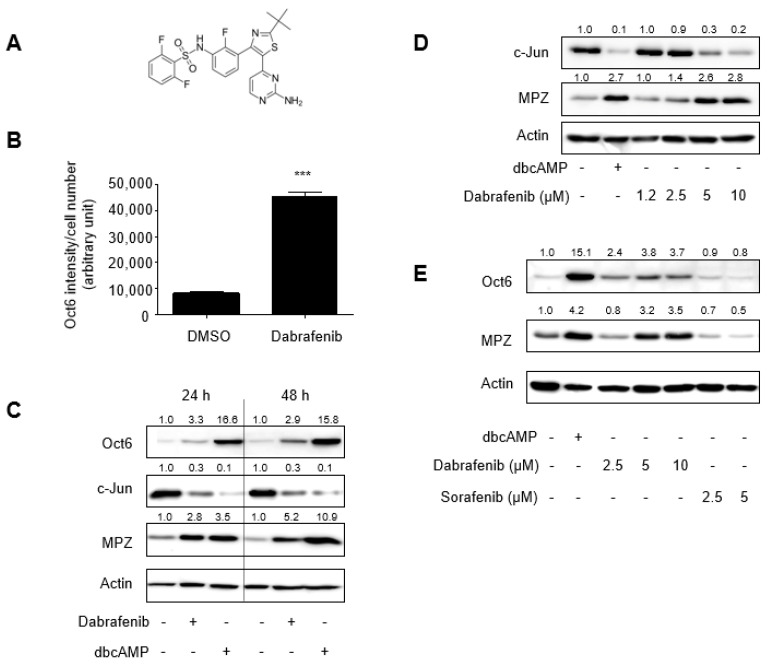
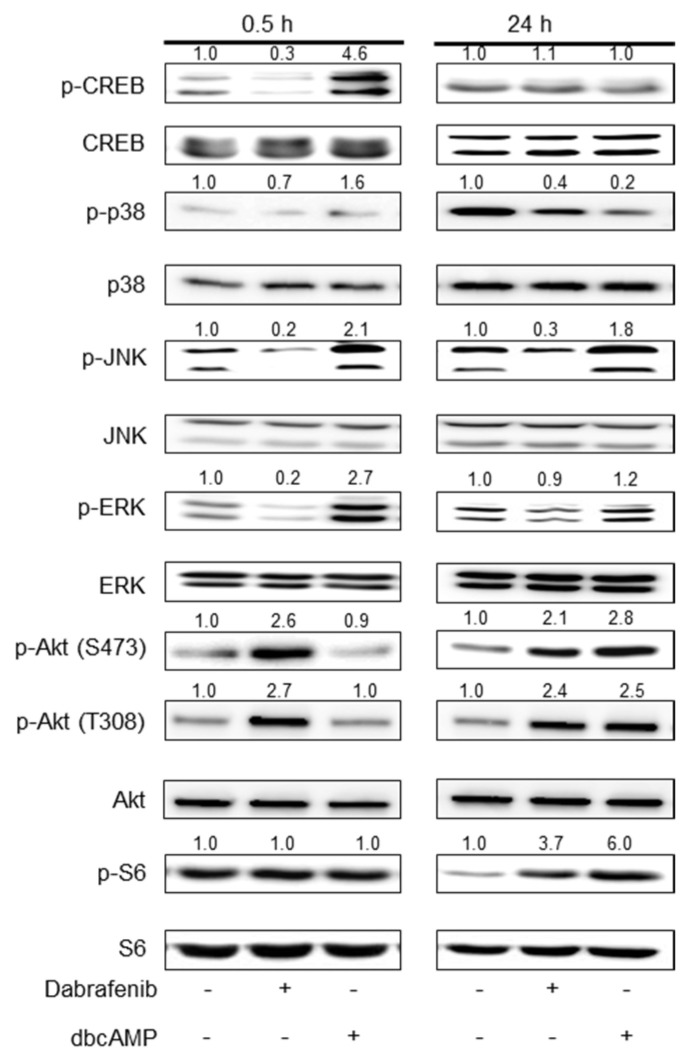
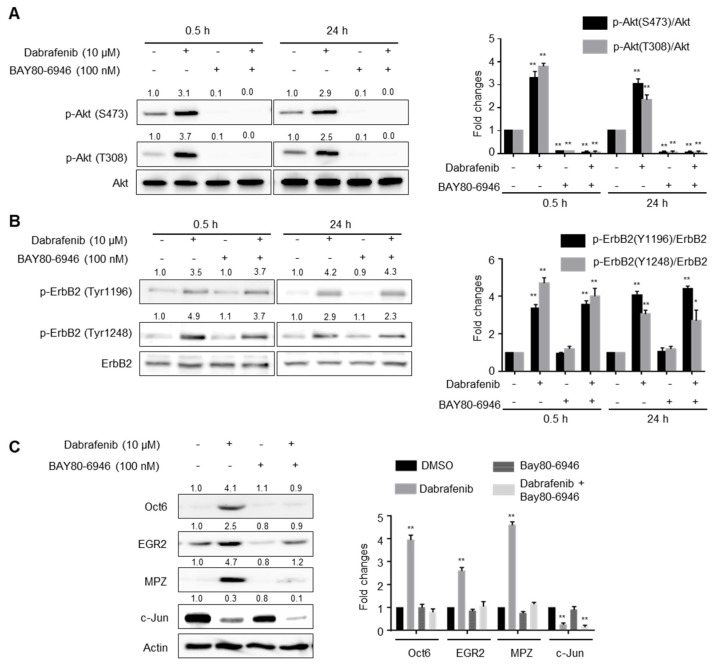
Schwann cell differentiation involves a dynamic interaction of signaling cascades. However, much remains to be elucidated regarding the function of signaling molecules that differ depending on the context in which the molecules are engaged. Here, we identified a small molecule, dabrafenib, which promotes Schwann cell differentiation in vitro and exploited this compound as a pharmacological tool to understand the molecular mechanisms regulating Schwann cell differentiation. The results indicated that dabrafenib inhibited ERK phosphorylation and enhanced ErbB2 autophosphorylation and Akt phosphorylation, and the effects of dabrafenib on ErbB2 and Akt phosphorylation were phenocopied by pharmacological inhibition of the MEK-ERK signaling pathway. However, the small molecule inhibitors of MEK and ERK had no effect on the expression of Oct6 and EGR2, which are key transcription factors that drive Schwann cell differentiation. In addition, pharmacological inhibition of phosphatidylinositol-3-kinase (PI3K) almost completely interfered with dabrafenib-induced Schwann cell differentiation. These results suggest that the ErbB2-PI3K-Akt axis is required for the induction of Schwann cell differentiation by dabrafenib in vitro. Although additional molecules targeted by dabrafenib remain to be identified, our data provides insights into the crosstalk that exists between the MEK-ERK signaling pathway and the PI3K-Akt axis in Schwann cell differentiation.

Keywords: ERK; ErbB2; Schwann cell; dabrafenib; differentiation.


Conflict of interest statement

The authors declare no conflict of interest.

Figures

Figure 1
Figure 1
The identification of dabrafenib that promotes Schwann cell differentiation in vitro. (A) Chemical structure of dabrafenib. (B) Primary rat Schwann cells were treated with either DMSO (0.1%) or dabrafenib (10 µM) for 48 h and subjected to indirect immunofluorescence with an anti-Oct6 antibody. Wide-field fluorescence images from four fields in each well of a 384-well plate were acquired, and the fluorescence intensity of Oct6 expression divided by the number of cells is shown. Each column represents the mean ± SD, n = 3. *** p < 0.001, DMSO versus dabrafenib. (C) Primary rat Schwann cells were treated with either DMSO (0.1%), dabrafenib (10 µM), or dibutyryl cAMP (500 µM) for 24 or 48 h, and the total lysates were subject to western blot analyses. Band intensities were quantitated using ImageJ and normalized to actin intensities. Fold changes are indicated at the top of each lane. (D) The primary Schwann cells were treated with either DMSO (0.1%), dibutyryl cAMP (500 µM), or increasing concentrations of dabrafenib for 48 h, and the total lysates were subject to western blot analyses. (E) Primary rat Schwann cells were treated with either DMSO or the indicated chemicals for 48 h, and the total lysates were subject to Western blot analyses.
Figure 2
Figure 2
Analyses of signaling molecules in Schwann cells treated with dabrafenib. Primary rat Schwann cells were treated with either DMSO (0.1%), dabrafenib (10 µM), or dibutyryl cAMP (500 µM) for 0.5 or 24 h, and the total lysates were subject to Western blot analyses. Band intensities for phosphorylated proteins were quantified using ImageJ and normalized to total protein. Fold changes are indicated at the top of each lane.
Figure 3
Figure 3
The effects of a PI3K inhibitor on dabrafenib-induced Schwann cell differentiation in vitro. (A) Primary rat Schwann cells were treated with the indicated compounds for 0.5 or 24 h, and the total lysates were subject to Western blot analyses. One representative Western blot is shown (left). Data from three independent replicates (mean ± S.D.) are shown as bar graphs (right). ** p < 0.01 versus control (DMSO). (B) Dabrafenib enhances ErbB2 autophosphorylation in primary Schwann cells. Primary rat Schwann cells were treated with the indicated compounds for 0.5 or 24 h, and the total lysates were subject to Western blot analyses. One representative Western blot is shown (left). Data from three independent replicates (mean ± S.D.) are shown as bar graphs (right). * p < 0.05 versus control (DMSO). ** p < 0.01 versus control (DMSO). (C) PI3K activity contributes to the dabrafenib-induced Schwann cell differentiation. Primary rat Schwann cells were treated with the indicated compounds for 48 h, and the total lysates were subject to Western blot analyses. One representative Western blot is shown (left). Data from three independent replicates (mean ± S.D.) are shown as bar graphs (right). ** p < 0.01 versus control (DMSO).
Figure 4
Figure 4
The effects of MEK/ERK inhibitors on ErbB2 signaling. (A) Inhibition of the MEK-ERK signaling pathway results in the activation of ErbB2-PI3K-Akt axis. Primary rat Schwann cells were treated with the indicated compounds for 0.5 h, and then total lysates were subject to Western blot analyses. One representative Western blot is shown (top). Data from three independent replicates (mean ± S.D.) are shown as bar graphs (bottom). ** p < 0.001 versus control (DMSO) * p < 0.01 versus control (DMSO). (B) Inhibition of MEK-ERK pathway is not sufficient to induce Schwann cell differentiation in vitro. Primary rat Schwann cells were treated with the indicated compounds for 48 h, and the total lysates were subject to Western blot analyses. One representative Western blot is shown (top). Data from three independent replicates (mean ± S.D.) are shown as bar graphs (bottom). * p < 0.01 versus control (DMSO).

Similar articles

Cited by

References

    1. Yeung M.S.Y., Djelloul M., Steiner E., Bernard S., Salehpour M., Possnert G., Brundin L., Frisen J. Dynamics of oligodendrocyte generation in multiple sclerosis. Nature. 2019;566:538–542. doi: 10.1038/s41586-018-0842-3. - DOI - PMC - PubMed
    1. Stierli S., Imperatore V., Lloyd A.C. Schwann cell plasticity-roles in tissue homeostasis, regeneration, and disease. Glia. 2019;67:2203–2215. doi: 10.1002/glia.23643. - DOI - PubMed
    1. Boerboom A., Dion V., Chariot A., Franzen R. Molecular Mechanisms Involved in Schwann Cell Plasticity. Front. Mol. Neurosci. 2017;10:38. doi: 10.3389/fnmol.2017.00038. - DOI - PMC - PubMed
    1. Nocera G., Jacob C. Mechanisms of Schwann cell plasticity involved in peripheral nerve repair after injury. Cell. Mol. Life Sci. 2020;77:3977–3989. doi: 10.1007/s00018-020-03516-9. - DOI - PMC - PubMed
    1. Glenn T.D., Talbot W.S. Signals regulating myelination in peripheral nerves and the Schwann cell response to injury. Curr. Opin. Neurobiol. 2013;23:1041–1048. doi: 10.1016/j.conb.2013.06.010. - DOI - PMC - PubMed

MeSH terms

LinkOut - more resources