. 2021 Apr 8;18(8):3913.
doi: 10.3390/ijerph18083913.

Estimation of Excess Mortality and Years of Life Lost to COVID-19 in Norway and Sweden between March and November 2020

Affiliations

Estimation of Excess Mortality and Years of Life Lost to COVID-19 in Norway and Sweden between March and November 2020

Martin Rypdal et al. Int J Environ Res Public Health. .

Abstract

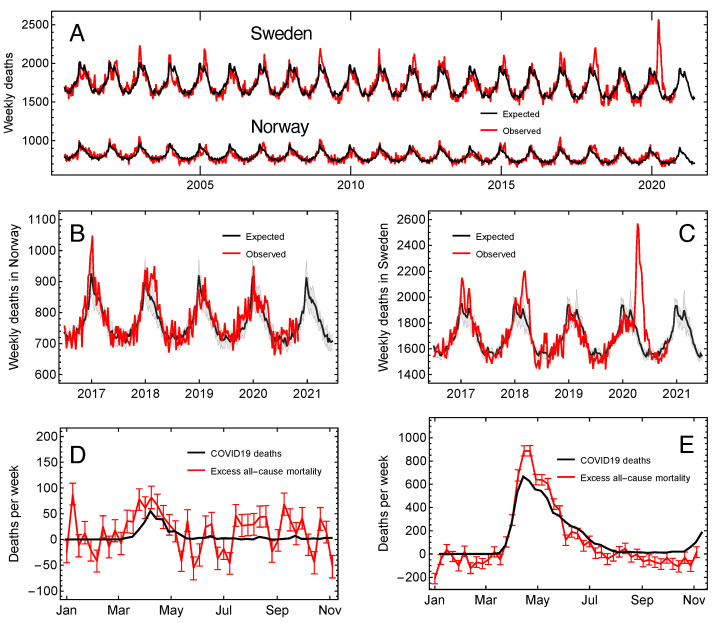
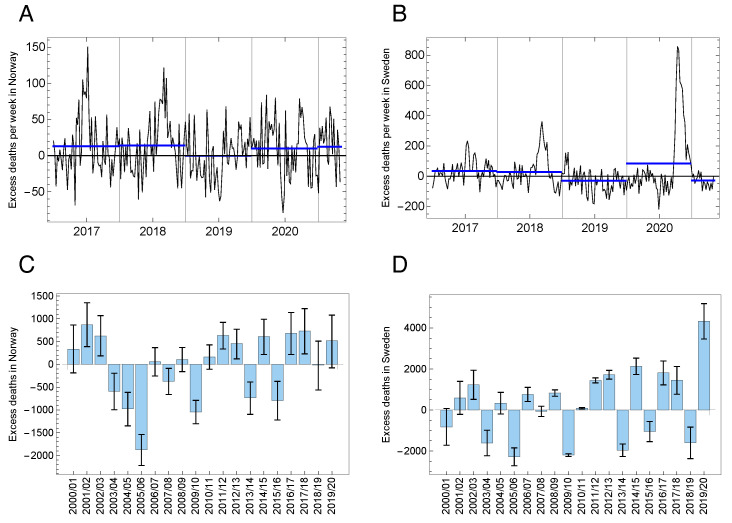
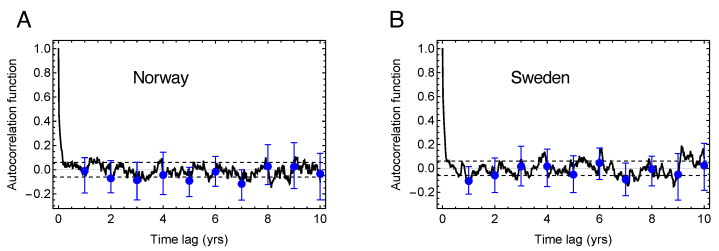
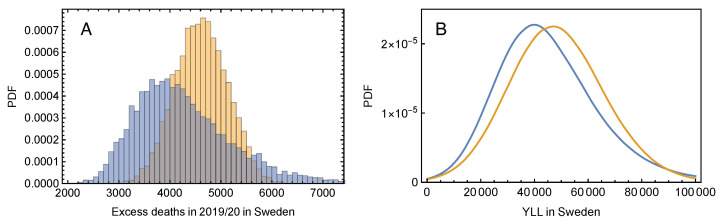
We estimate the weekly excess all-cause mortality in Norway and Sweden, the years of life lost (YLL) attributed to COVID-19 in Sweden, and the significance of mortality displacement. We computed the expected mortality by taking into account the declining trend and the seasonality in mortality in the two countries over the past 20 years. From the excess mortality in Sweden in 2019/20, we estimated the YLL attributed to COVID-19 using the life expectancy in different age groups. We adjusted this estimate for possible displacement using an auto-regressive model for the year-to-year variations in excess mortality. We found that excess all-cause mortality over the epidemic year, July 2019 to July 2020, was 517 (95%CI = (12, 1074)) in Norway and 4329 [3331, 5325] in Sweden. There were 255 COVID-19 related deaths reported in Norway, and 5741 in Sweden, that year. During the epidemic period of 11 March-11 November, there were 6247 reported COVID-19 deaths and 5517 (4701, 6330) excess deaths in Sweden. We estimated that the number of YLL attributed to COVID-19 in Sweden was 45,850 [13,915, 80,276] without adjusting for mortality displacement and 43,073 (12,160, 85,451) after adjusting for the displacement accounted for by the auto-regressive model. In conclusion, we find good agreement between officially recorded COVID-19 related deaths and all-cause excess deaths in both countries during the first epidemic wave and no significant mortality displacement that can explain those deaths.

Keywords: COVID-19; excess mortality; mortality displacement; years of life lost.


Conflict of interest statement

The authors declare no conflict of interest.

Figures

Figure 1
Figure 1
Expected and observed mortality. (A) The weekly deaths in Norway and Sweden (red) together with the estimated baseline (black). (B) Same as for Norway in (A), but for the years 2016/17 to 2020/21. The gray region shows the interquartile range for the seasonal variation. (C) As (B), but for Sweden. (D) The excess weekly mortality in Norway (red) and COVD-19-related deaths (black). The error bars is the 95% CI for the excess mortality based on the Monte–Carlo simulation for the estimate of the baseline. (E) As (D), but for Sweden.
Figure 2
Figure 2
Excess mortality. (A) Weekly excess mortality for Norway from 2016/17 and through the first months of the epidemic year 2020/21. The blue lines are the average values for each of the five epidemic years. (B) As (A), but for Sweden. (C) The annual excess mortality for Norway from 2000/01 to 2019/20. The error bars are the 95% confidence intervals. (D) As (C), but for Sweden.
Figure 3
Figure 3
Auto-correlation function of the excess mortality signal. (A) The black curve shows the autocorrelation function estimated from the weekly excess mortality in Norway. The dashed lines indicate the 95% confidence interval under the assumption of uncorrelated data. The blue points show the autocorrelation function estimated from yearly excess mortality, and the blue error bars show the spread between the correlations estimated using different weeks of each year. (B) As in (A), but for Sweden.
Figure 4
Figure 4
Effect of mortality displacement. (A) The yellow histogram shows the estimated probability density function for excess deaths obtained from the Monte–Carlo simulation of the baseline. The blue histogram is the excess mortality adjusted for displacement according to Equation (4). (B) The blue curve is the estimated probability density function for years of life lost (YLL) obtained from Equation (1), and the blue curve is the probability density function for YLL after adjusting for mortality displacement.

Similar articles

Cited by

References

    1. Paterlini M. ‘Closing borders is ridiculous’: The epidemiologist behind Sweden’s controversial coronavirus strategy. Nature. 2020;580:574. doi: 10.1038/d41586-020-01098-x. - DOI - PubMed
    1. Anderson R.M., Heesterbeek H., Klinkenberg D., Hollingsworth T.D. How will country-based mitigation measures influence the course of the COVID-19 epidemic? Lancet. 2020;395:931–934. doi: 10.1016/S0140-6736(20)30567-5. - DOI - PMC - PubMed
    1. Middleton J., Lopes H., Michelson K., Reid J. Planning for a second wave pandemic of COVID-19 and planning for winter. Int. J. Public Health. 2020;65:1525–1527. doi: 10.1007/s00038-020-01455-7. - DOI - PMC - PubMed
    1. Thompson R.N., Hollingsworth T.D., Isham V., Arribas-Bel D., Ashby B., Britton T., Challenor P., Chappell L.H.K., Clapham H., Cunniffe N.J., et al. Key questions for modelling COVID-19 exit strategies. Proc. R. Soc. B Biol. Sci. 2020;287:20201405. doi: 10.1098/rspb.2020.1405. - DOI - PMC - PubMed
    1. Chang S.L., Harding N., Zachreson C., Cliff O.M., Prokopenko M. Modelling transmission and control of the COVID-19 pandemic in Australia. Nat. Commun. 2020;11:5710. doi: 10.1038/s41467-020-19393-6. - DOI - PMC - PubMed

Publication types

LinkOut - more resources