Review
. 2021 Apr 8;22(8):3867.
doi: 10.3390/ijms22083867.

Physiological Imaging Methods for Evaluating Response to Immunotherapies in Glioblastomas

Affiliations
Review

Physiological Imaging Methods for Evaluating Response to Immunotherapies in Glioblastomas

Sanjeev Chawla et al. Int J Mol Sci. .

Abstract

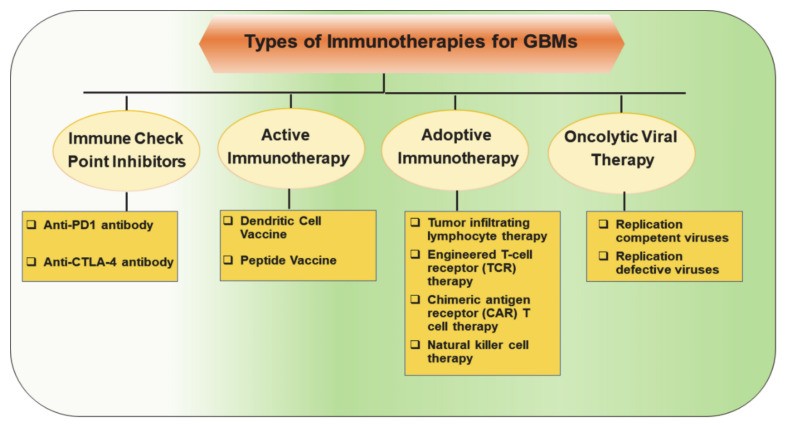
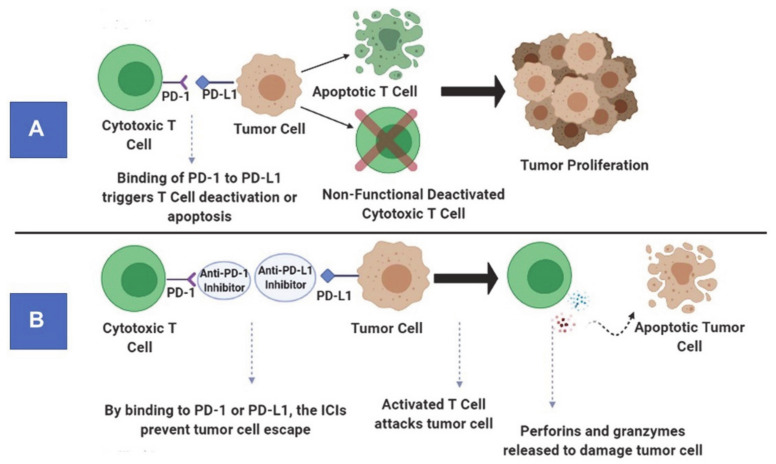
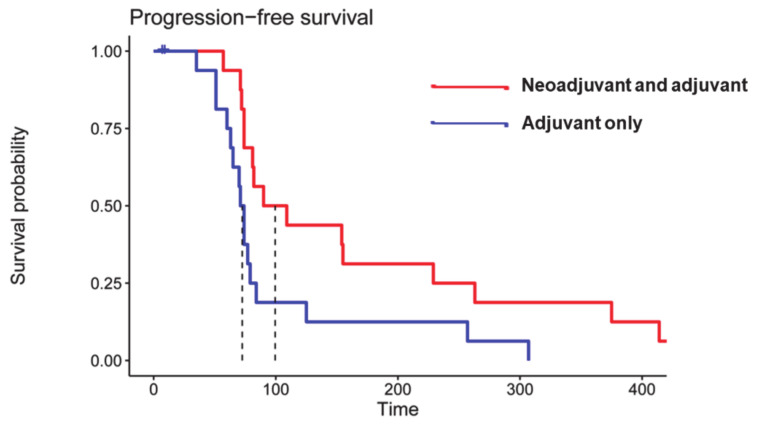
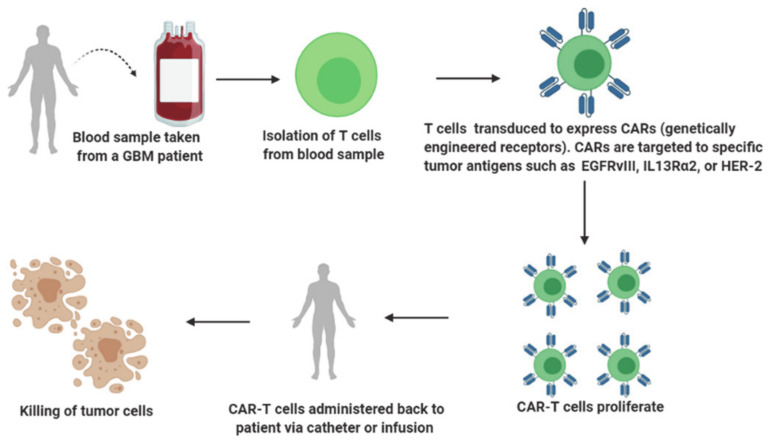
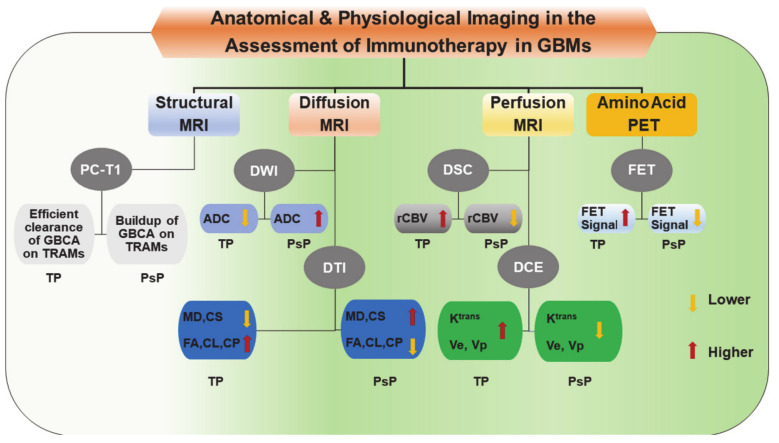
Glioblastoma (GBM) is the most malignant brain tumor in adults, with a dismal prognosis despite aggressive multi-modal therapy. Immunotherapy is currently being evaluated as an alternate treatment modality for recurrent GBMs in clinical trials. These immunotherapeutic approaches harness the patient's immune response to fight and eliminate tumor cells. Standard MR imaging is not adequate for response assessment to immunotherapy in GBM patients even after using refined response assessment criteria secondary to amplified immune response. Thus, there is an urgent need for the development of effective and alternative neuroimaging techniques for accurate response assessment. To this end, some groups have reported the potential of diffusion and perfusion MR imaging and amino acid-based positron emission tomography techniques in evaluating treatment response to different immunotherapeutic regimens in GBMs. The main goal of these techniques is to provide definitive metrics of treatment response at earlier time points for making informed decisions on future therapeutic interventions. This review provides an overview of available immunotherapeutic approaches used to treat GBMs. It discusses the limitations of conventional imaging and potential utilities of physiologic imaging techniques in the response assessment to immunotherapies. It also describes challenges associated with these imaging methods and potential solutions to avoid them.

Keywords: diffusion MR imaging; glioblastoma; immunotherapy; perfusion MR imaging; positron emission tomography; treatment response.


Conflict of interest statement

The authors declare no conflict of interest.

Figures

Figure 1
Figure 1
Major classes of immunotherapeutic approaches to harness patient’s immune response against tumor cells in glioblastomas (GBMs).
Figure 2
Figure 2
Principle of immune checkpoint pathways under physiological conditions (A). Mechanism of action of anti-programmed cell death protein-1 (PD1) antibody (an immune checkpoint inhibitor) (B).
Figure 3
Figure 3
Kaplan–Meier curves showing significantly prolonged progression-free survival (PFS) in patients who received neoadjuvant and adjuvant pembrolizumab (median PFS = 72.5 days, red curve) compared to patients who received pembrolizumab only in the adjuvant setting (blue curve) (median PFS= 99.5 days, two-sided p = 0.03 by log-rank test). Reprinted with permission from ref. [49]. Copyright 2019 Springer Nature America, Inc.
Figure 4
Figure 4
A brief overview of adoptive immunotherapy.
Figure 5
Figure 5
A block diagram is showing trends in structural, and physiologic imaging parameters that are usually observed in distinguishing true progression (TP) from pseudoprogression (PsP) in GBMs following treatment with immunotherapy. ADC, Apparent diffusion coefficient; CL, Coefficient of linear anisotropy; CP, Coefficient of planar anisotropy; CS, Coefficient of spherical anisotropy; DCE, Dynamic contrast-enhanced; DSC, Dynamic susceptibility contrast; DTI, Diffusion tensor imaging; DWI, Diffusion weighted imaging; FA, Fractional anisotropy; FET, O-(2-[18F] fluoroethyl)-L-tyrosine; GBCA, gadolinium-based contrast agent; GBM, Glioblastoma; Ktrans, Volume transfer constant; MD, Mean diffusivity; MRI, Magnetic resonance imaging; PC-T1; Post-contrast T1 weighted images; PET, Positron emission tomography; PsP, Pseudo-progression; rCBV, relative cerebral blood volume; TP, True Progression; TRAM, Treatment response assessment map; Ve, Fraction of extracellular-extravascular space; Vp, Fraction of plasma volume.
Figure 6
Figure 6
Representative anatomical images and apparent diffusion coefficient (ADC) maps from a patient who benefitted from treatment with anti-PD1 immunotherapy. While tumor volume on sagittal post-contrast T1 weighted images (red color) demonstrated initial declining trends from day 42–84, it increased from day 120–175. On the other hand, tumor volume as measured by considering that ADC values on the ADC maps (yellow color) decreased between day 120–175, indicating positive response. Reprinted with permission from ref. [95]. Copyright 2017 Springer-Verlag Berlin Heidelberg.
Figure 7
Figure 7
(A) MRI and FET-PET images of a patient with melanoma brain metastasis, diagnosed with PsP using immune-related response criteria (irRC) after receiving immune checkpoint inhibitor immunotherapy. The index MRI shows >25% increase in contrast-enhancing lesions located in frontal and occipital regions. Low metabolic tumor activity was observed on FET-PET images. (B) MRI and FET-PET images of a patient with melanoma brain metastasis, who was diagnosed with TP using irRC. The index MRI shows >25% increase in contrast-enhancing lesions located in the body of corpus callosum and occipital regions. A very high metabolic tumor activity was observed on FET-PET images. Reprinted with permission from ref. [109]. Copyright 2016 Oxford University Press.
Figure 8
Figure 8
Box-and-whisker plots demonstrating the distributions of maximum relative cerebral blood volume (rCBV) ratios (left panel) and minimum ADC (right panel) from three groups (group 0: patients who remained stable during the follow-up period; group 1a: patients who were suspected but not confirmed with TP; group 1b: patients who were definitive TP). The bottom and top edges of boxes represent the 25th percentile and the 75th percentile values. The bands within the boxes represent 50th percentile (median) values. Whiskers display the range of data distribution. Outliers are marked with open circles. Reprinted with permission from ref. [110]. Copyright 2010 Springer-Verlag.
Figure 9
Figure 9
Representative coronal post-contrast T1 weighted images of untreated control, dendritic cell vaccination (DCVax; Northwest Biotherapeutics)-treated, and DCVax + PD-1 mAb-treated GBM bearing mice (AC). Representative contrast subtraction maps (red; contrast mask) overlaid onto post-contrast T1 weighted images (DF). Representative coronal [18F]-FAC PET images of untreated control and DCVax- and DCVax + PD1 mAb-treated mice (GI). Representative threshold PET subtraction maps (red; PET mask) overlaid onto post-contrast T1 weighted images (JL). The immunotherapeutic response index (ITRI, a ratio of the PET voxels divided by the T1+C subtraction voxel data) calculated for each treatment group is shown (M). Increased ITRI values were observed in mice treated with DCVax and/or PD-1 mAb compared with untreated mice. Survival plots of intracranial GBM-bearing untreated control (no Tx), DCVax-treated, and DCVax + PD-1 mAb-treated mice (N). Reprinted with permission from ref. [114].
Figure 10
Figure 10
Post-contrast T1 weighted, T1-subtraction, rCBV, ADC, [18F]-FAC PET + MRI fusion and whole-body maximum intensity projection images of [18F]-CFA from a patient with recurrent GBM before (top) and after (bottom) immunotherapy are shown. Reprinted with permission from ref. [114].
Figure 11
Figure 11
Representative baseline and follow-up anatomical images and parametric maps at baseline and follow-up periods from a patient treated with epidermal growth factor receptor deletion mutation (anti-EGFRvIII) chimeric antigen receptor T cell therapy. Percentage changes in parameters from baseline to 1-, and 2-month follow-up periods from this patient are shown. Reprinted with permission from ref. [115]. Copyright 2019 Springer Nature.

Similar articles

Cited by

References

    1. Delgado-López P.D., Corrales-García E.M. Survival in glioblastoma: A review on the impact of treatment modalities. Clin. Transl. Oncol. 2016;18:1062–1071. doi: 10.1007/s12094-016-1497-x. - DOI - PubMed
    1. Chen K.-T., Wu T.-W.E., Chuang C.-C., Hsu Y.-H., Hsu P.-W., Huang Y.-C., Lin T.-K., Chang C.-N., Lee S.-T., Wu C.-T., et al. Corpus callosum involvement and postoperative outcomes of patients with gliomas. J. Neuro. Oncol. 2015;124:207–214. doi: 10.1007/s11060-015-1823-0. - DOI - PubMed
    1. Liu E.K., Sulman E.P., Wen P.Y., Kurz S.C. Novel Therapies for Glioblastoma. Curr. Neurol. Neurosci. Rep. 2020;20:1–12. doi: 10.1007/s11910-020-01042-6. - DOI - PubMed
    1. Jackson C., Choi J., Khalafallah A.M., Price C., Bettegowda C., Lim M., Gallia G., Weingart J., Brem H., Mukherjee D. A systematic review and meta-analysis of supratotal versus gross total resection for glioblastoma. J. Neuro. Oncol. 2020;148:419–431. doi: 10.1007/s11060-020-03556-y. - DOI - PubMed
    1. Desland F.A., Hormigo A. The CNS and the Brain Tumor Microenvironment: Implications for Glioblastoma Immunotherapy. Int. J. Mol. Sci. 2020;21:7358. doi: 10.3390/ijms21197358. - DOI - PMC - PubMed

MeSH terms

LinkOut - more resources