. 2021 Apr 2;13(7):1682.
doi: 10.3390/cancers13071682.

Programmed Death Ligand-1 (PD-L1) Is an Independent Negative Prognosticator in Western-World Gallbladder Cancer

Affiliations

Programmed Death Ligand-1 (PD-L1) Is an Independent Negative Prognosticator in Western-World Gallbladder Cancer

Thomas Albrecht et al. Cancers (Basel). .

Abstract

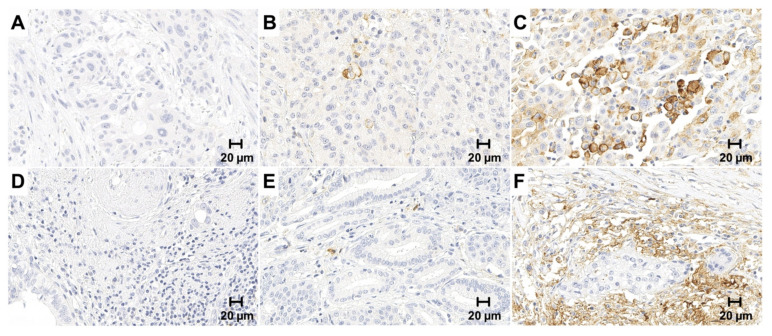
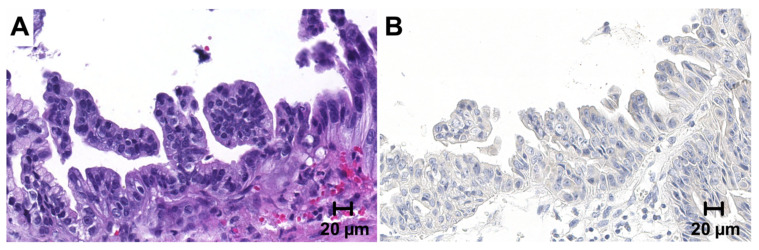
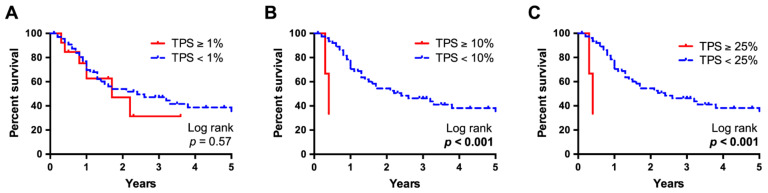
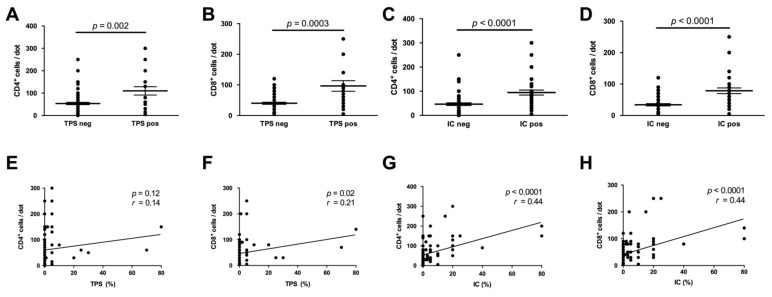
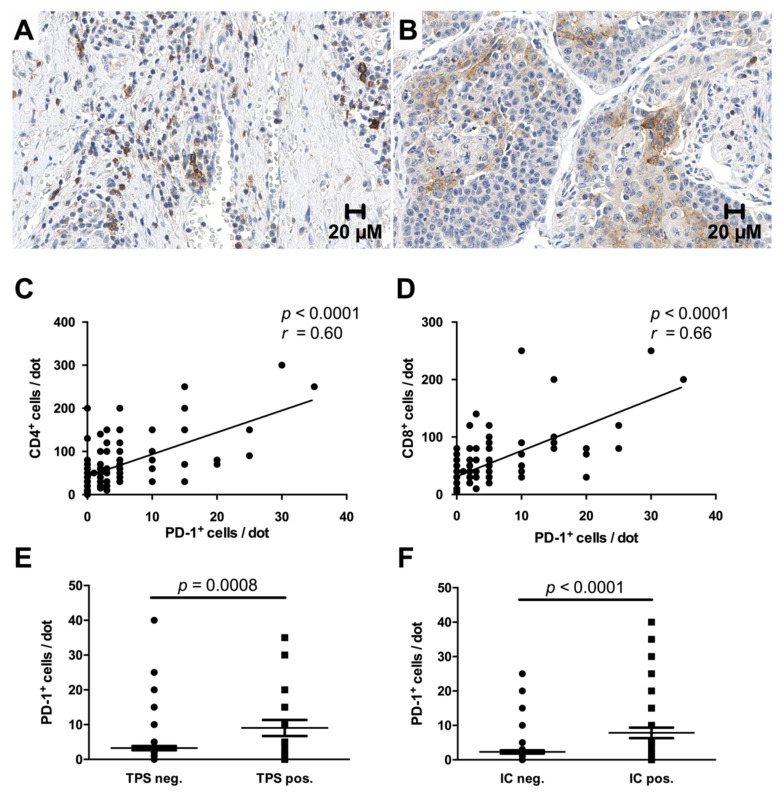
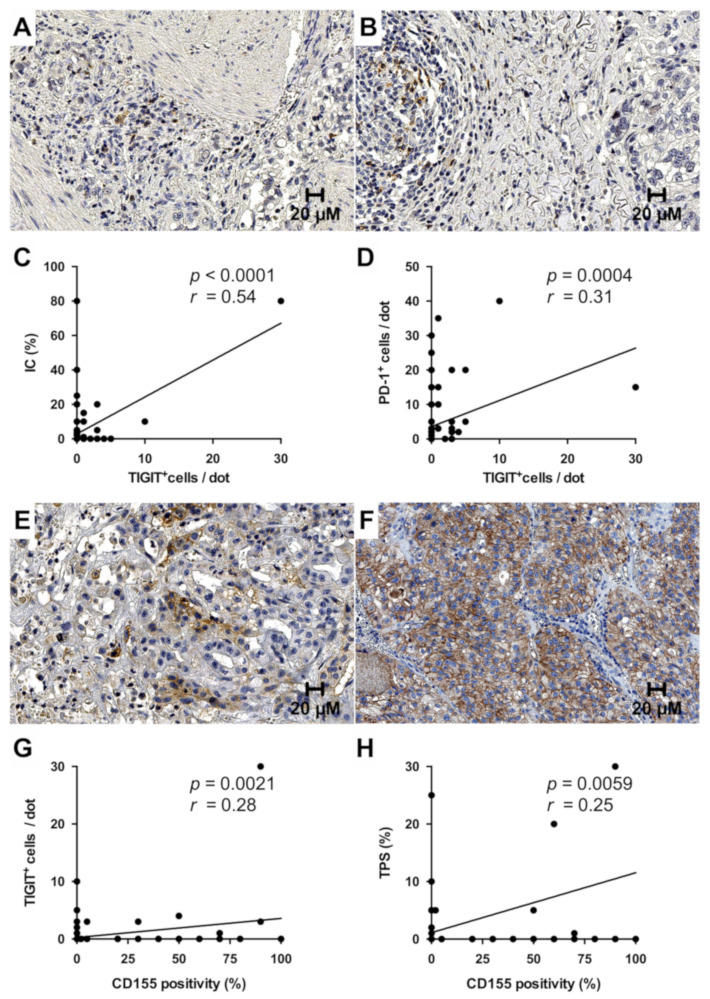
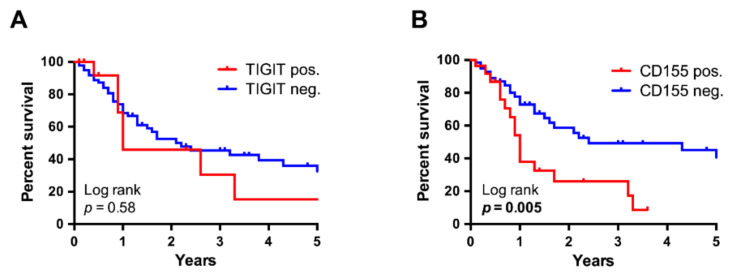
Inhibition of the programmed cell death protein-1/ligand-1 (PD-1/PD-L1) axis has opened a new era in the treatment of solid cancers. However, there is no data on the expression and relevance of PD-L1 in Western gallbladder cancer (GBC). We assessed PD-L1 immunohistochemically in 131 GBC patients as Tumor Proportion Score (TPS), Immune Cell Score (IC) and Combined Positivity Score (CPS). Tumor cells expressed PD-L1 in a subset of 14.7% GBC patients at a TPS cut-off of 1%. Higher PD-L1 levels above 10% and 25% TPS were reached in 4.7% and 3.1% of GBC cases, respectively. At a 10% cut-off, TPS was associated with distinct histomorphological subtypes and correlated with poor tumor differentiation. Survival analysis revealed a TPS above 10% to be a highly significant and independent negative prognosticator in GBC. PD-L1 expression was associated with increased CD4+, CD8+ and PD-1+ immune cell densities. In 14.8% of the cases, scattered immune cells expressed T-cell immunoreceptor with Ig and ITIM domains (TIGIT), which was correlated to tumoral expression of its ligand CD155. We here show that a high PD-L1 expression confers a negative prognostic value in Western-world GBC and highlight the TIGIT/CD155 immune checkpoint as a potential new target for GBC immunotherapy.

Keywords: PD-L1; biomarkers; gallbladder cancer; gastrointestinal neoplasms; immune evasion; liver neoplasms; programmed cell death ligand-1; tumor.


Conflict of interest statement

P.S. received funding for grants, boards, and presentations from Novartis. The other authors declare no competing interests. The funders had no role in the design of the study; in the collection, analyses, or interpretation of data; in the writing of the manuscript, or in the decision to publish the results.

Figures

Figure 1
Figure 1
PD-L1 immunohistochemistry in gallbladder cancer and infiltrating immune cells. PD-L1 expression was evaluated on both the tumor and immune cells and expressed as Tumor Proportion Score (TPS), Immune Cell Score (IC) and Combined Positivity Score (CPS), respectively. Only membranous staining was counted. Upper panel: Representative microphotographs of negative (A) low (<10%); (B) high (>10%); (C) PD-L1 expression in the tumor cells. Lower Panel: Representative microphotographs of negative (D) low (<10%); (E) high (>10%); (F) PD-L1 expression in tumor infiltrating immune cells. Original magnification 400×.
Figure 2
Figure 2
PD-L1 immunohistochemistry in high-grade biliary intraepithelial neoplasia. PD-L1 expression was also assessed in a number of 74 concomitant high-grade biliary intraepithelial neoplasia (BilIN) precursor lesions. (A) (HE). All BilIN lesions showed complete negativity for PD-L1 (B). Original magnification 400×.
Figure 3
Figure 3
Kaplan-Meier survival analysis, stratified for Tumor Proportion Score. Survival data of a subset of 104 patients with available follow-up information were compared using Kaplan-Meier curves and log-rank testing. While at a Tumor Proportion Score (TPS) cut-off value at 1% no significant differences were observed (A), at a 10% (B) and 25% (C) cut-off, median survival was significantly worse in patients with high PD-L1 expression and six times lower than of those with lower expression (p < 0.001, 0.4 years vs. 2.2 years for both analyses).
Figure 4
Figure 4
PD-L1 expression is associated with immune cell phenotype and density. Cases with positive PD-L1 expression either in tumor (Tumor Proportion Score (TPS), (A,B) or immune cells (Immune Cell Score) (IC), (C,D) displayed significantly increased intra- and peritumoral CD4+- and CD8+-immune cell densities. Correlation analysis confirmed this association, reaching significance for the correlation of the TPS with CD8+-cell density and for the correlation of the IC with CD4+-/CD8+-cell density (EH).
Figure 5
Figure 5
PD-1+ immune cells are increased in tumors with PD-L1 expression. More than half of the cases demonstrated strong membranous and cytoplasmic staining for PD-1 in a fraction of intra- and peritumoral immune cells (A), while positivity in the tumor epithelium was only detected in a single case with adenosquamous morphology (B). Co-expression of PD-1 and CD4 or CD8 was confirmed by correlation analysis (C,D). Furthermore, enhanced PD-1 expression was observed in cases with a Tumor Proportion Score (TPS) or Immune Cell score (IC) ≥ 1% (E,F). Original magnification in (A,B): 400×.
Figure 6
Figure 6
Expression of TIGIT and CD155 in gallbladder cancer. TIGIT was exclusively expressed by tumor-associated immune cells and mostly restricted to single lymphocytes (A). Only a few cases showed aggregated TIGIT+ immune cell clusters (B). TIGIT positivity in immune cells closely correlated with PD-L1 and PD-1 expression (C,D). CD155 immunohistochemistry showed a mostly strong membranous signal, that ranged from focal (E) to ubiquitous (F). CD155 positivity significantly correlated with the number of TIGIT+ immune cells and PD-L1 expression in tumor cells (G,H). Original magnification in (A,B,E,F): 400×.
Figure 7
Figure 7
Kaplan-Meier survival analysis, stratified for TIGIT- and CD155 positivity. While the survival curves of cases with and without TIGIT+ immune cells followed a similar trend (n = 103) (A), CD155 positivity was associated with a significantly worse survival by log-rank testing (n = 95, p = 0.005, 1.0 vs. 2.4 years) (B).

References

    1. Hundal R., Shaffer E.A. Gallbladder cancer: Epidemiology and outcome. Clin. Epidemiol. 2014;6:99–109. doi: 10.2147/CLEP.S37357. - DOI - PMC - PubMed
    1. Valle J., Wasan H., Palmer D.H., Cunningham D., Anthoney A., Maraveyas A., Madhusudan S., Iveson T., Hughes S., Pereira S.P., et al. Cisplatin plus gemcitabine versus gemcitabine for biliary tract cancer. N. Engl. J. Med. 2010;362:1273–1281. doi: 10.1056/NEJMoa0908721. - DOI - PubMed
    1. Kanthan R., Senger J.L., Ahmed S., Kanthan S.C. Gallbladder Cancer in the 21st Century. J. Oncol. 2015;2015:967472. doi: 10.1155/2015/967472. - DOI - PMC - PubMed
    1. Han Y., Liu D., Li L. PD-1/PD-L1 pathway: Current researches in cancer. Am. J. Cancer Res. 2020;10:727–742. - PMC - PubMed
    1. Bates J.P., Derakhshandeh R., Jones L., Webb T.J. Mechanisms of immune evasion in breast cancer. BMC Cancer. 2018;18:556. doi: 10.1186/s12885-018-4441-3. - DOI - PMC - PubMed

LinkOut - more resources