. 2021 Apr 9;12(4):417.
doi: 10.3390/mi12040417.

Electroosmotic Flow of Viscoelastic Fluid through a Constriction Microchannel

Affiliations

Electroosmotic Flow of Viscoelastic Fluid through a Constriction Microchannel

Jianyu Ji et al. Micromachines (Basel). .

Abstract

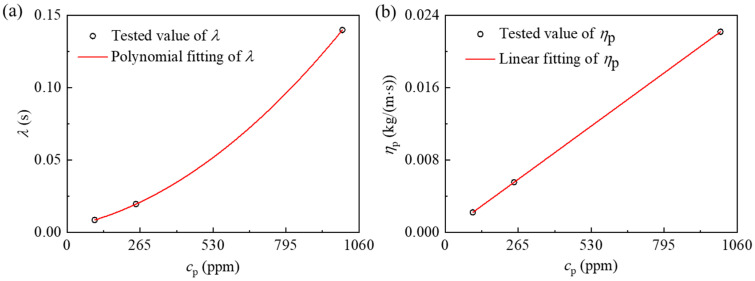
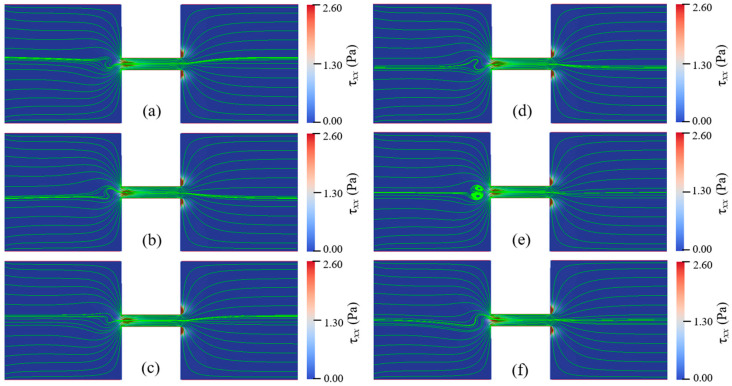
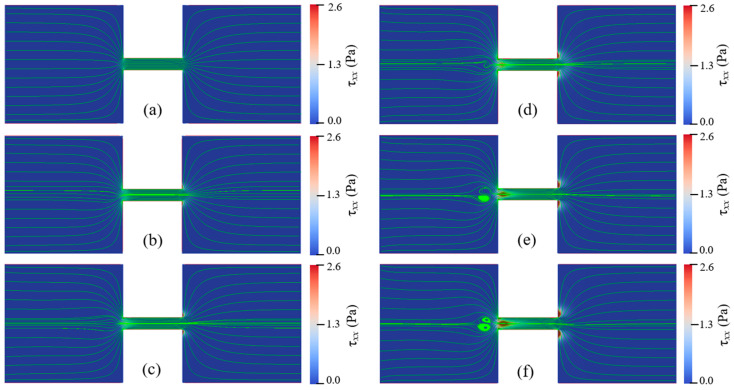
Electroosmotic flow (EOF) has been widely used in various biochemical microfluidic applications, many of which use viscoelastic non-Newtonian fluid. This study numerically investigates the EOF of viscoelastic fluid through a 10:1 constriction microfluidic channel connecting two reservoirs on either side. The flow is modelled by the Oldroyd-B (OB) model coupled with the Poisson-Boltzmann model. EOF of polyacrylamide (PAA) solution is studied as a function of the PAA concentration and the applied electric field. In contrast to steady EOF of Newtonian fluid, the EOF of PAA solution becomes unstable when the applied electric field (PAA concentration) exceeds a critical value for a fixed PAA concentration (electric field), and vortices form at the upstream of the constriction. EOF velocity of viscoelastic fluid becomes spatially and temporally dependent, and the velocity at the exit of the constriction microchannel is much higher than that at its entrance, which is in qualitative agreement with experimental observation from the literature. Under the same apparent viscosity, the time-averaged velocity of the viscoelastic fluid is lower than that of the Newtonian fluid.

Keywords: Oldroyd-B model; elastic instability; electroosmosis; microfluidics; non-Newtonian fluid.


Conflict of interest statement

The authors declare no conflict of interest.

Figures

Figure A1
Figure A1
Three different meshes used for the mesh independence study. The meshes are symmetric with respect to the x-axis and y-axis, and only 1/4 of the total meshes are showed. (a) Mesh 1: 135.192 cells. (b) Mesh 2: 95.252 cells. (c) Mesh 3: 77.192 cells.
Figure A2
Figure A2
Spatial distribution of normal polymeric stress (left) and streamlines (right) for mesh 1 (the top row), mesh 2 (the middle row), and mesh 3 (the bottom row) at t=1.78 s.
Figure A3
Figure A3
Spatial distribution of velocity magnitudes at t=1.78 s. (a) Velocity magnitudes profile at x = 0. (b) Velocity magnitudes profile at y = 0.
Figure A4
Figure A4
Boundary conditions with n denoting the normal unit vector on the surface.
Figure A5
Figure A5
Streamlines of 150 ppm PAA solution under Eapp=600 V/cm at different times: (a) 1.70 s, (b) 1.72 s, (c) 1.74 s, (d) 1.76 s, (e) 1.78 s, (f) 1.80 s. Zeta potential is −70 mV. The color bar represents the elastic normal stress τxx.
Figure A6
Figure A6
Streamlines of 150 ppm PAA solution under Eapp=600 V/cm at different times: (a) 1.70 s, (b) 1.72 s, (c) 1.74 s, (d) 1.76 s, (e) 1.78 s, (f) 1.80 s. Zeta potential is −150 mV. The color bar represents the elastic normal stress τxx.
Figure A7
Figure A7
Velocity magnitudes at (0,0) for 150 ppm PAA solution with zeta potentials of −70 mV and −150 mV under Eapp=600 V/cm.
Figure A8
Figure A8
Reynolds number (a) and Weissenberg number (b) of the viscoelastic EOF under the conditions of Figure 15.
Figure 1
Figure 1
Schematic diagram of a constriction microchannel connecting two reservoirs at both ends. The solid walls of reservoirs and the constriction channel are negatively charged, and an electric field is imposed by applying a potential difference between anode and cathode positioned in two fluid reservoirs.
Figure 2
Figure 2
Computational mesh used in the numerical simulations. Mesh of the whole geometry (a) and detailed view of the mesh at channel corner (b), at reservoir corner (c), and in the constriction microchannel (d).
Figure 3
Figure 3
(a) Polymer dynamic viscosity ηp and (b) relaxation time λ as a function of the polyacrylamide (PAA) concentration, cp.
Figure 4
Figure 4
(a) Electric potential distribution (blue dash line shows the relative position of the geometry) along the x-axis; (b) the x-component velocity at the center of the constriction microchannel, u(0,y), for Newtonian model (solid line) and OB model (symbol).
Figure 5
Figure 5
The x-component velocity profile of viscoelastic electroosmotic flow (EOF) between two parallel plates: (a) Zeta potential is −10 mV; (b) zeta potential is −110 mV. Analytical result of Afonso et al. [28] (solid line) and current numerical result (symbol). The analytical solution is described in Appendix A.
Figure 6
Figure 6
Instability of EOF with cp=500 ppm and Eapp=100 V/cm. Streamlines at different times: (a) 1.71 s, (b) 1.75 s, (c) 1.79 s, (d) 1.83 s, (e) 1.87 s, and (f) 1.91 s. The color bar represents the elastic normal stress τxx. (Supplementary Materials Video S1).
Figure 7
Figure 7
Instability of EOF with cp=150 ppm and Eapp=600 V/cm. Streamlines at different times: (a) 1.70 s, (b) 1.72 s, (c) 1.74 s, (d) 1.76 s, (e) 1.78 s, and (f) 1.80 s. The color bar represents the elastic normal stress τxx. (Supplementary Materials Video S2).
Figure 8
Figure 8
Velocity magnitudes at three different locations ((3Hc,0), (0,0), (3Hc,0)). (a) cp=150 ppm and Eapp=600 V/cm, (b) cp=500 ppm and Eapp=100 V/cm.
Figure 9
Figure 9
Spatial distribution of the elastic normal stress τxx for cp=150 ppm and Eapp=600 V/cm at t=1.78 s.
Figure 10
Figure 10
Streamlines and velocity magnitude for cp=150 ppm and Eapp=600 V/cm and Newtonian fluid at t=1.78 s: (a) 150 ppm PAA solution, (b) Newtonian fluid with same total viscosity as 150 ppm PAA solution, (c) velocity magnitude profiles at 2x/Hc=±5, (d) velocity magnitudes profiles at y=0 (The blue dash lines show the position of the contraction microchannel). The color bar represents the velocity magnitude U.
Figure 11
Figure 11
Streamlines of Newtonian fluid and PAA solutions with different concentrations under Eapp=600 V/cm at 1.70 s: (a) Newtonian fluid, (b) cp=100 ppm, (c) cp=150 ppm, (d) cp=200 ppm, (e) cp=250 ppm, and (f) cp=500 ppm. The color bar represents the elastic normal stress τxx.
Figure 12
Figure 12
Streamlines in microchannel of Newtonian fluid and PAA solutions with different concentrations under Eapp=600 V/cm at 1.7 s: (a) Newtonian fluid, (b) cp=100 ppm, (c) cp=150 ppm, (d) cp=200 ppm, (e) cp=250 ppm, and (f) cp=500 ppm. The color bar represents the elastic normal stress τxx.
Figure 13
Figure 13
Streamlines for 150 ppm PAA solution under different Eapp at 1.78 s: (a) 100 V/cm, (b) 200 V/cm. (c) 300 V/cm, (d) 400 V/cm, (e) 500 V/cm, (f) 600 V/cm. The color bar represents the elastic normal stress τxx.
Figure 14
Figure 14
Streamlines in microchannel of 150 ppm PAA solution under different Eapp at 1.78 s: (a) 100 V/cm, (b) 200 V/cm. (c) 300 V/cm, (d) 400 V/cm, (e) 500 V/cm, and (f) 600 V/cm. The color bar represents the elastic normal stress τxx.
Figure 15
Figure 15
Flow map in cp-Eapp space for EOF of PAA solutions flowing through a 10:1:10 constriction/expansion microchannel. Up-right of the fitting curve are the conditions that trigger the vortex in the EOF.
Figure 16
Figure 16
Time averaged cross-sectional average velocity at the center of the constriction microchannel (x = 0): (a) Average velocity, (b) comparison of average velocity (with deviation) and Helmholtz–Smoluchowski velocity (lines).

Similar articles

Cited by

References

    1. Gao M., Gui L. A handy liquid metal based electroosmotic flow pump. Lab Chip. 2014;14:1866–1872. doi: 10.1039/C4LC00111G. - DOI - PubMed
    1. Peng R., Li D. Effects of ionic concentration gradient on electroosmotic flow mixing in a microchannel. J. Colloid Interface. Sci. 2015;440:126–132. doi: 10.1016/j.jcis.2014.10.061. - DOI - PubMed
    1. Palyulin V.V., Ala-Nissila T., Metzler R. Polymer translocation: The first two decades and the recent diversification. Soft Matter. 2014;10:9016–9037. doi: 10.1039/C4SM01819B. - DOI - PubMed
    1. Takamura Y., Onoda H., Inokuchi H., Adachi S., Oki A., Horiike Y. Low-voltage electroosmosis pump for stand-alone microfluidics devices. Electrophoresis. 2003;24:185–192. doi: 10.1002/elps.200390012. - DOI - PubMed
    1. Li L., Wang X., Pu Q., Liu S. Advancement of electroosmotic pump in microflow analysis: A review. Anal. Chim. Acta. 2019;1060:1–16. doi: 10.1016/j.aca.2019.02.004. - DOI - PubMed

LinkOut - more resources