. 2021 Apr 21;22(9):4302.
doi: 10.3390/ijms22094302.

Hypoxia-Induced FAM13A Regulates the Proliferation and Metastasis of Non-Small Cell Lung Cancer Cells

Affiliations

Hypoxia-Induced FAM13A Regulates the Proliferation and Metastasis of Non-Small Cell Lung Cancer Cells

Iwona Ziółkowska-Suchanek et al. Int J Mol Sci. .

Abstract

Hypoxia in non-small cell lung cancer (NSCLC) affects cancer progression, metastasis and metabolism. We previously showed that FAM13A was induced by hypoxia in NSCLC but the biological function of this gene has not been fully elucidated. This study aimed to investigate the role of hypoxia-induced FAM13A in NSCLC progression and metastasis. Lentiviral shRNAs were used for FAM13A gene silencing in NSCLC cell lines (A549, CORL-105). MTS assay, cell tracking VPD540 dye, wound healing assay, invasion assay, BrdU assay and APC Annexin V staining assays were performed to examine cell proliferation ability, migration, invasion and apoptosis rate in NSCLC cells. The results of VPD540 dye and MTS assays showed a significant reduction in cell proliferation after FAM13A knockdown in A549 cells cultured under normal and hypoxia (1% O2) conditions (p < 0.05), while the effect of FAM13A downregulation on CORL-105 cells was observed after 96 h exposition to hypoxia. Moreover, FAM13A inhibition induced S phase cell cycle arrest in A549 cells under hypoxia conditions. Silencing of FAM13A significantly suppressed migration of A549 and CORL-105 cells in both oxygen conditions, especially after 72 and 96 h (p < 0.001 in normoxia, p < 0.01 after hypoxia). It was showed that FAM13A reduction resulted in disruption of the F-actin cytoskeleton altering A549 cell migration. Cell invasion rates were significantly decreased in A549 FAM13A depleted cells compared to controls (p < 0.05), mostly under hypoxia. FAM13A silencing had no effect on apoptosis induction in NSCLC cells. In the present study, we found that FAM13A silencing has a negative effect on proliferation, migration and invasion activity in NSCLC cells in normal and hypoxic conditions. Our data demonstrated that FAM13A depleted post-hypoxic cells have a decreased cell proliferation ability and metastatic potential, which indicates FAM13A as a potential therapeutic target in lung cancer.

Keywords: FAM13A gene; cell migration; cell proliferation; hypoxia; invasion; non-small cell lung cancer.


Conflict of interest statement

The authors declare no conflict of interest.

Figures
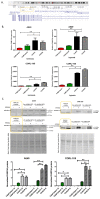
Figure 1
Figure 1
Generating lung cancer cell lines with FAM13A knockdown. FAM13A shRNAs (FAM13Ash1, FAM13Ash2) and control shRNAs (CtrNT2, CtrSCR) lentiviral particles were used to generate the stable transduction of A549 and CORL-105 cell lines. Transduction efficiency was assessed with the GFP marker. Knockdown of FAM13A mRNA and FAM13A protein was confirmed by real-time quantitative PCR and western-blot analysis. (A) Schematic indicating the binding site for the shRNA in the FAM13A mRNA. Two shRNA transcripts were designed using UCSC Broad Institute GPP Web Portal, against a coding sequence common to the most FAM13A isoforms with the RhoGAP functional domain. (B) RT-qPCR analysis of FAM13A expression in A549 and CORL-105 cell lines cultured under normoxia and hypoxia conditions for 72 h. Relative expression of FAM13A mRNA was determined as the mean normalized expression of FAM13A mRNA/GUSβ mRNA. The experiments were performed in triplicate and repeated three times. The data are presented as the mean ± SD (* p < 0.05, ** p < 0.01, unpaired one-tailed t-test). (C) Western blot (WB) analysis of FAM13A expression in A549 and CORL-105 cell lines cultured under normoxia and hypoxia for 72 h. Relative FAM13A protein (117 kDA) amount was significantly decreased in FAM13A sh1/sh2RNA cells. Strong FAM13A expression was induced in controls (CtrNT2, CtrSCR) A549 or CORL105 cells after 72 h of hypoxia (+) compared to normoxia (-). Cropped images are displayed, full-length blots are presented in Supplementary Materials Figure S4. Total protein was used for normalization. Representative stain-free total protein blots are presented. The normalized protein factors are given at bar charts (N-normoxia, H-hypoxia, bars with texture). The data are presented as the mean ± SD (* p < 0.05, ** p < 0.01, unpaired one-tailed t-test).
Figure 2
Figure 2
Silencing of FAM13A decreases lung cancer cell proliferation. Decreased A549 and CORL-105 cell proliferation after FAM13A gene knockdown was assessed using Violet Proliferation Dye (VPD450) and MTS test. After VPD450 staining the cells were cultured for 4–5 days in hypoxia and normal oxygen tension. The fluorescence intensity was measure by flow cytometry. During MTS test the cells were cultured in 96-well plates and cultured for two days in normal and hypoxic atmosphere. After 24/48 h the CellTiter 96® AQueous One Solution Reagent was added and the absorbance was read at 490 nm with a microplate reader. (A) Representative images of A549 cells stained with VPD450. Fluorescence intensity was measured from Day 1 (0 time point) to 5 (96 h time point) by flow cytometry (Flow Sight®, Amnis, Seattle, WA, USA). Each cell is represented by a row of three images acquired simultaneously in flow, from left to right: channel 1—brightfield (gray), channel 2—fluorescence from GFP (transduced cells green) and channel 7—fluorescence from dye VPD450 applied to viable cells (purple). (B) Representative histogram plots displaying changes in VPD450 fluorescence intensity of A549 cells upon FAM13A knockdown (FAM13Ash1, red) and control (CtrNT2, green), in three time points: 0 h, 48 h, 96 h. (C,D) Cell growth kinetics was determined by proliferation index (PI) of FAM13Ash1 (red), FAM13Ash2 (green) and CtrNT2 (black), CtrSCR (grey) control cells in A549 (C) and CORL-105 (D). The difference in PI ratios at 24 h, 48 h, 72 h between FAM13A depleted cells and control cells was evaluated under normoxia (left panel) and hypoxia (right panel). A two-way ANOVA with Bonferroni posttest was used for statistical analysis. * p < 0.05 indicates a significant difference, as marked by an asterisk. The experiments were performed in triplicate and repeated three times. (E,F) Cell proliferation assessed by MTS assay. The results are given for A549 (E) and CORL-105 cells (F). Cell proliferation rate of FAM13Ash1 (red), FAM13Ash2 (green) cells and control cells (mean combined for CtrNT2 and SCR, black) was determined by CellTiter™ AQueous assay (MTS). The difference in cell proliferation rate of FAM13A depleted cells compared to control cells was evaluated under normoxia (bars without filling) or hypoxia (bars with texture) conditions. Data are means ± SEM (n = 4), * p < 0.05, ** p < 0.01, two-way ANOVA.
Figure 3
Figure 3
Knockdown of FAM13A suppresses A549 lung cancer cell migration. The migration of A549 cells with FAM13A knockdown and controls was monitored for 96 h under normoxia and hypoxia conditions. The inserts were used to generate a defined gap for measuring the migratory rates. Cell suspension in low serum media was added to the open end at the top of the insert. The cells were incubated overnight to form the monolayer. After 24 h inserts were removed from wells. The wound healing closure was visualized under a light microscope, images were taken in 24 h intervals. (A) Representative microscopy images of the wound-healing assay (magnification, ×10). Images of FAM13A depleted cells (FAM13Ash1) and control (CtrSCR) cells, cultured under normoxia (left panel) and hypoxia (right panel), were taken at the time 0 h, 48 h and 96 h after wounding. (B,C) Wound confluence (% of wound closure) was measured at 5 time points (0 h, 24 h, 48 h, 72 h, 96 h) after wound generation for FAM13A knockdown A549 cells: FAM13Ash1 (red), FAM13Ash2 (green) and controls: CtrNT2 (black), CtrSCR (grey) cultured in normal oxygen concentration (B) and under hypoxia (C). Data is expressed as the mean ± SEM of n = 3 exp. A two-way ANOVA with Bonferroni posttest was used for statistical analysis. p values ≤ 0.05 indicate a significant difference, as marked by an asterisk (** p < 0.01, *** p < 0.001). The experiments were performed in triplicate and repeated three times.
Figure 4
Figure 4
Knockdown of FAM13A suppresses CORL-105 lung cancer cell migration. The migration of A549 cells with FAM13A knockdown and controls was monitored for 96 h under normoxia and hypoxia conditions. The inserts were used to generate a defined gap for measuring the migratory rates. Cell suspension in low serum media was added to the open end at the top of the insert. The cells were incubated overnight to form the monolayer. After 24 h inserts were removed from wells. The wound healing closure was visualized under a light microscope, images were taken in 24 h intervals. (A) Representative microscopy images of the wound-healing assay (magnification, ×10). Images of FAM13A depleted cells (FAM13A sh2RNA) and control (Ctr sh1RNA NT2) cells, cultured under normoxia (left panel) and hypoxia (right panel), were taken at the time 0 h, 48 h and 96 h of wounding. (B,C) Wound confluence (% of wound closure) was measured at 5 time points (0 h, 24 h, 48 h, 72 h, 96 h) after wound generation for FAM13A knockdown CORL-105 cells: FAM13A sh1RNA (red), FAM13A sh2RNA (green) and controls: Ctr shRNA NT2 (black), Ctr shRNA SCR (grey) cultured in normal oxygen concentration (B) and under hypoxia (C). Data is expressed as the mean ± SEM of n = 3 exp. A two-way ANOVA with Bonferroni posttest was used for statistical analysis. p values ≤ 0.05 indicate a significant difference, as marked by an asterisk (** p < 0.01, *** p < 0.001). The experiments were performed in triplicate and repeated three times.
Figure 5
Figure 5
FAM13A knockdown inhibits invasion of A549 lung cancer cells. The influence of FAM13A silencing on the invasive properties of A549 cells was analyzed by the transwell invasion assay. Amount of A549 invasive cells were quantified using a colorimetric method (OD 560 nm) after 48 h of culture in normoxia and hypoxia. (A) OD values of invasive A549 FAM13Ash1 (red), FAM13Ash2 (green) cells were decreased remarkably compared with control CtrNT2 (light grey), CtrSCR (dark grey) cells, cultured under normoxia (left panel) and hypoxia (right panel). Data is expressed as the mean ± SEM of n = 3 exp., student’s t-test (two-tailed), * p < 0.05. (B) Averages of invasion rates are presented for A549 FAM13Ash1 and FAM13Ash2 (red), cells measured as percent of control CtrNT2 (light grey), CtrSCR (dark grey) cells, cultured under normoxia (left panel) and hypoxia (right panel). Data is expressed as the mean ± SEM of n = 3 exp., student’s t-test (two-tailed), * p < 0.05.
Figure 6
Figure 6
Stable knockdown of FAM13A promotes F-actin cytoskeletal reorganization. The FAM13A depleted cells (FAM13Ash1, FAM13Ash2) and control (CtrSCR, CtrNT2) cells, were cultured under normoxia and hypoxia for 72 h. After incubation, the cells were fixed, permeabilized and stained with Alexa Fluor® 568 phalloidin for actin filaments visualization and DAPI for nuclei. The cells were observed under a fluorescence microscope. Example images (scale bar 25 μm) of the diverse F-actin organization phenotypes induced by FAM13A gene silencing in normoxia (A) and chronic hypoxia (B). A549 cells with stable FAM13A knockdown (gfp positive) were stained with phalloidin for F-actin (red), with DAPI for nuclei (blue). Representative single and overlaid images of immunofluorescence staining were present (magnification, ×63). The arrowheads indicate F-actin aggregates and accumulations of F-actin punctae.

Similar articles

Cited by

References

    1. Molina J.R., Yang P., Cassivi S.D., Schild S.E., Adjei A.A. Non-small cell lung cancer: Epidemiology, risk factors, treatment, and survivorship. Mayo Clin. Proc. 2008;83:584–594. doi: 10.1016/S0025-6196(11)60735-0. - DOI - PMC - PubMed
    1. Cheng T.-Y.D., Cramb S.M., Baade P.D., Youlden D.R., Nwogu C., Reid M.E. The International Epidemiology of Lung Cancer: Latest Trends, Disparities, and Tumor Characteristics. J. Thorac. Oncol. 2016;11:1653–1671. doi: 10.1016/j.jtho.2016.05.021. - DOI - PMC - PubMed
    1. Jing X., Yang F., Shao C., Wei K., Xie M., Shen H., Shu Y. Role of hypoxia in cancer therapy by regulating the tumor microenvironment. Mol. Cancer. 2019;18:157. doi: 10.1186/s12943-019-1089-9. - DOI - PMC - PubMed
    1. Minakata K., Takahashi F., Nara T., Hashimoto M., Tajima K., Murakami A., Nurwidya F., Yae S., Koizumi F., Moriyama H., et al. Hypoxia induces gefitinib resistance in non-small-cell lung cancer with both mutant and wild-type epidermal growth factor receptors. Cancer Sci. 2012;103:1946–1954. doi: 10.1111/j.1349-7006.2012.02408.x. - DOI - PMC - PubMed
    1. Dengler V.L., Galbraith M.D., Espinosa J.M. Transcriptional regulation by hypoxia inducible factors. Crit. Rev. Biochem. Mol. Biol. 2014;49:1–15. doi: 10.3109/10409238.2013.838205. - DOI - PMC - PubMed

MeSH terms