Review
. 2021 Apr 21;10(5):833.
doi: 10.3390/plants10050833.

Recent 1D and 2D TD-NMR Pulse Sequences for Plant Science

Affiliations
Review

Recent 1D and 2D TD-NMR Pulse Sequences for Plant Science

Tatiana Monaretto et al. Plants (Basel). .

Abstract

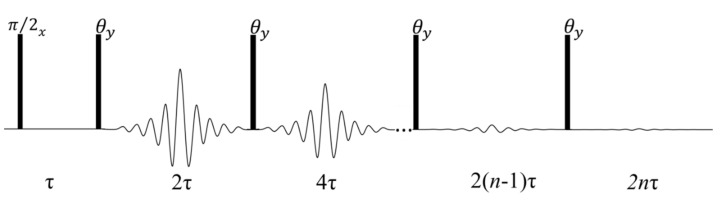
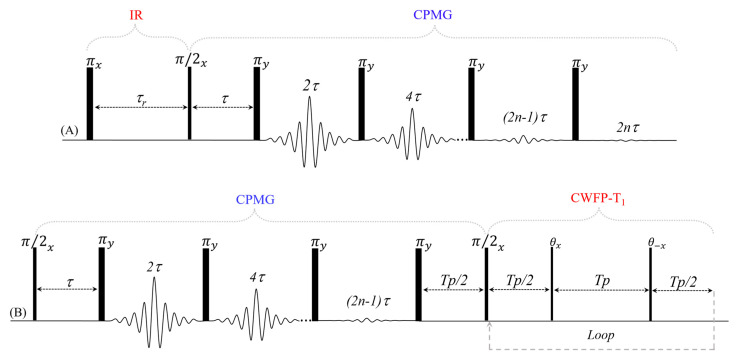
Time domain nuclear magnetic resonance (TD-NMR) has been widely applied in plant science in the last four decades. Several TD-NMR instruments and methods have been developed for laboratory, green-house, and field studies. This mini-review focuses on the recent TD-NMR pulse sequences applied in plant science. One of the sequences measures the transverse relaxation time (T2) with minimal sample heating, using a lower refocusing flip angle and consequently lower specific absorption rate than that of conventional CPMG. Other sequences are based on a continuous wave free precession (CWFP) regime used to enhance the signal-to-noise ratio, to measure longitudinal (T1) and transverse relaxation time in a single shot experiment, and as alternative 2D pulse sequences to obtain T1-T2 and diffusion-T1 correlation maps. This review also presents some applications of these sequences in plant science.

Keywords: CWFP; Carr-Purcell-Meiboom-Gill (CPMG); relaxation measurement: pulse sequence; time domain NMR.


Conflict of interest statement

The authors declare no conflict of interest.

Figures

Figure 1
Figure 1
Diagram for the CPMG pulse sequence (θ = π) and for the CPMG with a low flip refocusing pulse (θ ≤ π).
Figure 2
Figure 2
Experimental CPMG signals using refocusing angle pulse of π, 3π/4, π/2, and π/4 for soybean oil in different homogeneities (Δν = 15 Hz (A,B) and 100 Hz (C,D)), τ = 0.1 ms (left) and 0.4 ms (right). Adapted from publication [16]. Copyright (2011), with permission from Elsevier.
Figure 3
Figure 3
(A) CPMG signals and (B) its inverse Laplace transform (ILT) obtained from castor bean seed (oil signal) using π (red line) and π/2 (black line) as a refocusing pulse. The dashed-dotted line in (B) is the guide to the signal center.
Figure 4
Figure 4
Correlation between T2 values obtained with the CPMG and LRFA–CPMG methods using π/2 as a refocusing and different oilseed species; r = 0.98. Adapted from Publication [16]. Copyright (2011) with permission from Elsevier.
Figure 5
Figure 5
Continuous wave free precession (CWFP) pulse sequences that generate a special steady state free precession (SSFP) condition in the magnetization, when Tp < T2* < T2.
Figure 6
Figure 6
NMR signals simulated numerically using T1 = 150 ms, T2 = 50 ms, T2* = 0.5 ms, and different Tp values. (A) Tp = 2.9T2*, (B,C) Tp < T2*. The frequency offset is 8.333 kHz (A,B) and 6.666 kHz (C). Adapted from Publication [28].
Figure 7
Figure 7
Typical CWFP signal (magnitude) obtained from the first pulse. The dark grey region indicates the initial signal that oscillates for a time that is dependent on T2*. When the oscillation stops, a quasi-stationary state (QSS) signal is observed (red arrow). The light grey region shows T* decay from the QSS to the steady state regime |Mss| (white region).
Figure 8
Figure 8
Pulse diagram for CP–CWFP (ϕ = x)/CP–CWFPx−x (ϕ = −x) pulse sequences. Adapted from publication [15]. Copyright (2015), with permission from Elsevier.
Figure 9
Figure 9
Pulse diagram for the CWFP–T1 pulse sequences. Adapted from publication [14]. Copyright (2016), with permission from Elsevier.
Figure 10
Figure 10
Inversion recovery signal (black points) and the CWFP–T1 signal (gray line) obtained for a water sample at 27 °C. Adapted from publication [14]. Copyright (2016), with permission from Elsevier.
Figure 11
Figure 11
Pulse diagram for (A) conventional IR–CPMG and (B) CPMG–CWFP–T1 sequences.
Figure 12
Figure 12
T1–T2 correlation maps for castor beans oil at 40 °C (A,B) and green banana at 22 °C (C,D) obtained by the CPMG–CWFP–T1 (A,C) and IR-CPMG (B,D) methods.
Figure 13
Figure 13
PGSE–CWFP–T1 diagram pulse sequence to obtain fast D–T1 correlation maps. Adapted from publication [12]. Copyright (2020) with permission from Elsevier.
Figure 14
Figure 14
D–T1 correlation maps obtained by (A) IR–PGSE and (B) PGSE–CWFP–T1 methods for asparagus stems oriented parallel (in black) and perpendicular (in red) to the PFG. Adapted from publication [12]. Copyright (2020) with permission from Elsevier.

References

    1. Todt H., Burk W., Guthausen G., Guthausen A., Kamlowski A., Schmalbein D. Quality control with time-domain NMR. Eur. J. Lipid Sci. Technol. 2001;103:835–840. doi: 10.1002/1438-9312(200112)103:12<835::AID-EJLT835>3.0.CO;2-P. - DOI
    1. Cobo M.F., Deublein E.J., Haber A., Kwamen R., Nimbalkar M., Decker F. TD–NMR in Quality Control: Standard Applications. In: Webb G.A., editor. Modern Magnetic Resonance. Springer International Publishing; Berlin/Heidelberg, Germany: 2017. pp. 1–18.
    1. Colnago L.A., Wiesman Z., Pages G., Musse M., Monaretto T., Windt C.W., Rondeau-Mouro C. Low field, time domain NMR in the agriculture and agrifood sectors: An overview of applications in plants, foods and biofuels. J. Magn. Reson. 2021;323:106899. doi: 10.1016/j.jmr.2020.106899. - DOI - PubMed
    1. Kingsley P.B. Methods of measuring spin-lattice (T1) relaxation times: An annotated bibliography. Concepts Magn. Reson. 1999;11:243–276. doi: 10.1002/(SICI)1099-0534(1999)11:4<243::AID-CMR5>3.0.CO;2-C. - DOI
    1. Meiboom S., Gill D. Modified Spin-Echo Method for Measuring Nuclear Relaxation Times. Rev. Sci. Instrum. 1958;29:688–691. doi: 10.1063/1.1716296. - DOI

LinkOut - more resources